Exploring Infrastructure Inventory  
Once your cloud accounts are connected and the first scan completes, the Infrastructure Discovery section in Wallarm Console provides a full view of your cloud resources, their security posture, and configuration changes over time. The section has two top-level tabs: Graph and Security.
Graph
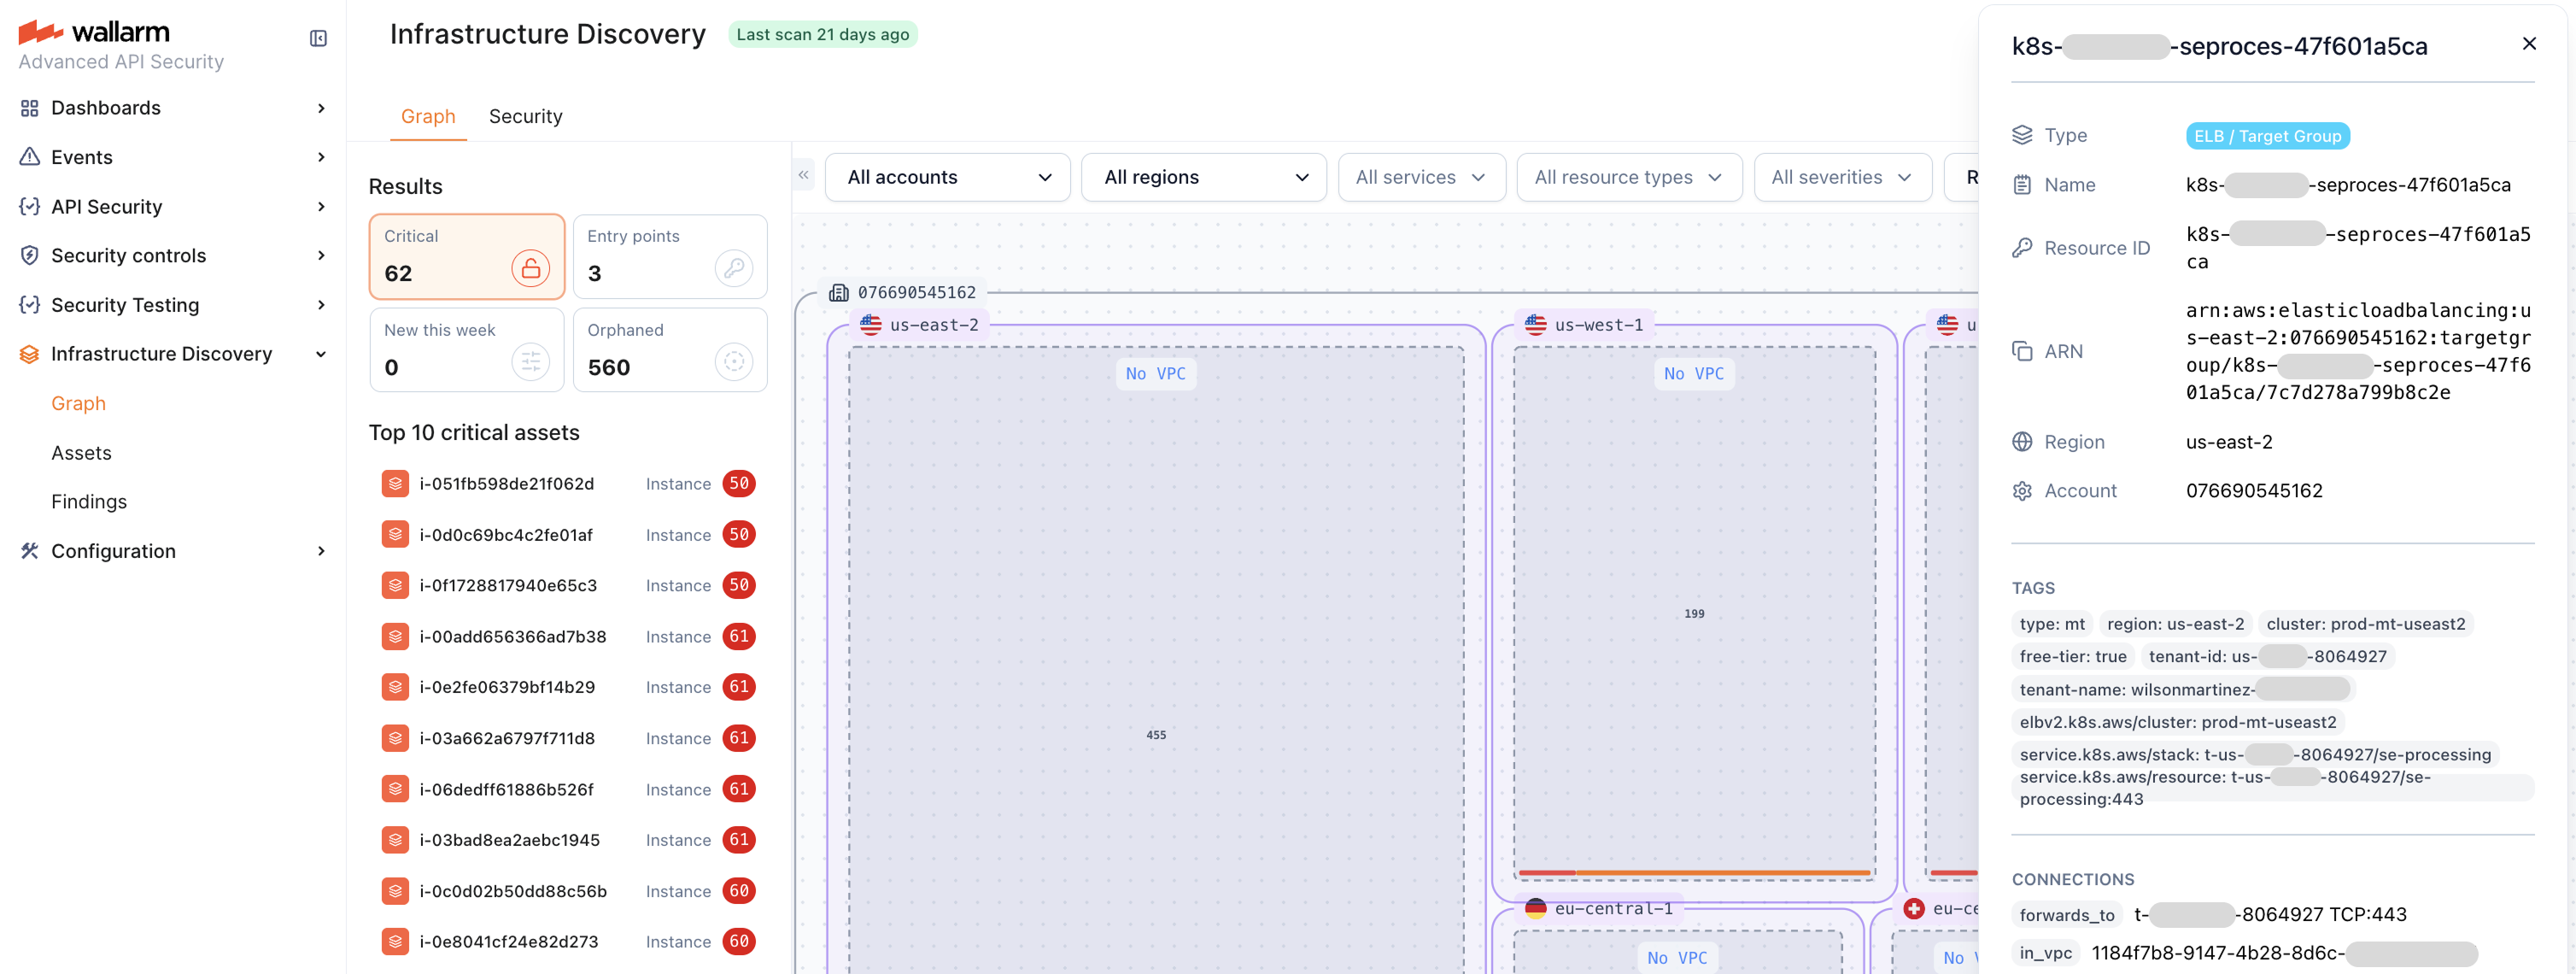
The Graph tab provides a visual map of your cloud resources and how they connect. Resources are grouped by account, region, and VPC, so you can read the topology at any zoom level — from a high-level cluster view down to individual resources and their connections. From the graph you can trace how traffic reaches a resource (for example, from an internet gateway through a load balancer to a compute instance) and spot isolated or unexpectedly connected resources.
Use the filters on the left to narrow the graph by account, region, service, resource type, and severity. The Results panel summarizes the current view with counts such as Critical findings, Entry points, New this week, and Orphaned (unconnected) resources, plus a Top 10 critical assets list.
Select any node to open its details and highlight its connections.
Security
The Security tab is the primary place to review your security posture.
Assets
The Assets sub-tab lists every discovered resource. Use the filter bar to narrow the inventory by service, resource type, region, or account; free-text search matches against resource names and IDs.
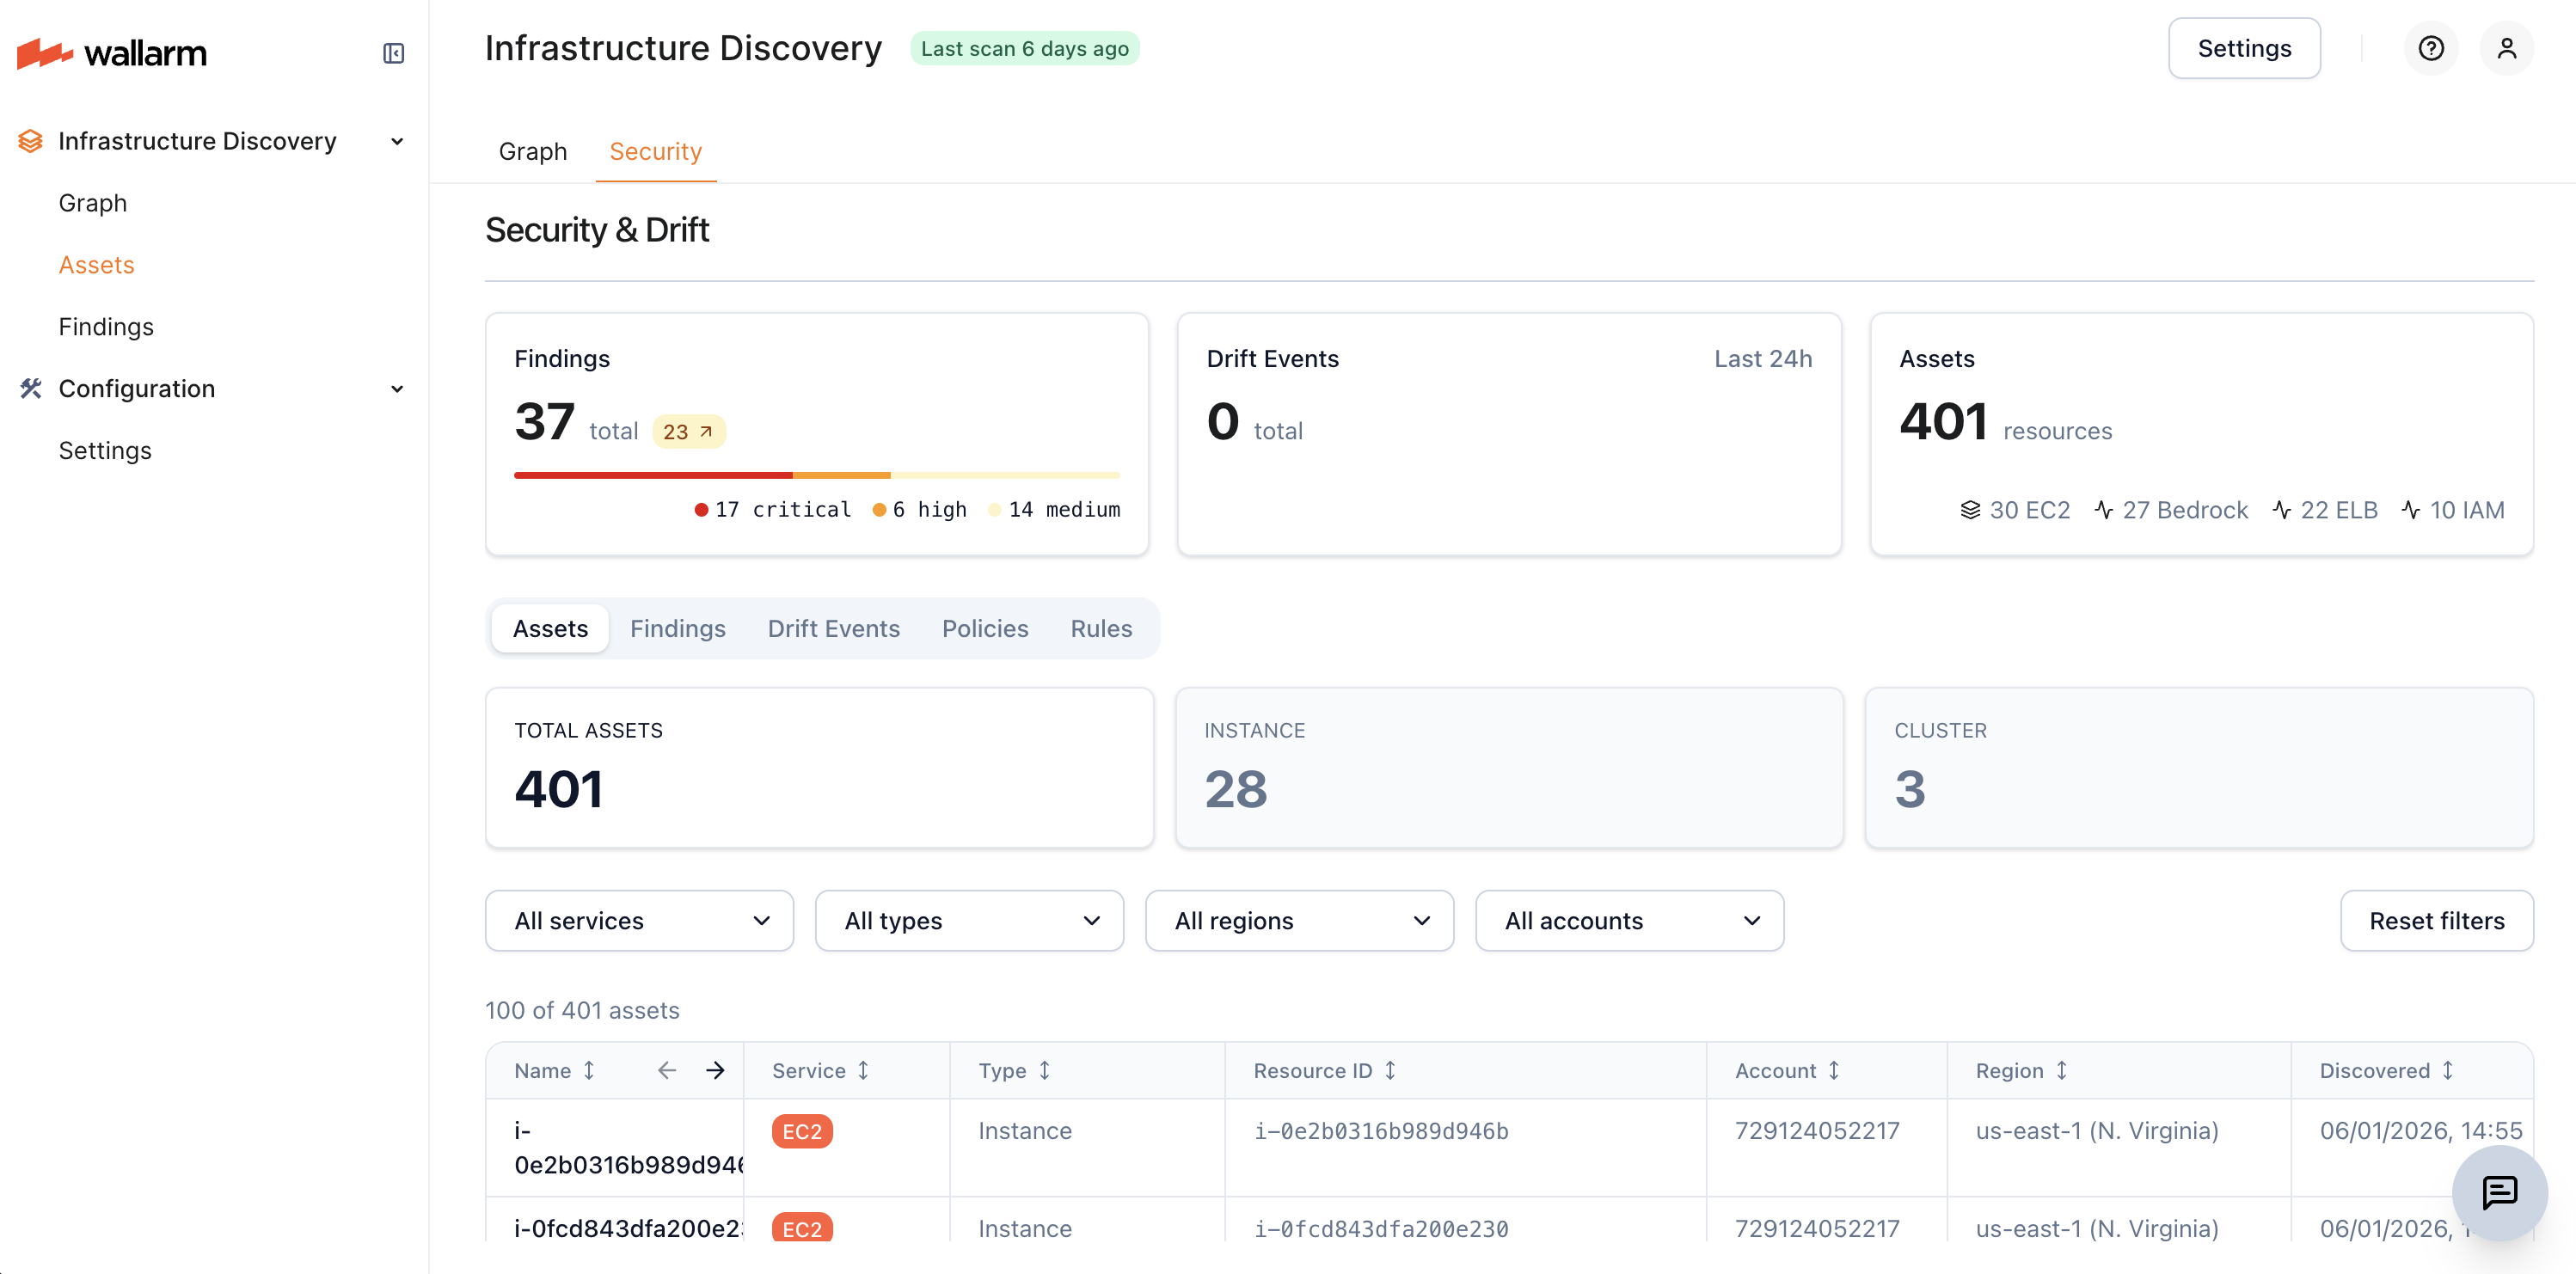
Click any row to open the resource detail view, which collects everything Infrastructure Discovery captured for the resource — identifiers and metadata, full configuration, cloud-provider tags, related security findings, and more. Use View in Graph in the detail view to jump to the resource in the Graph tab.
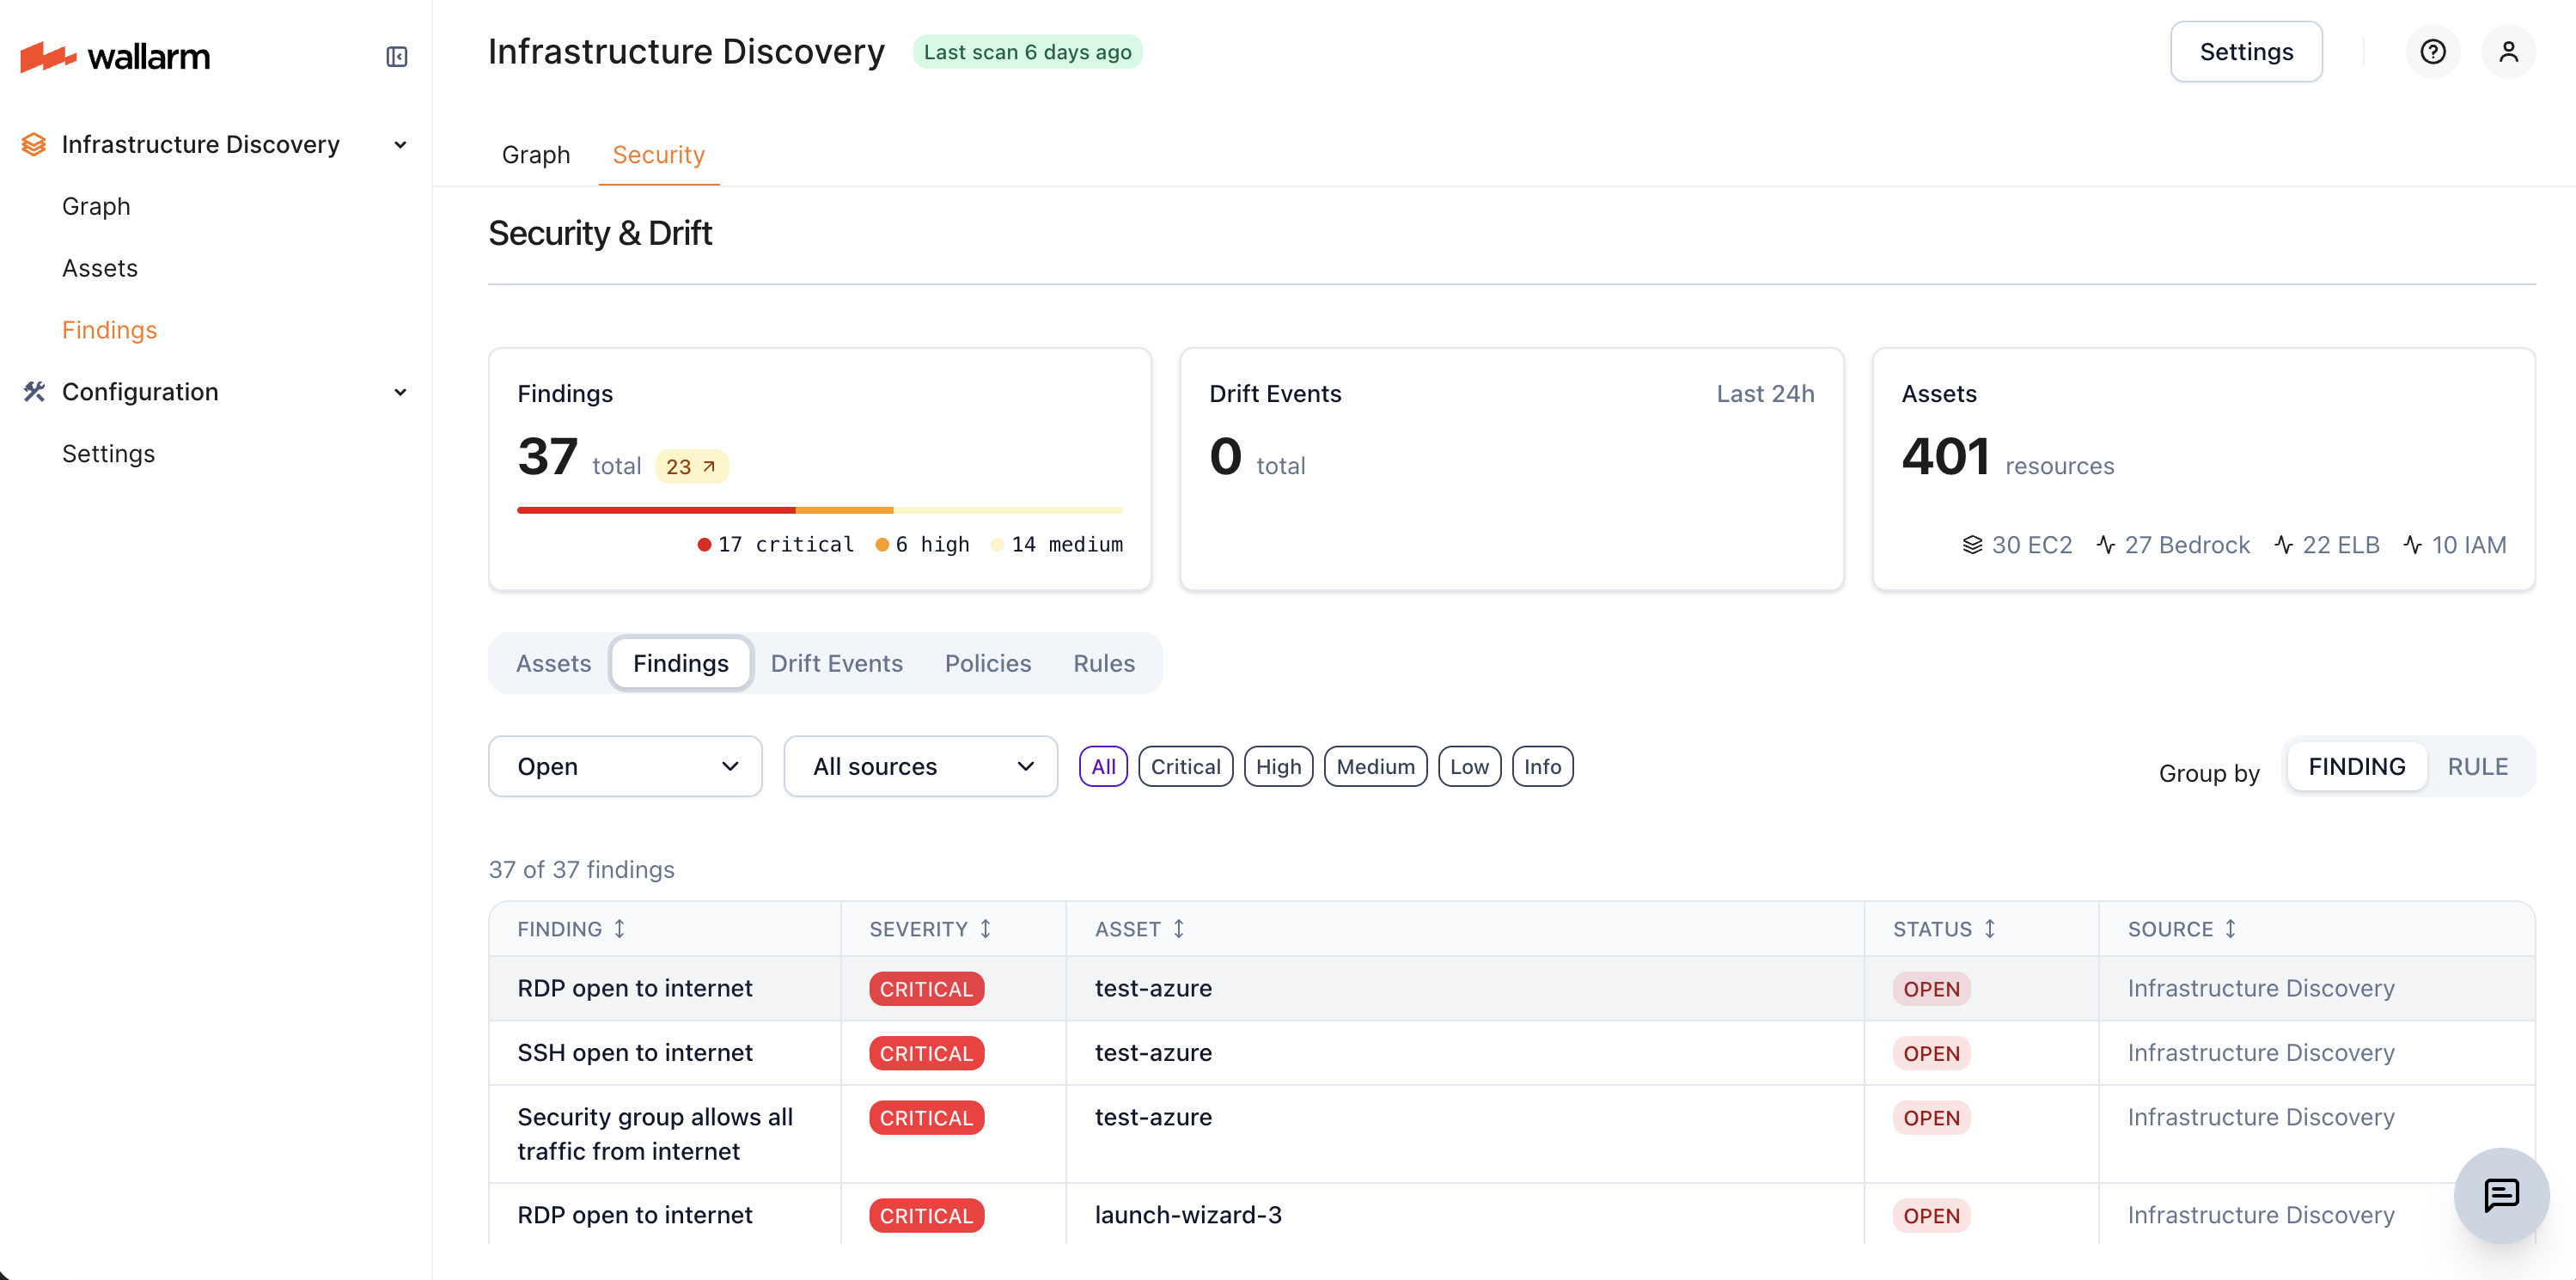
Findings
A finding is a security issue Wallarm spotted on one of your resources — for example, an EC2 instance with a public IP, an SSH port open to the world, or an EKS cluster with a public API endpoint.
Each finding tells you what the issue is, how serious it is (Critical to Info), which resource it affects, and how to fix it. Findings from AWS Security Hub appear in the same list, alongside Wallarm's own.
The Findings sub-tab is where you browse them. Filter by severity, status, or source. Switch between by finding and by rule views to look at the issues themselves or at the rules producing them.
AWS Security Hub findings
If you use AWS Security Hub, Infrastructure Discovery imports its findings and correlates them with the resources it has discovered. Imported findings keep their original product attribution and appear alongside Wallarm's own findings. No extra configuration is required beyond the Security Hub permissions in the connected account's policy.
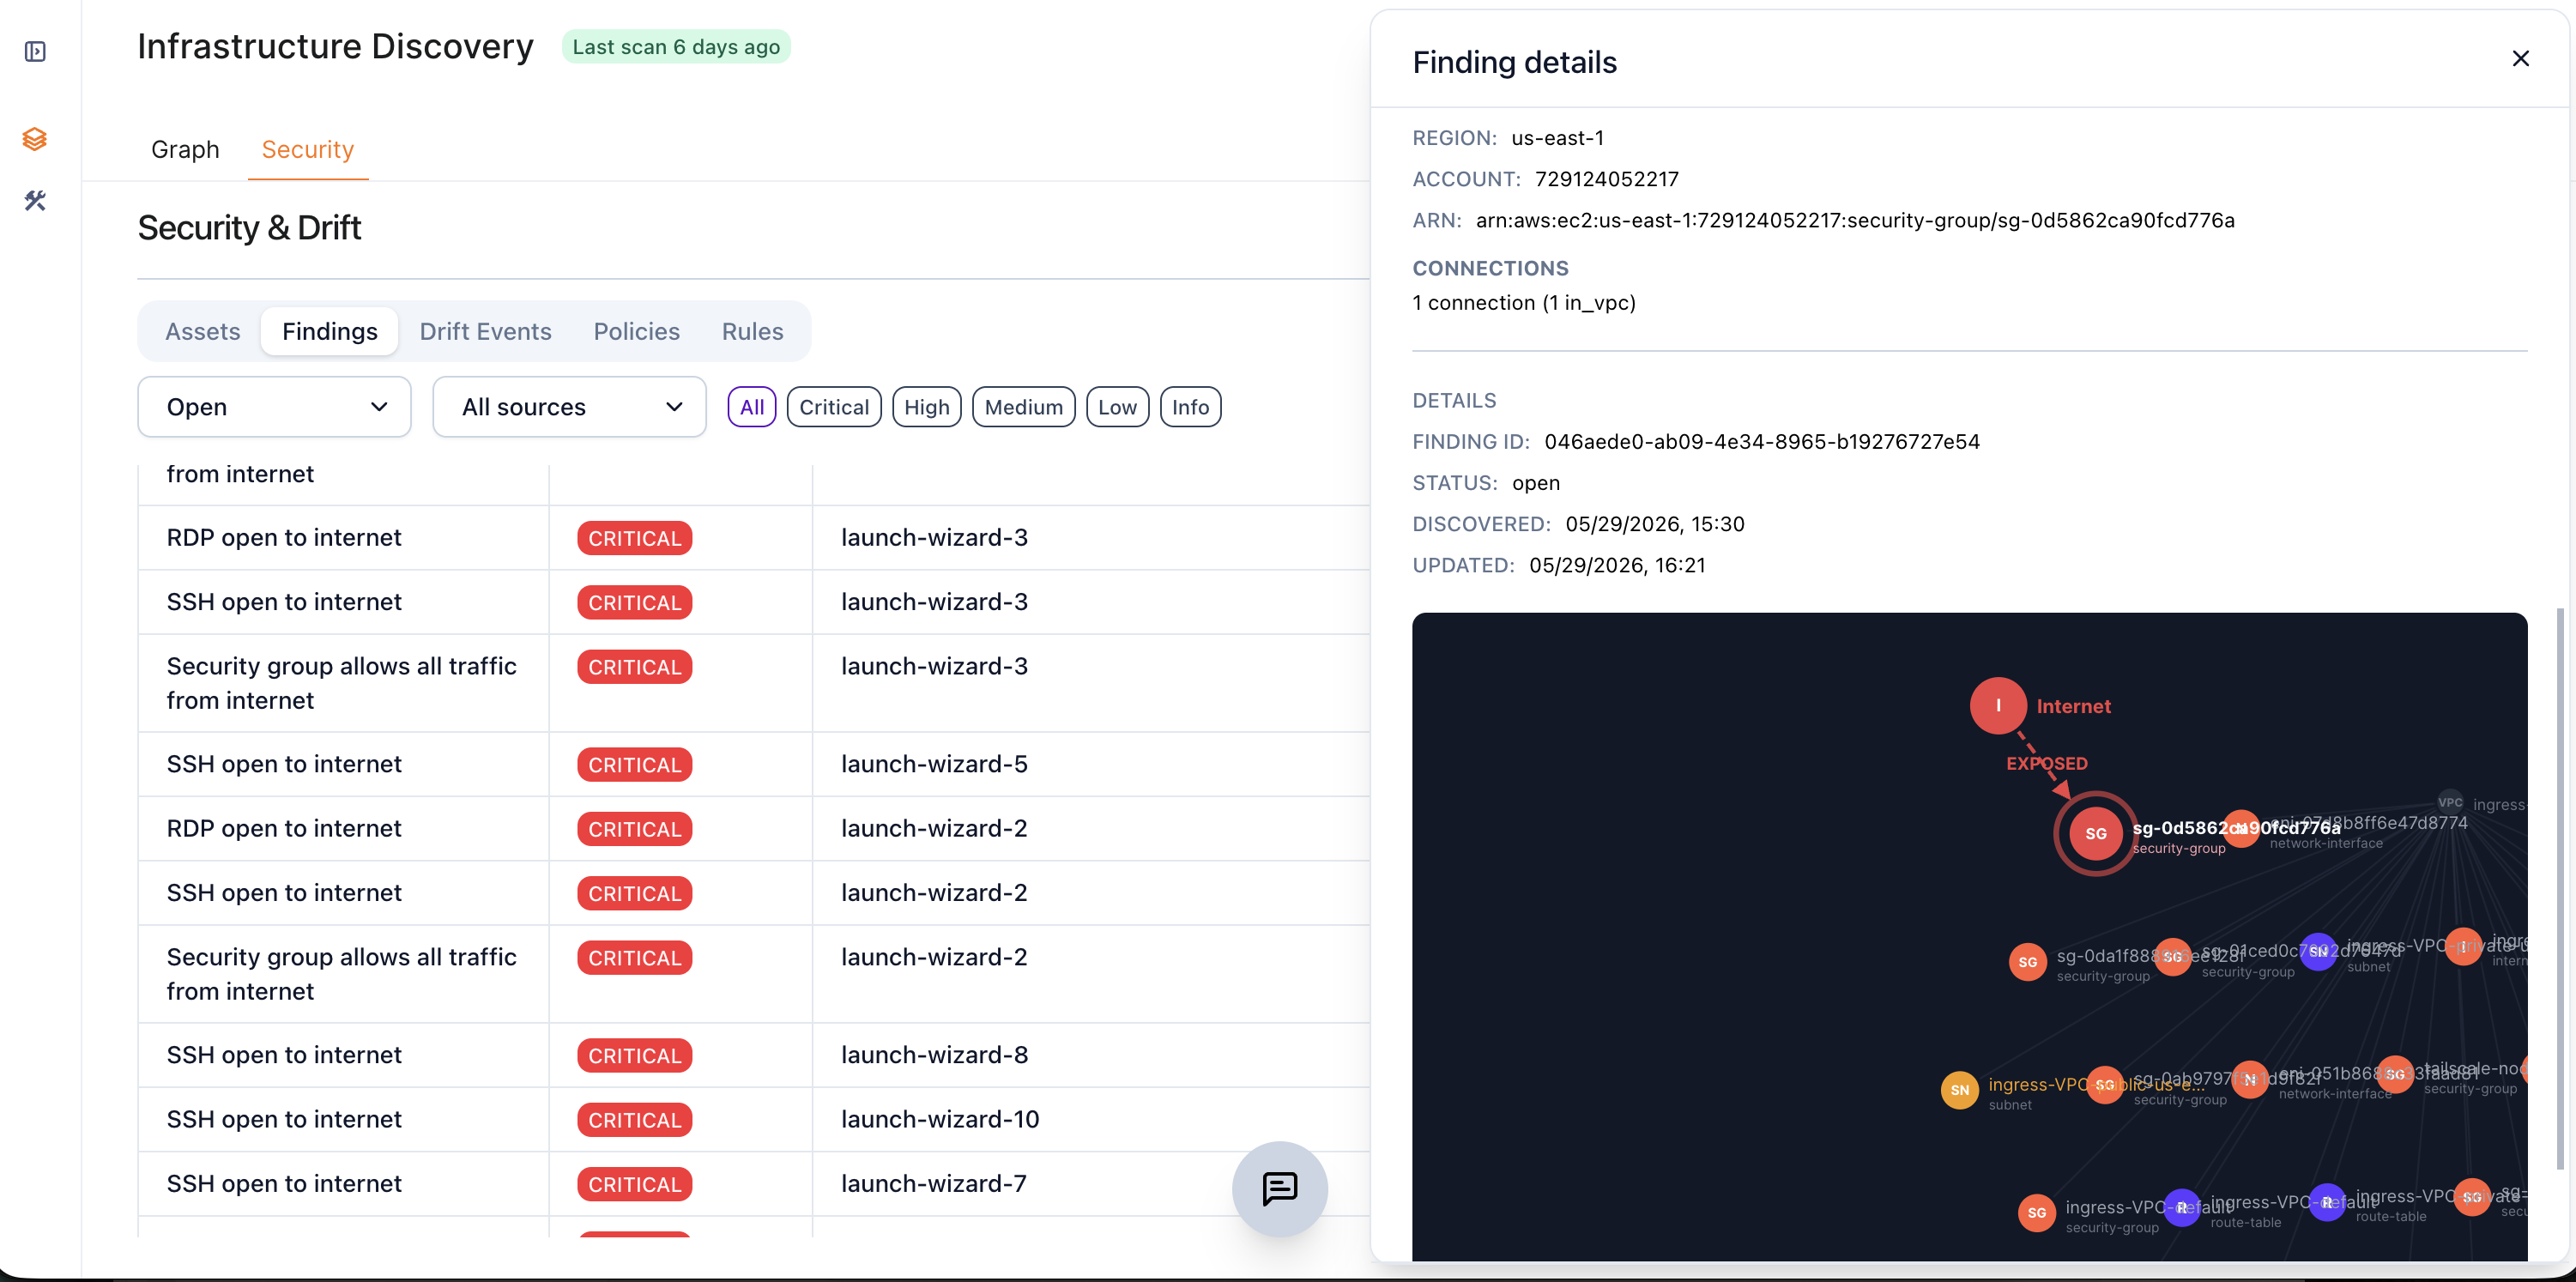
Finding details and blast radius
Click any finding to open its detail view, which shows:
-
The severity, the source (and the AWS Security Hub product, if imported), a plain-language explanation, and a recommended fix
-
The rule that produced the finding
-
The affected asset — name, type, service, region, account, and ARN
-
Connections — the resources directly related to the affected asset, with their relationship types (for example,
associated_with_eni) -
The finding status and when it was first discovered
-
A blast radius graph that visualizes how the asset is exposed and which resources are reachable from it — for example, an
Internet → exposed → assetpath through the connected network interfaces and instances
AI-assisted finding enrichment
On paid subscription plans, Infrastructure Discovery can use AI to enrich findings. For each finding, the AI:
-
Adds a plain-language explanation of why the configuration is risky
-
Suggests a recommendation for remediation
-
Reduces noise by assessing whether a rule match is a genuine concern in context
AI enrichment processes only the resource metadata already collected during scanning, and it never modifies your cloud resources.
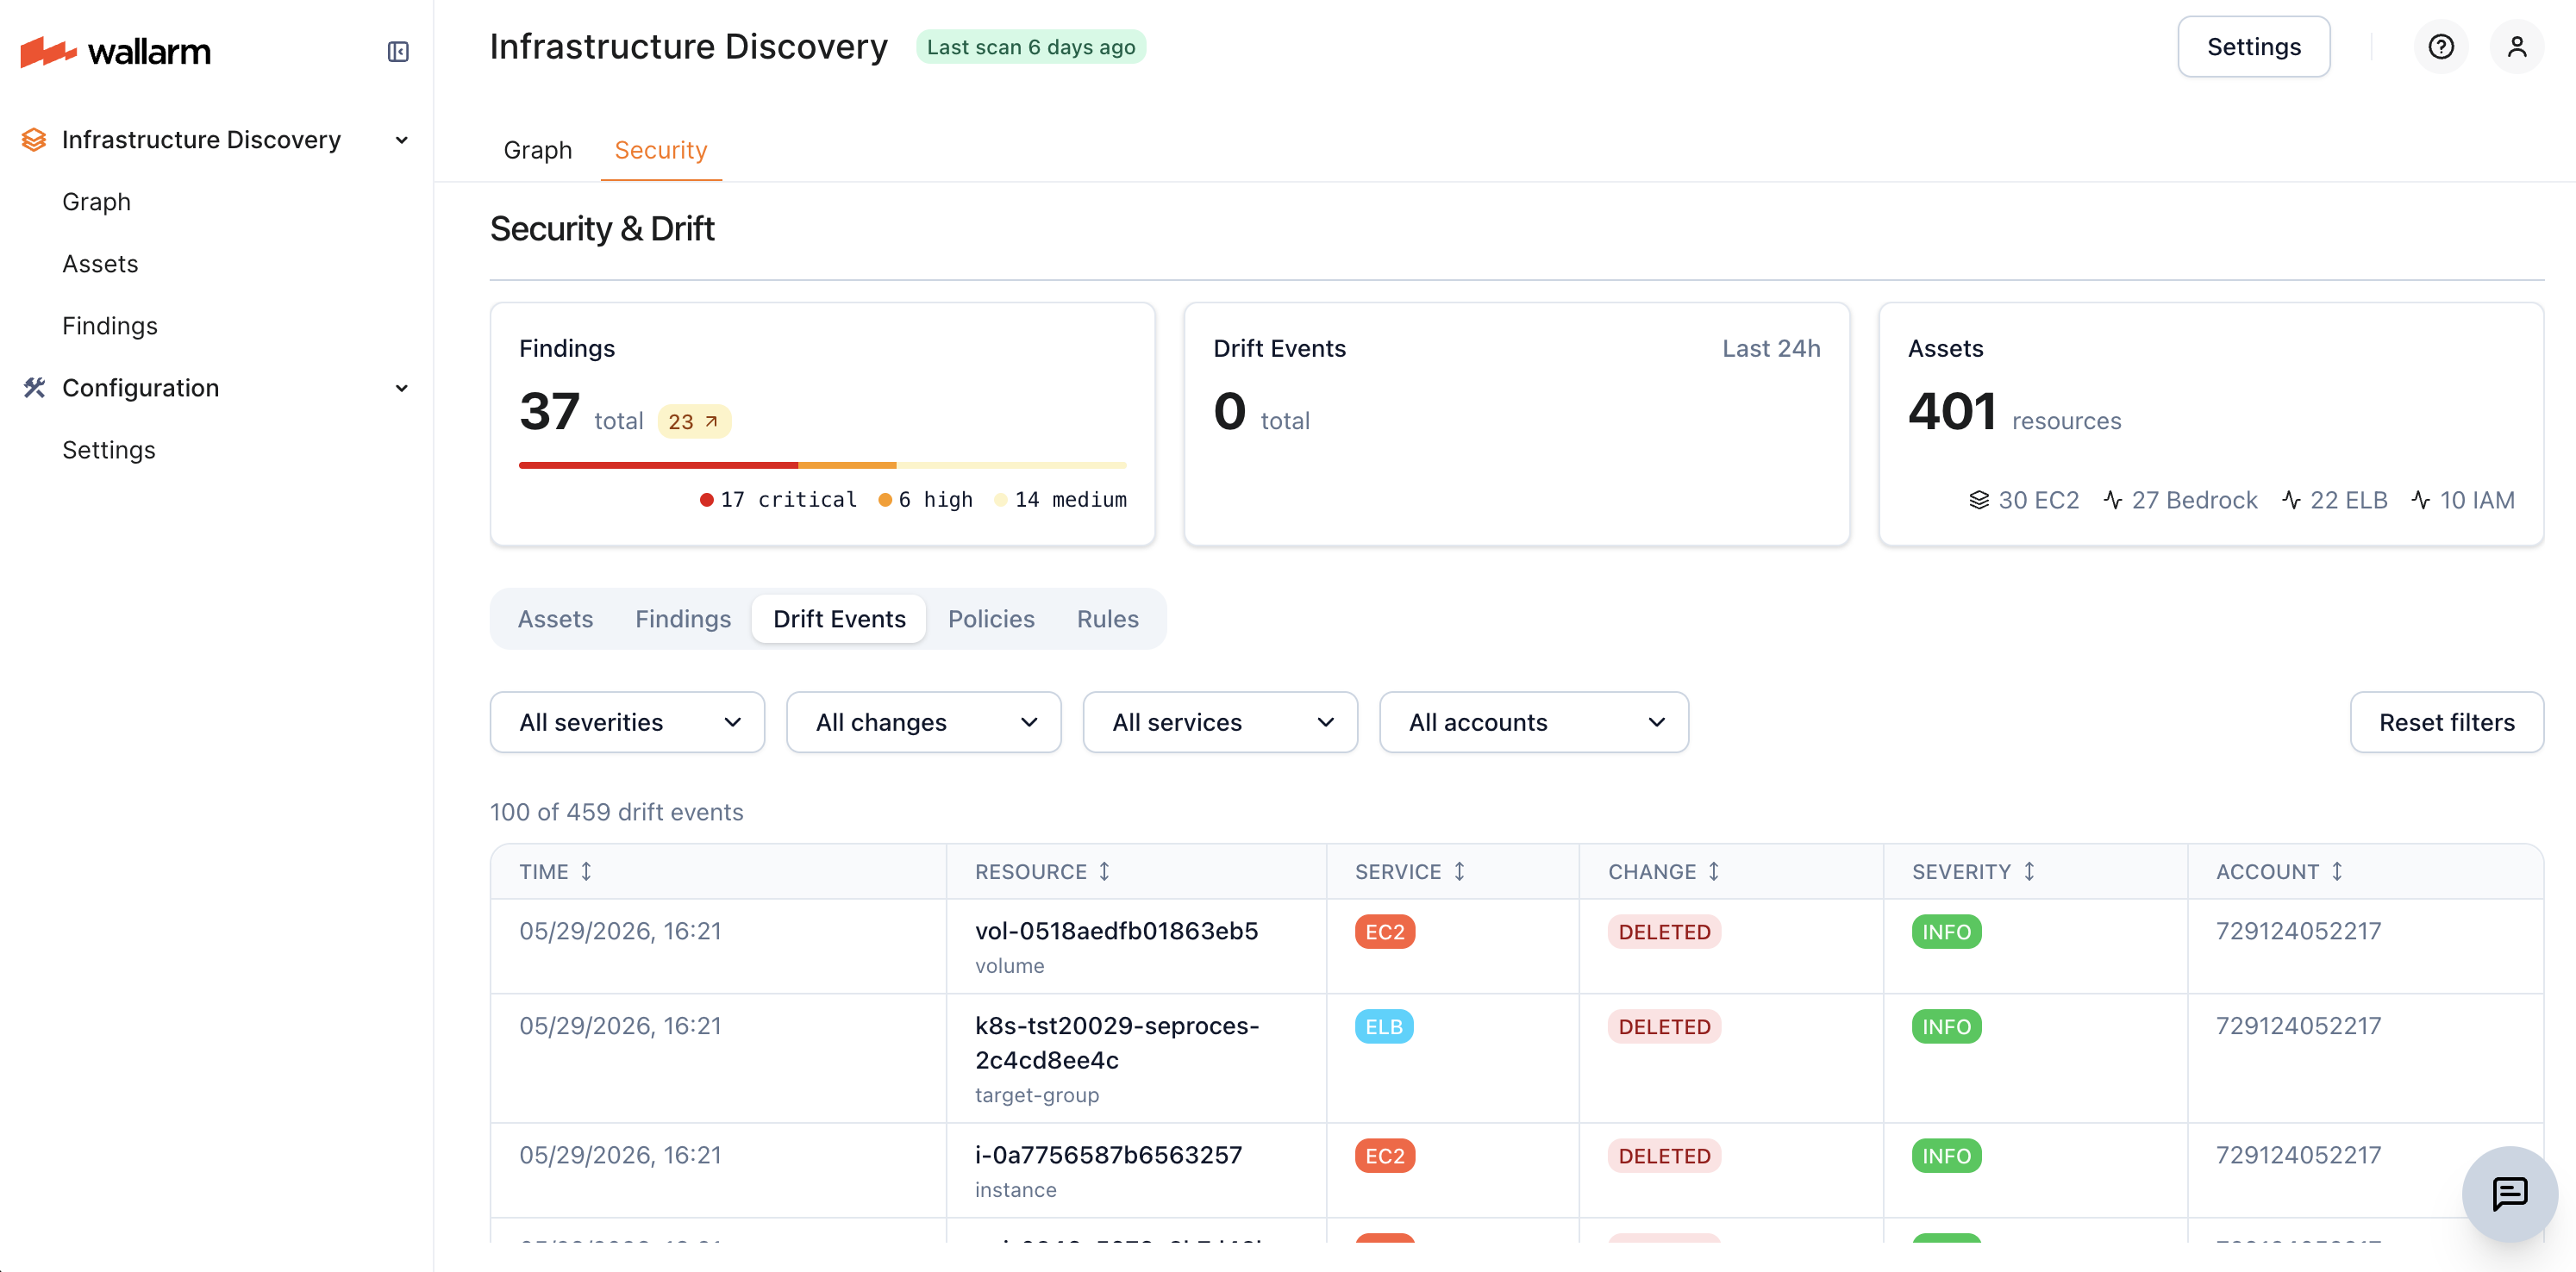
Drift Events
Infrastructure Discovery automatically compares each scan to the previous one and records configuration changes on the Drift Events sub-tab. Each change is classified as one of:
-
Created — a resource newly discovered since the last scan
-
Updated — a resource whose configuration changed between scans
-
Deleted — a resource that was present in the previous scan but is no longer found
Filter drift events by severity, change type, service, and account to review what changed in a given scan cycle.
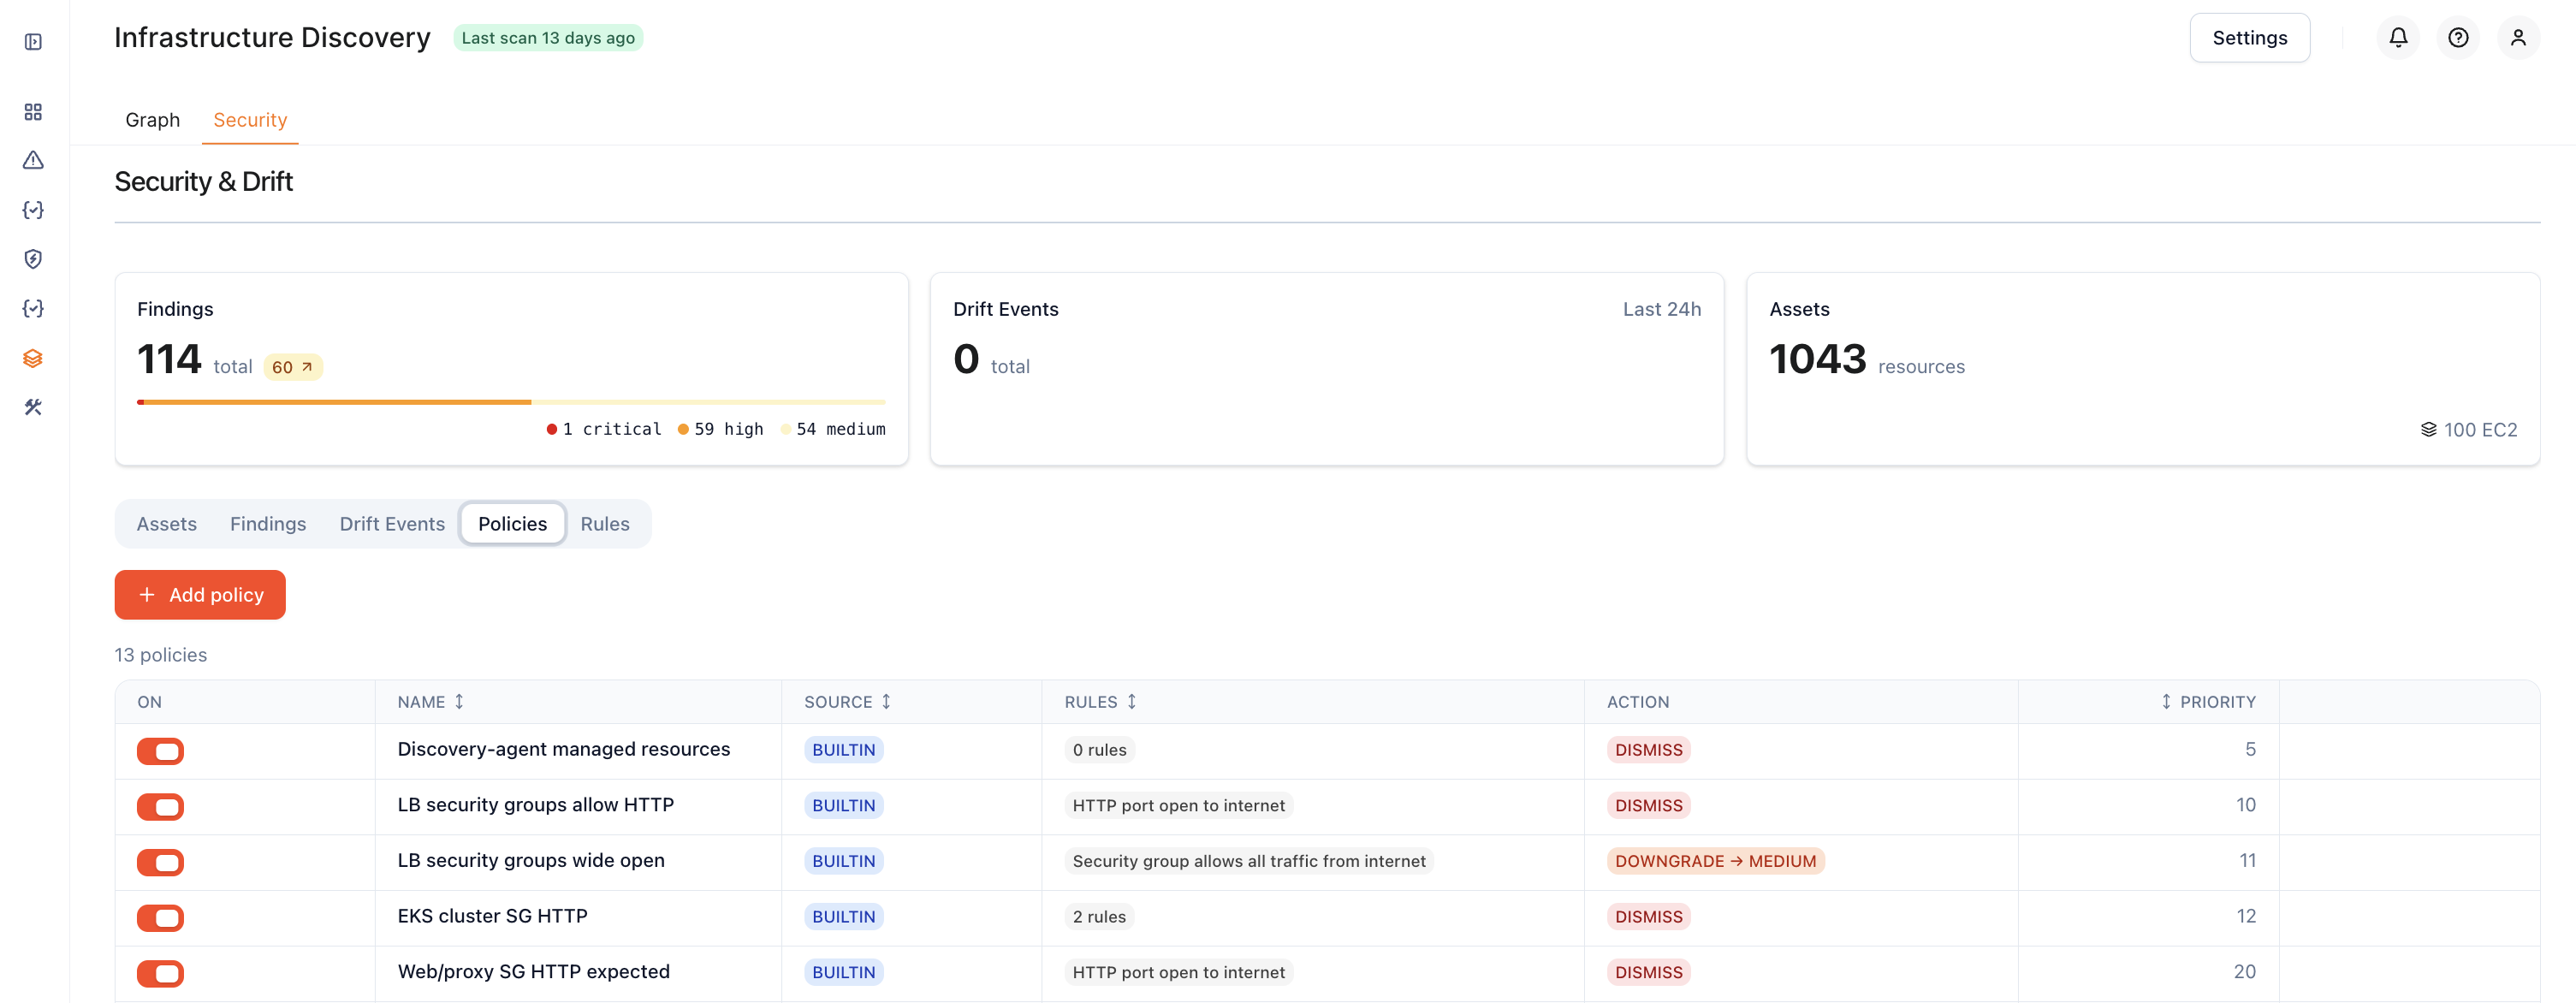
Policies
Where rules decide what counts as a risky configuration, policies decide what to do with the resulting finding — dismiss it (hide intentional setups), downgrade or upgrade its severity, or annotate it with a note.
Add custom policies with Add policy, or disable an existing one with its toggle to take it out of effect without deleting it. Policy conditions are written in Common Expression Language (CEL) and validated server-side.
Rules
Rules define conditions that flag potentially risky configurations. Infrastructure Discovery ships with built-in rules and lets you add your own custom rules with the Add rule button on this sub-tab. Custom rule conditions are expressed in Common Expression Language (CEL) and validated server-side before the rule is saved.
Built-in rules check for common issues such as:
-
Security groups open to the internet, including SSH, RDP, and database ports
-
Compute instances with public IP addresses
-
Internet-facing load balancers
-
Load balancer listeners that serve HTTP without redirecting to HTTPS
-
EKS clusters with a public API endpoint or without secrets encryption
-
Deletion of critical infrastructure resources
-
Misconfigured or stale Amazon Bedrock resources, such as agents without instructions or knowledge bases without storage
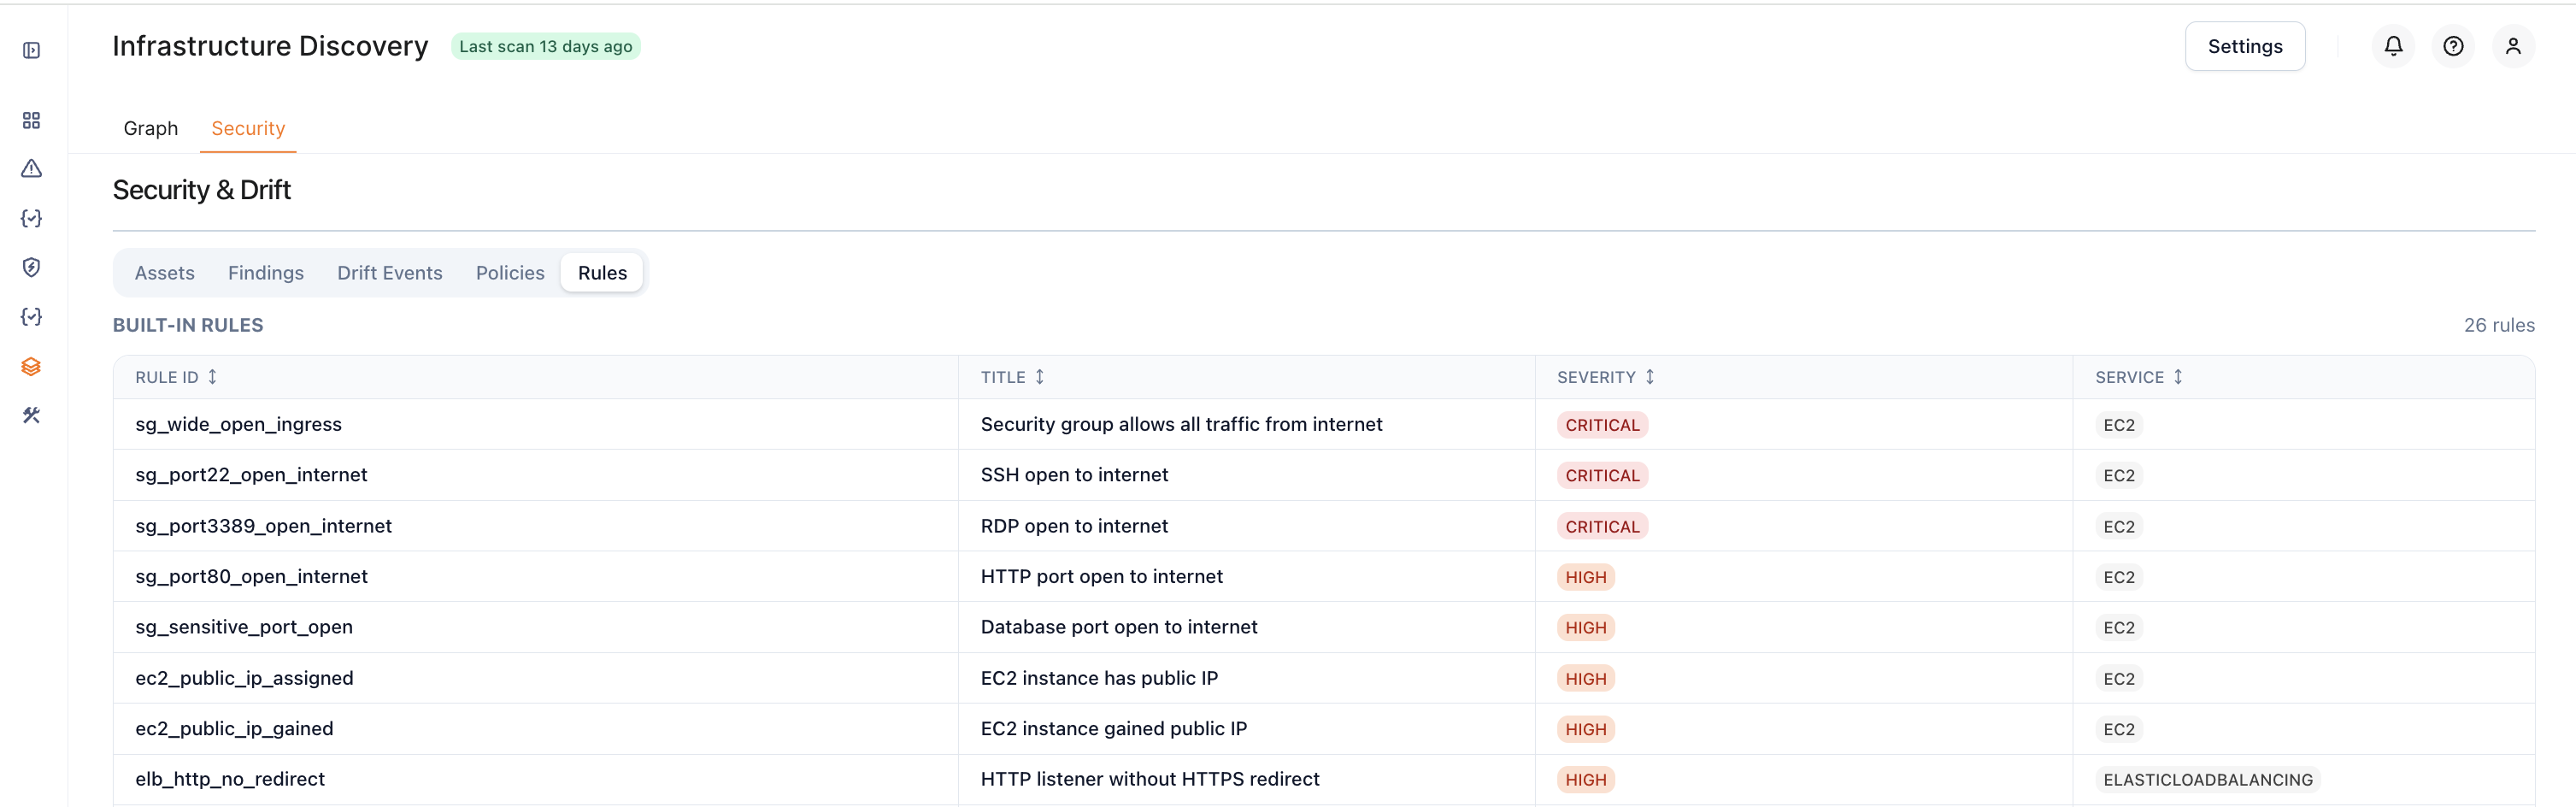
Each rule match produces a finding with a severity level (Critical, High, Medium, Low, Info).