Exploring API Sessions  
As soon as Wallarm's API Sessions has identified user sessions related to your applications, you can explore them in the API Sessions section of Wallarm Console. Learn from this article how to go through the discovered data.
Full context of threat actor activities
Once the malicious request is detected by Wallarm and displayed in the Attacks or Incidents section as the part of some attack, you can see the full context of this request: to which user session it belongs and what the full sequence of requests in this session is. This allows you to investigate all activity of the threat actor to understand attack vectors and what resources can be compromised.
To perform this analysis, in Wallarm Console → Attacks or Incidents, access the attack, and then specific request details. In request details, click Explore in API Sessions. Wallarm will open the API Session section filtered: the session that the initial request belongs to is displayed; only the initial request is displayed within this session.
Remove the filter by request ID to see all other requests in the session: now you have the full picture of what was going on within the session the malicious request belongs to.
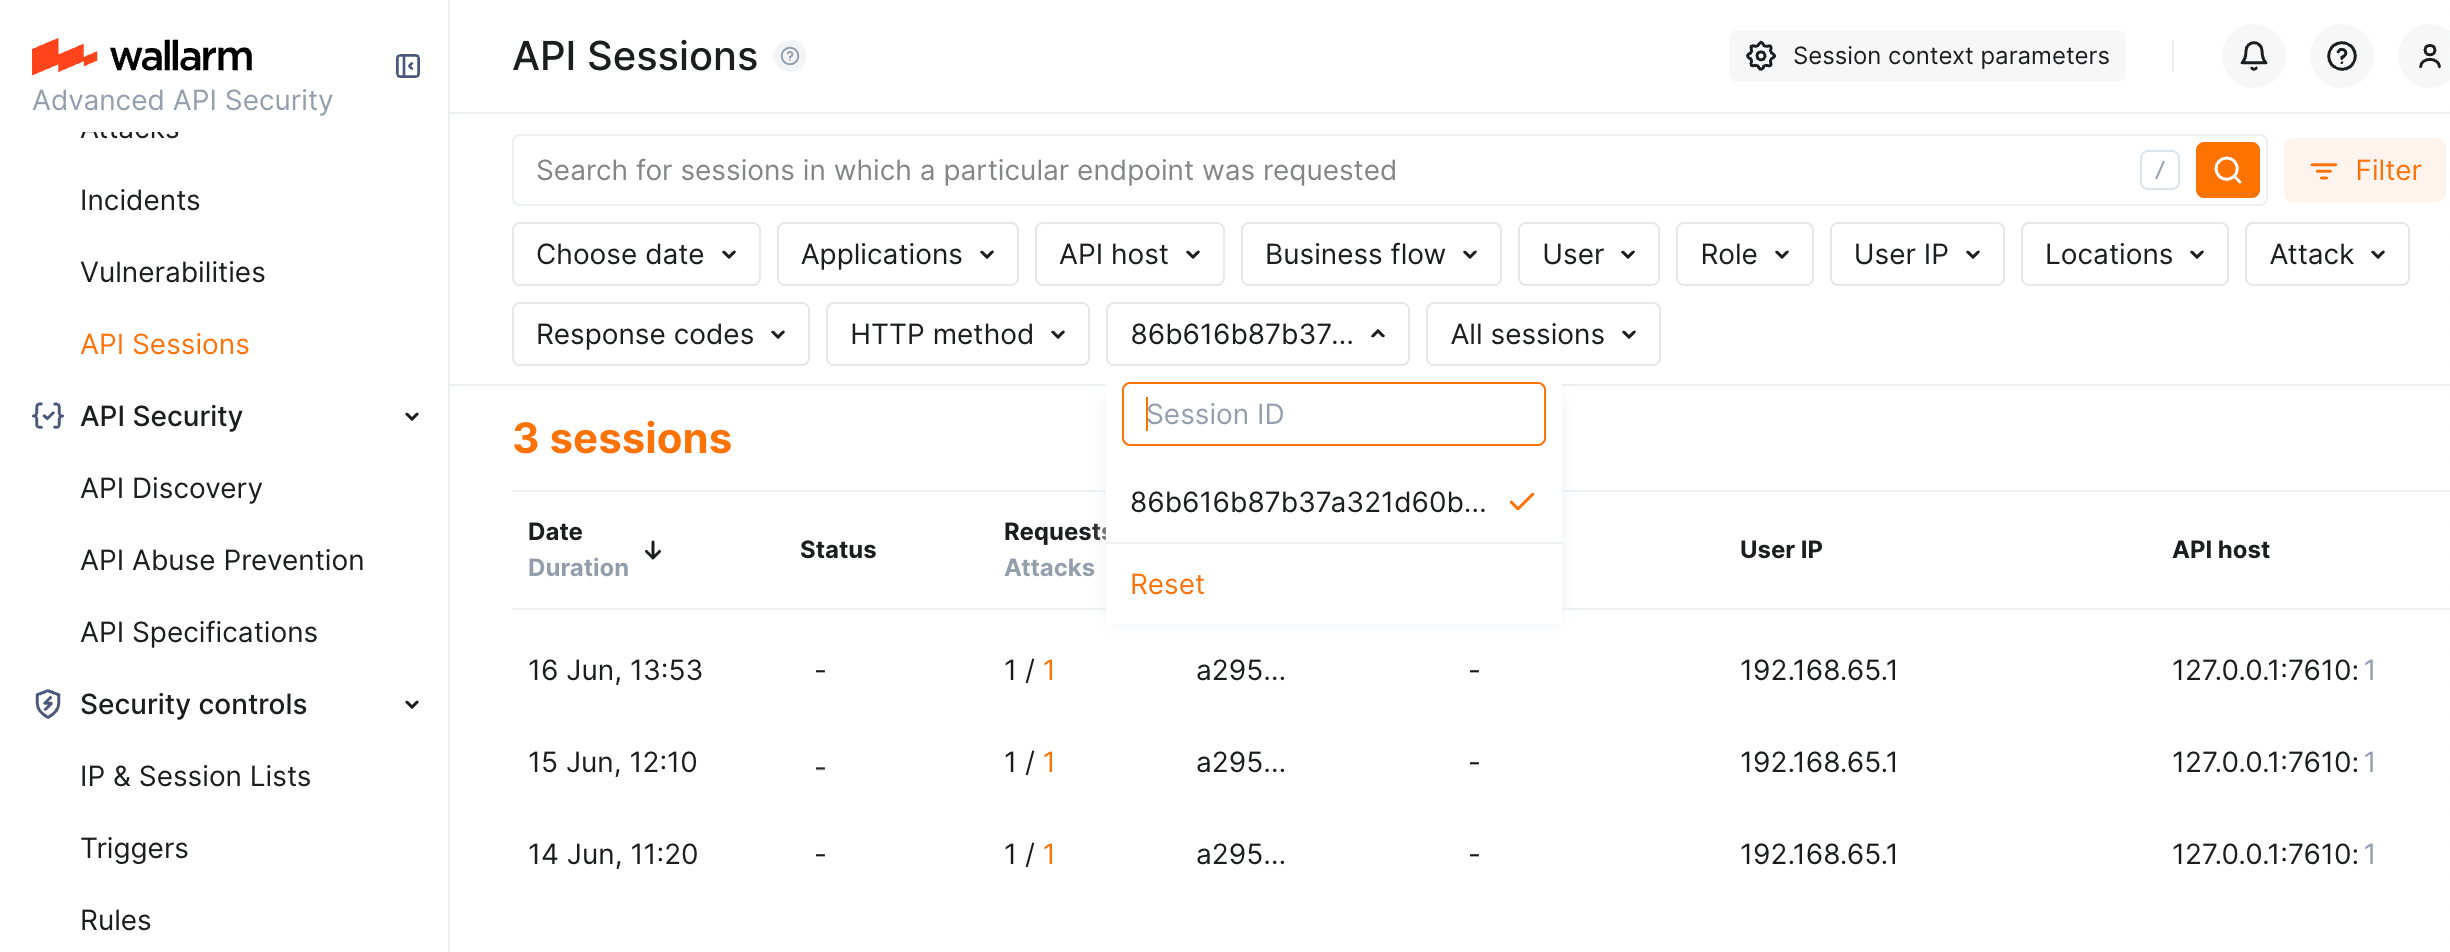
Multi-day sessions
For effective analysis, long sessions are separated into one-day parts. Also, no parts older than 7 days are stored and displayed. To view all session parts (but not older than 7 days):
-
In the session details, right-click and copy session's ID.
-
Paste the ID to the Session ID filter.
Activities within specific time
You can investigate what happened within the specified time interval. To do so, set the date/time filter. Only sessions with the requests that took place at the specified time will be displayed - only requests from that time interval will be displayed within each session.
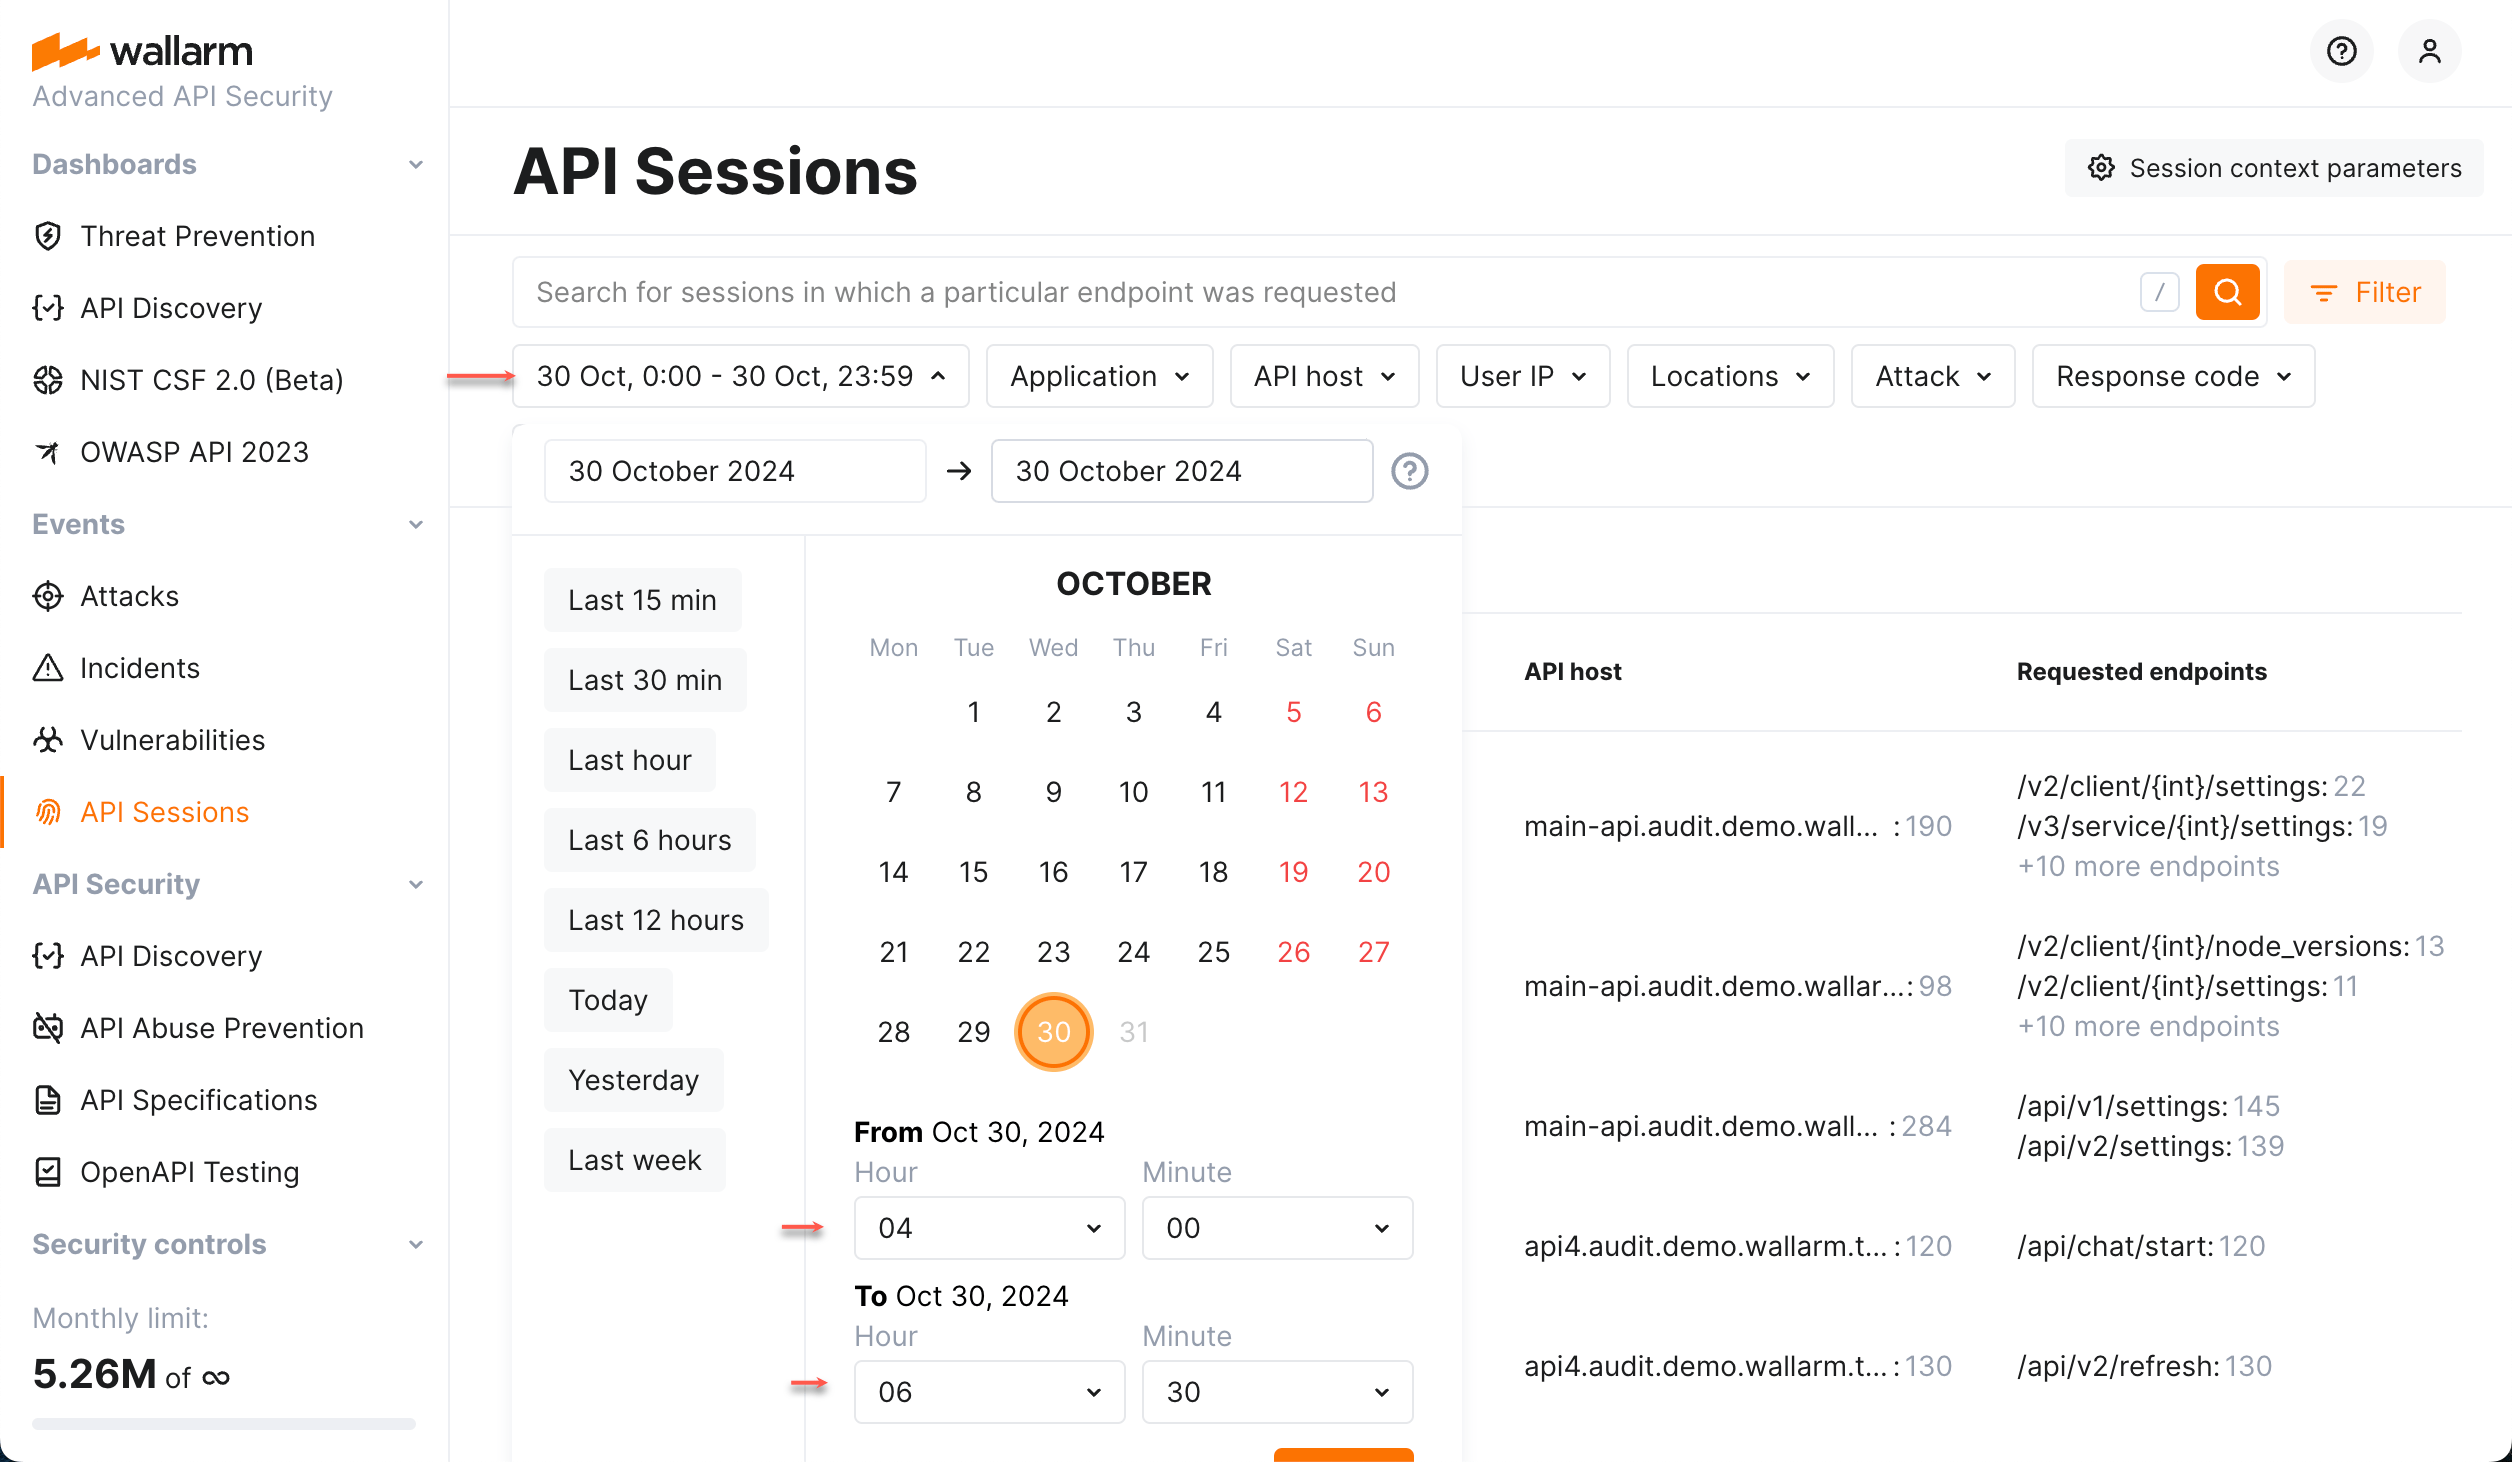
Hint: use the link to your session in your own browser and then set time interval to see only requests from the selected session within the selected time.
Specific activities within session
The session may contain a lot of requests of different types (POST, GET, etc.), with different response codes, from different IPs, legitimate and malicious with the different attack types.
In session details, you can see comprehensive statistics providing information on its request distribution by different criteria. You can apply in-session filters (one or several) to see only specific requests.
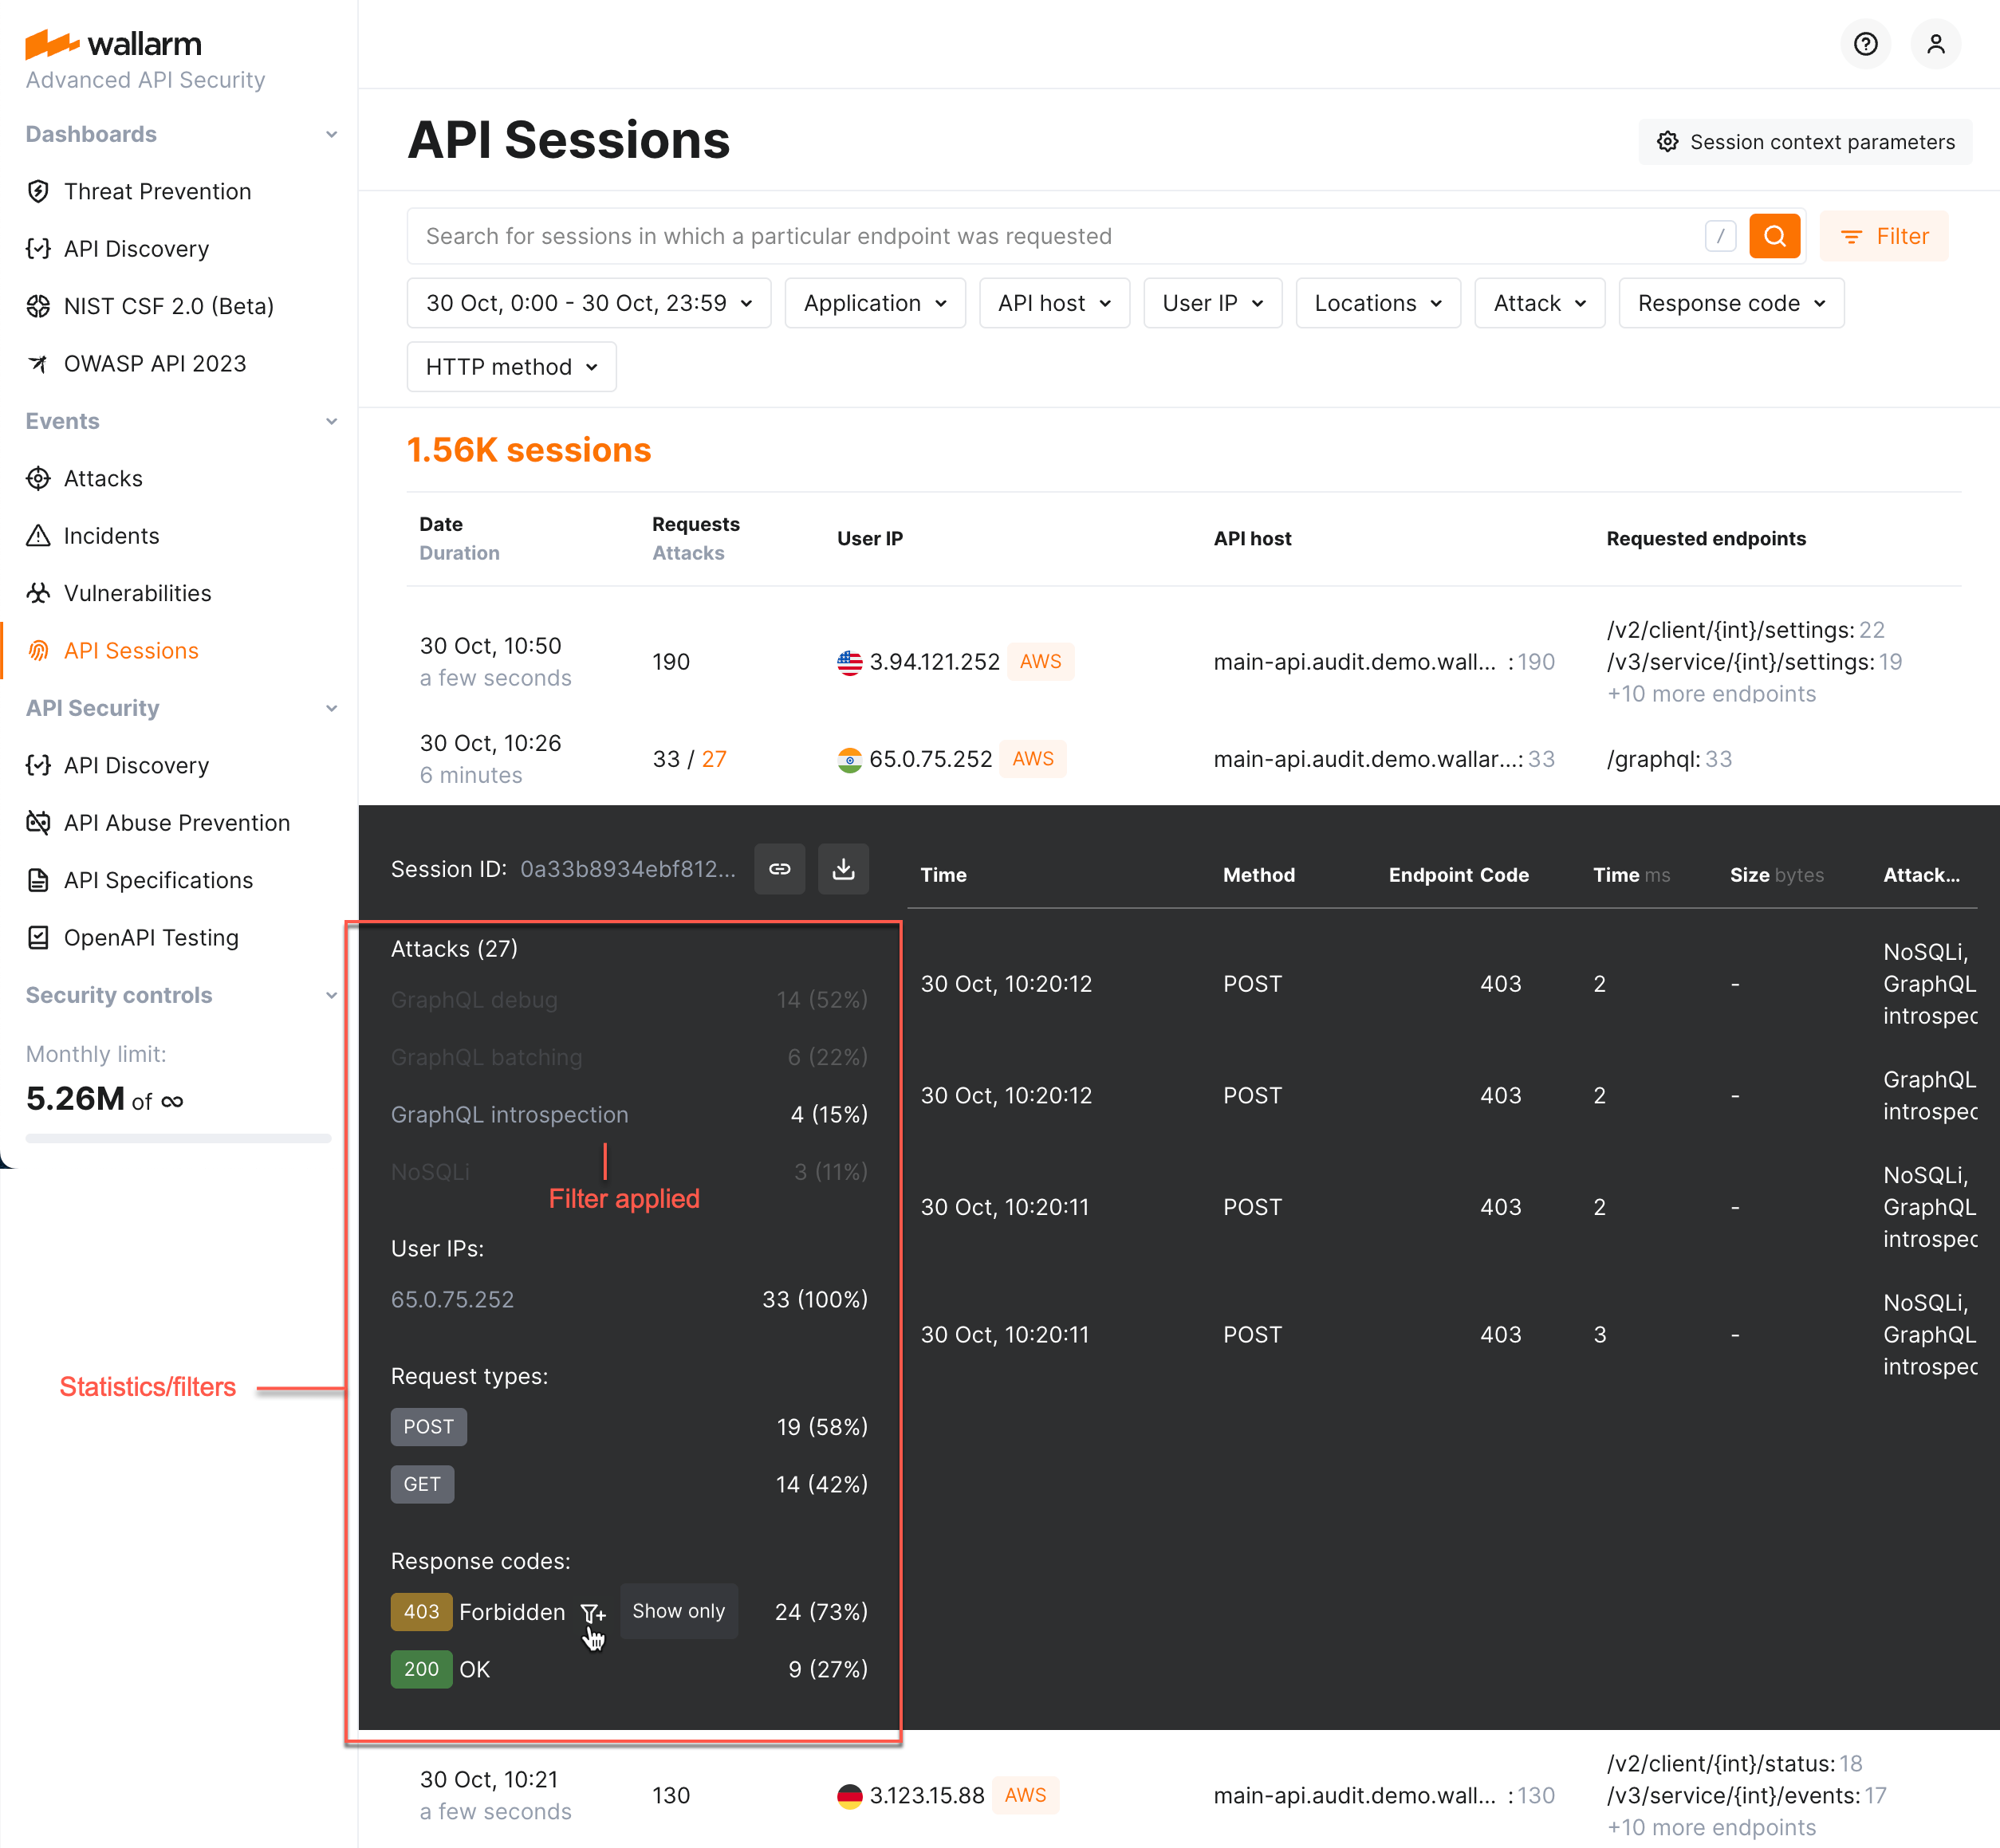
Note that in-session filters communicate with general filters of the API Sessions section:
-
Any session opened after general filters applied will share these filters (inside the session, you can click Show all requests to cancel that).
-
Use the Apply filters button to apply general filters within your current session.
Inspecting affected endpoints
Use the API Discovery insights in the session request details to inspect the affected endpoints. You can immediately get information whether the endpoint is at risk, whether this risk is caused by the endpoint being rogue (specifically, shadow or zombie APIs) and how well and by what measures it is protected.
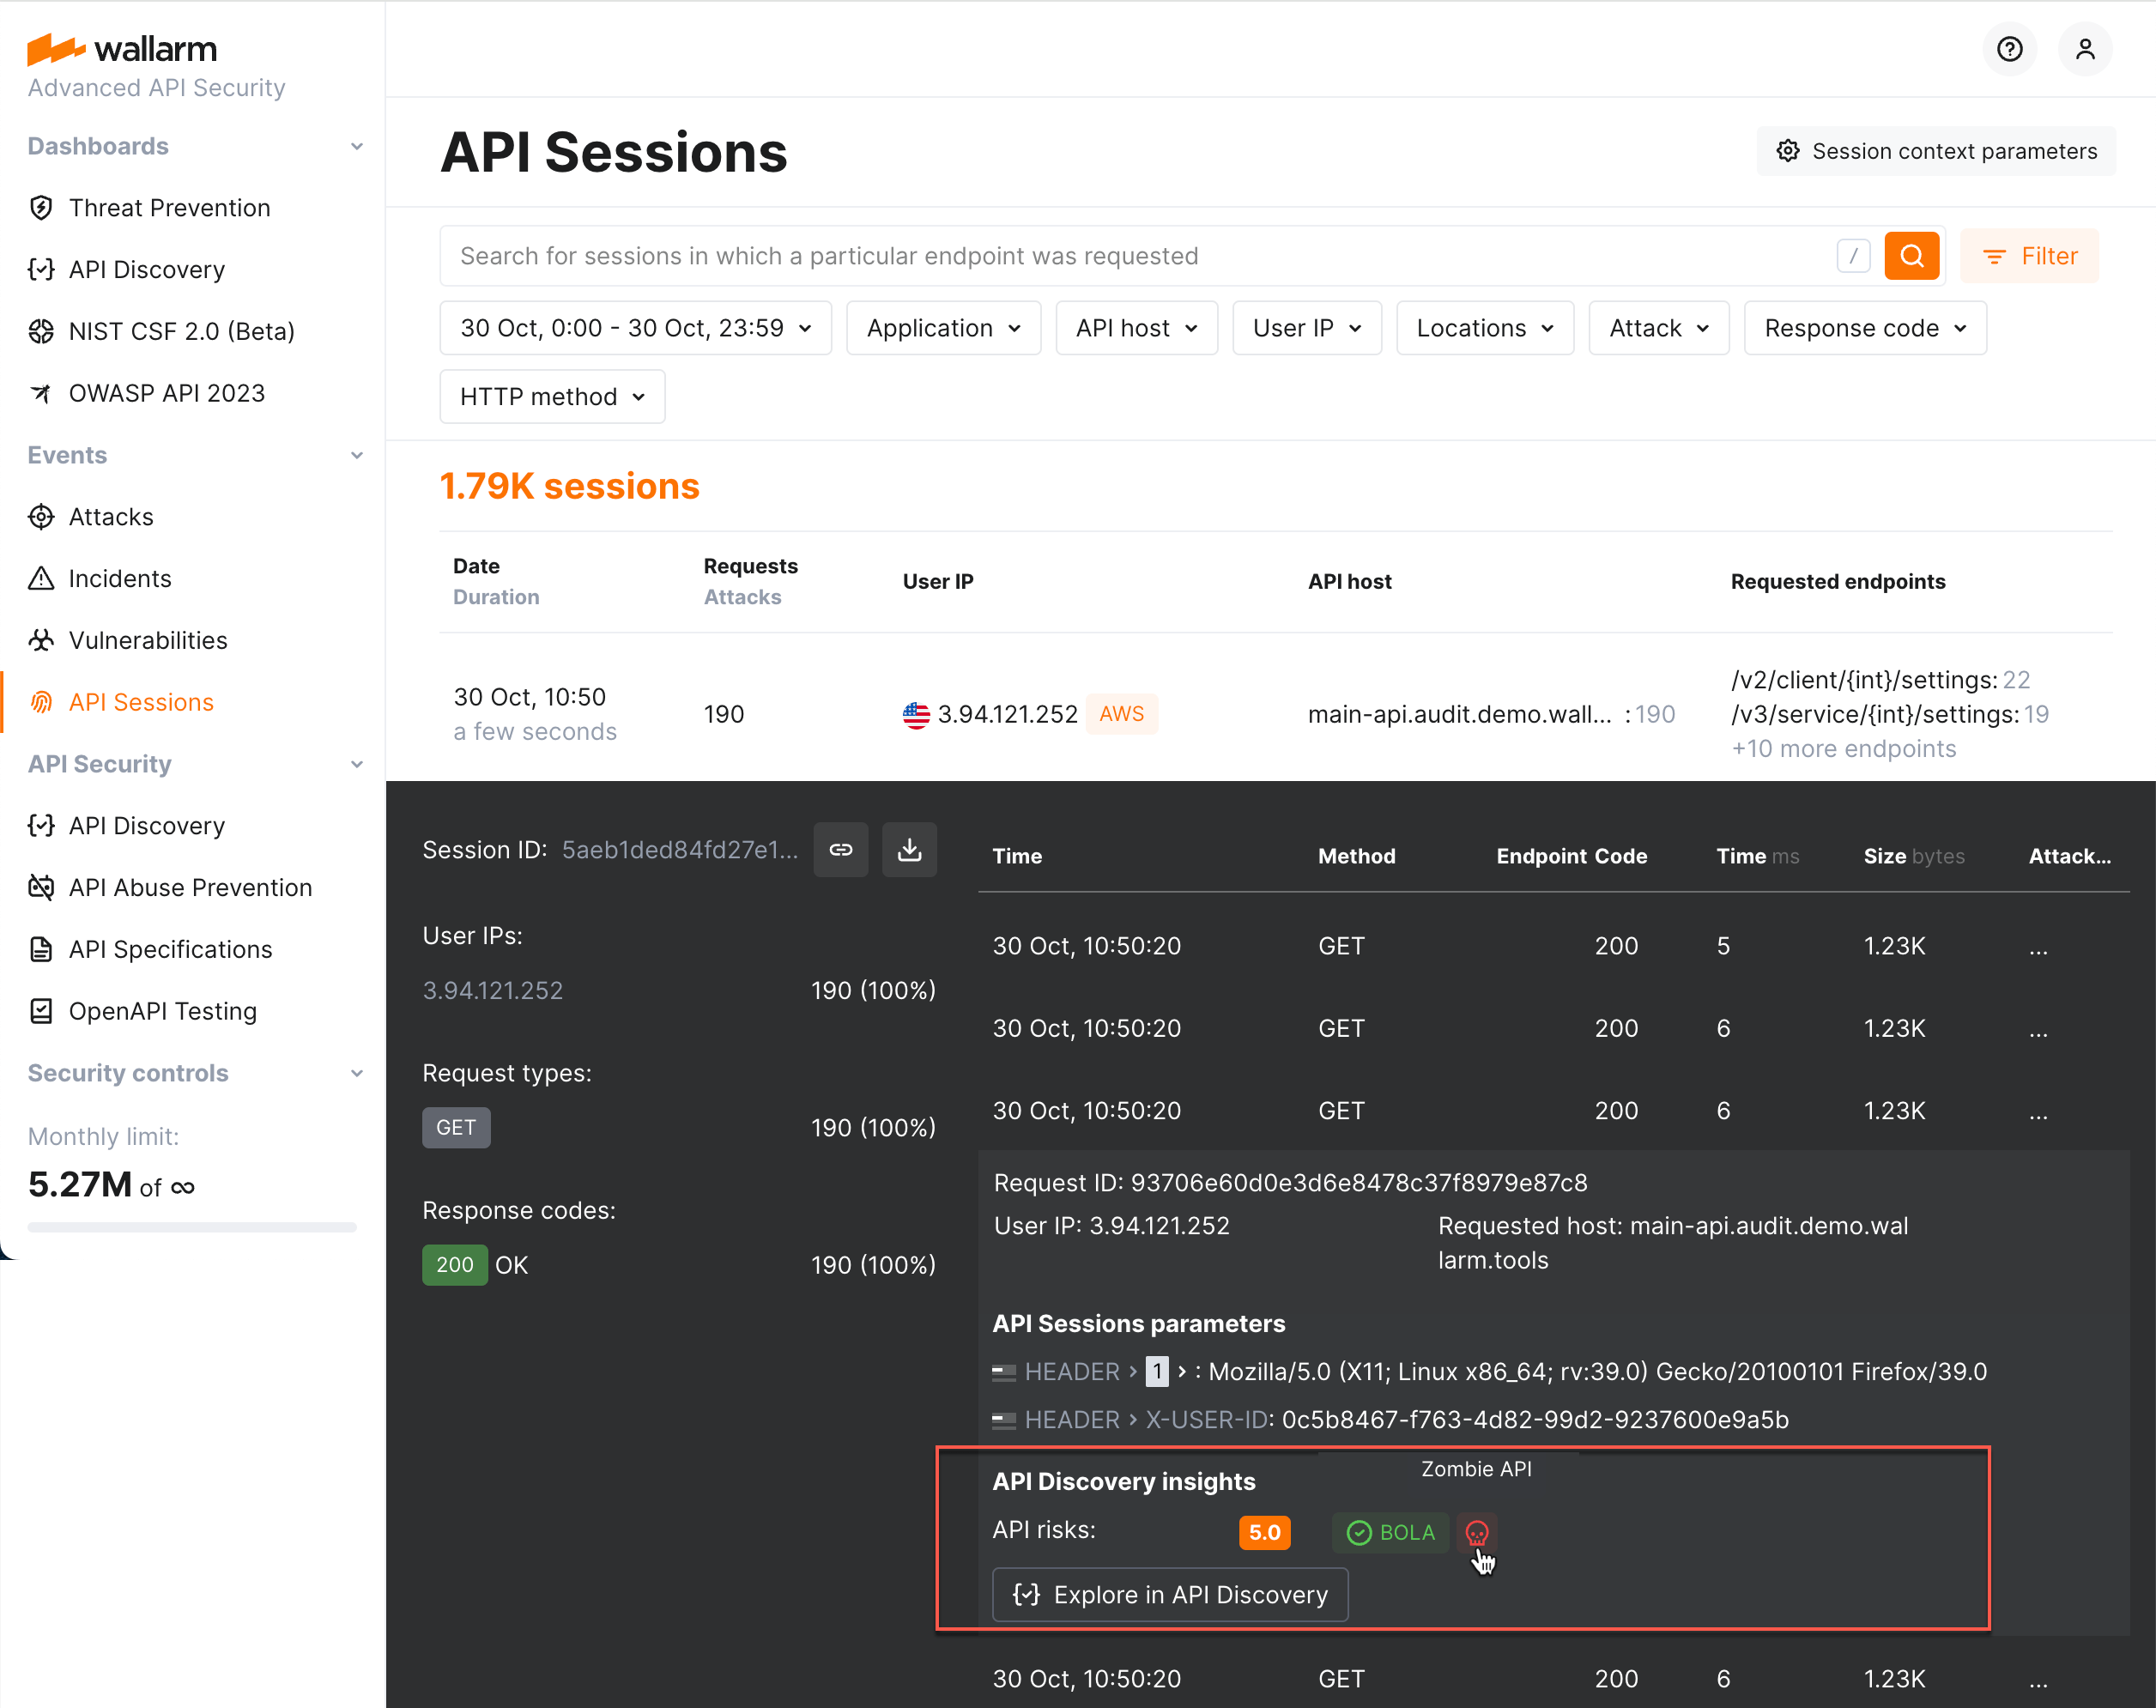
Click Explore in API Discovery to switch to the endpoint information in the API Discovery section.
Identifying performance issues
Use the Time,ms and Size,bytes columns in the session request details to compare presented data with the average expected values. Significantly exceeded values signal possible performance issues and bottlenecks and the possibility to optimize the user experience.
Sensitive business flows
In API Discovery, the sensitive business flow capability (requires NGINX Node 5.2.11 or native Node 0.10.1 or higher) allows automatic and manual identification of endpoints that are critical to specific business flows and functions, such as authentication, account management, billing, and similar critical capabilities.
If the sessions' requests affect the endpoints that in API Discovery were tagged as important for some sensitive business flows, such sessions are automatically tagged as affecting this business flow as well.
Once sessions are assigned the sensitive business flow tags, it becomes possible to filter them by a specific business flow, which makes it easier to select the sessions that are most important to analyze.
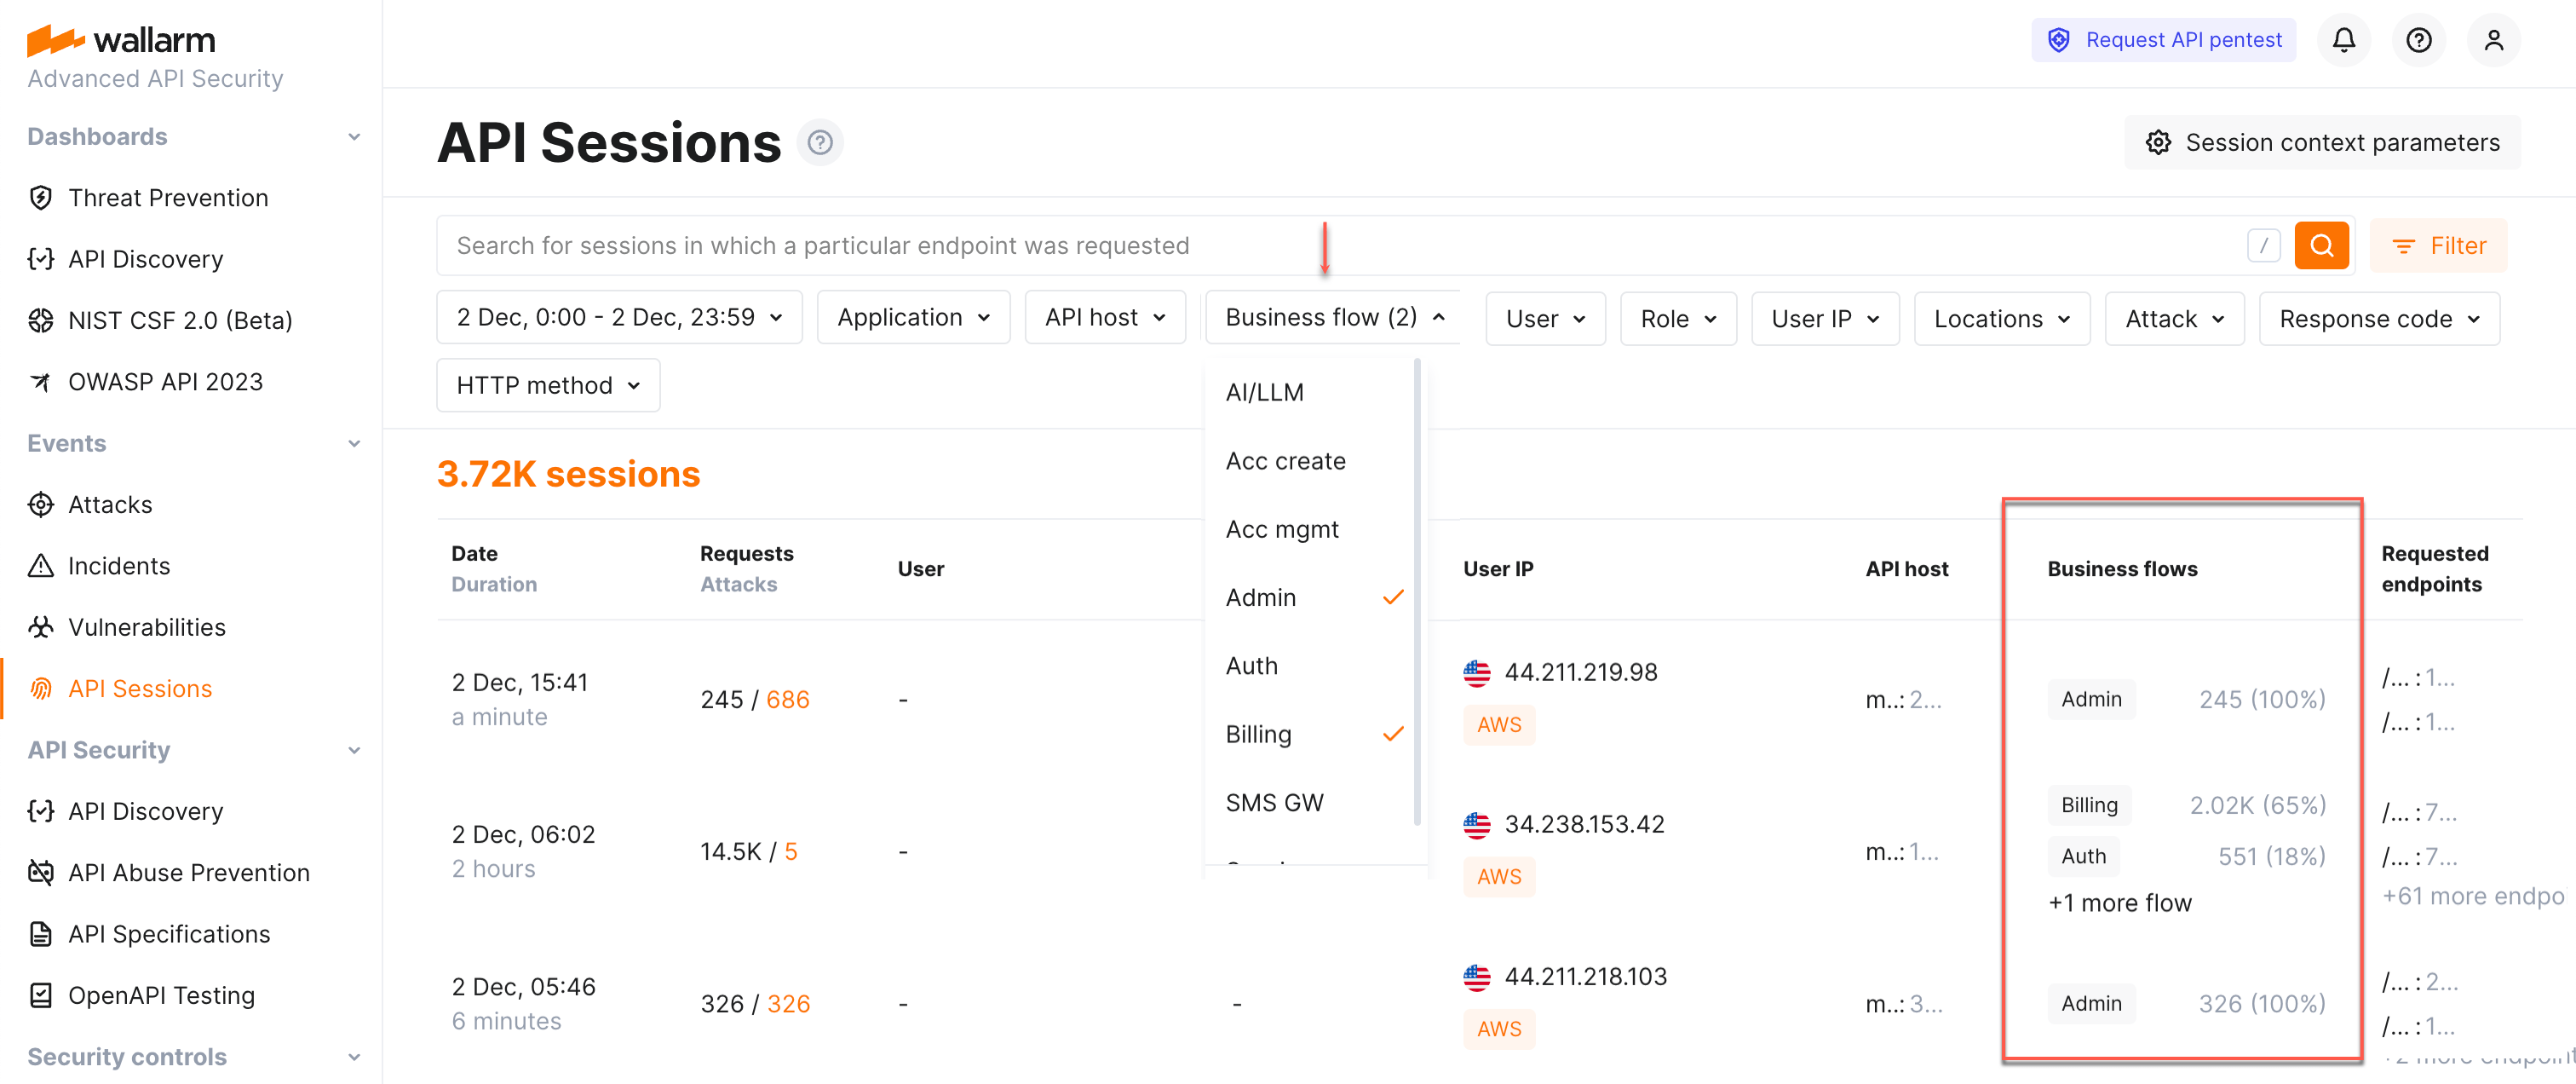
Wallarm lists business flows and displays the number and percentage of requests related to the flow from the total number of session requests.
Sessions can be associated with one of the following sensitive business flows:
-
AI/LLM (artificial intelligence/large language models) flows - requests/endpoints/parameters related to the systems that use ML models, neural networks, chatbots or systems that in turn access some paid third-party AI services, such as OpenAI.
-
Acc create (account creation) and Acc mgmt (account management) flows - the key administrative flows relating to your applications.
-
Admin (administrative) flows - requests/endpoints/parameters related to applications' administrative functions and activities. Such requests/endpoints/parameters are usually targeted by attackers in order to access functionality intended for privileged users only (BFLA), escalate privileges and gain control over the system.
-
Auth (authentication) flows - requests/endpoints/parameters critical to access control, as they verify user identity and manage permissions. As the entry point to the app, they are often the first target for attackers seeking to bypass security, gain unauthorized access, and take over accounts.
-
Billing flows - sensitive due to usage and possible breach of critical personal financial data and susceptible to fraud.
-
SMS GW (SMS gateway) flows - requests/endpoints/parameters sensitive because attackers can exploit them in SMS pumping attacks, flooding them with messages to inflate costs. Since these requests/endpoints/parameters are connected to API gateways and payment systems, this can lead to financial loss and system overload.
Use the Business flow filter to quickly analyze all the sessions affecting specific flows.
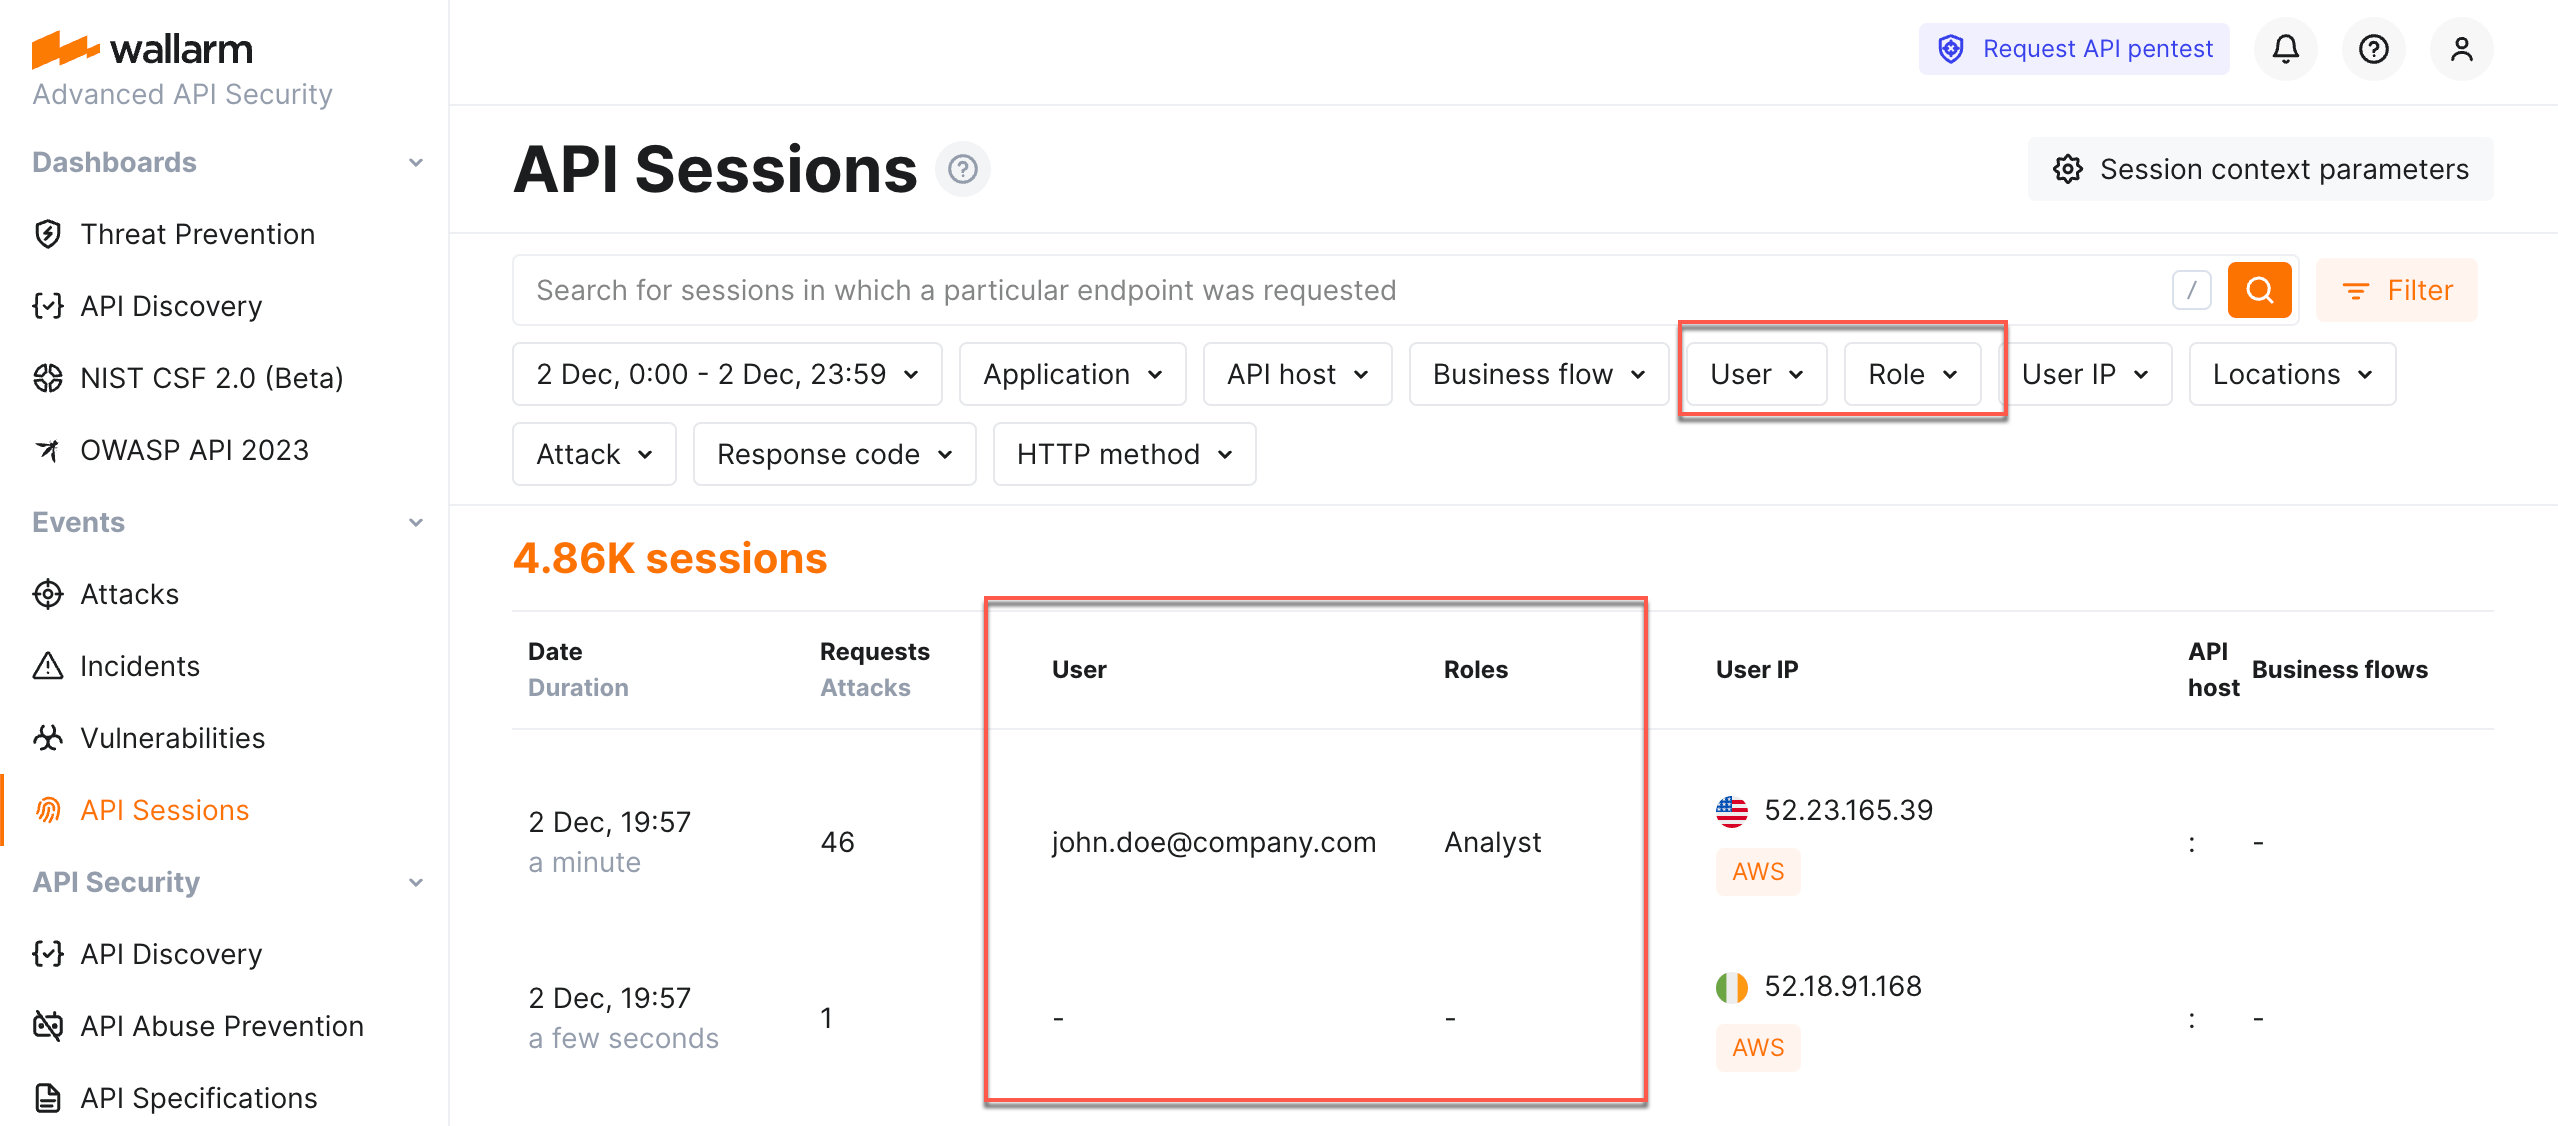
Sessions by users and roles
If you configured API Sessions to obtain information on users and their roles, you can filter sessions by users and roles.
Verifying API abuse detection accuracy
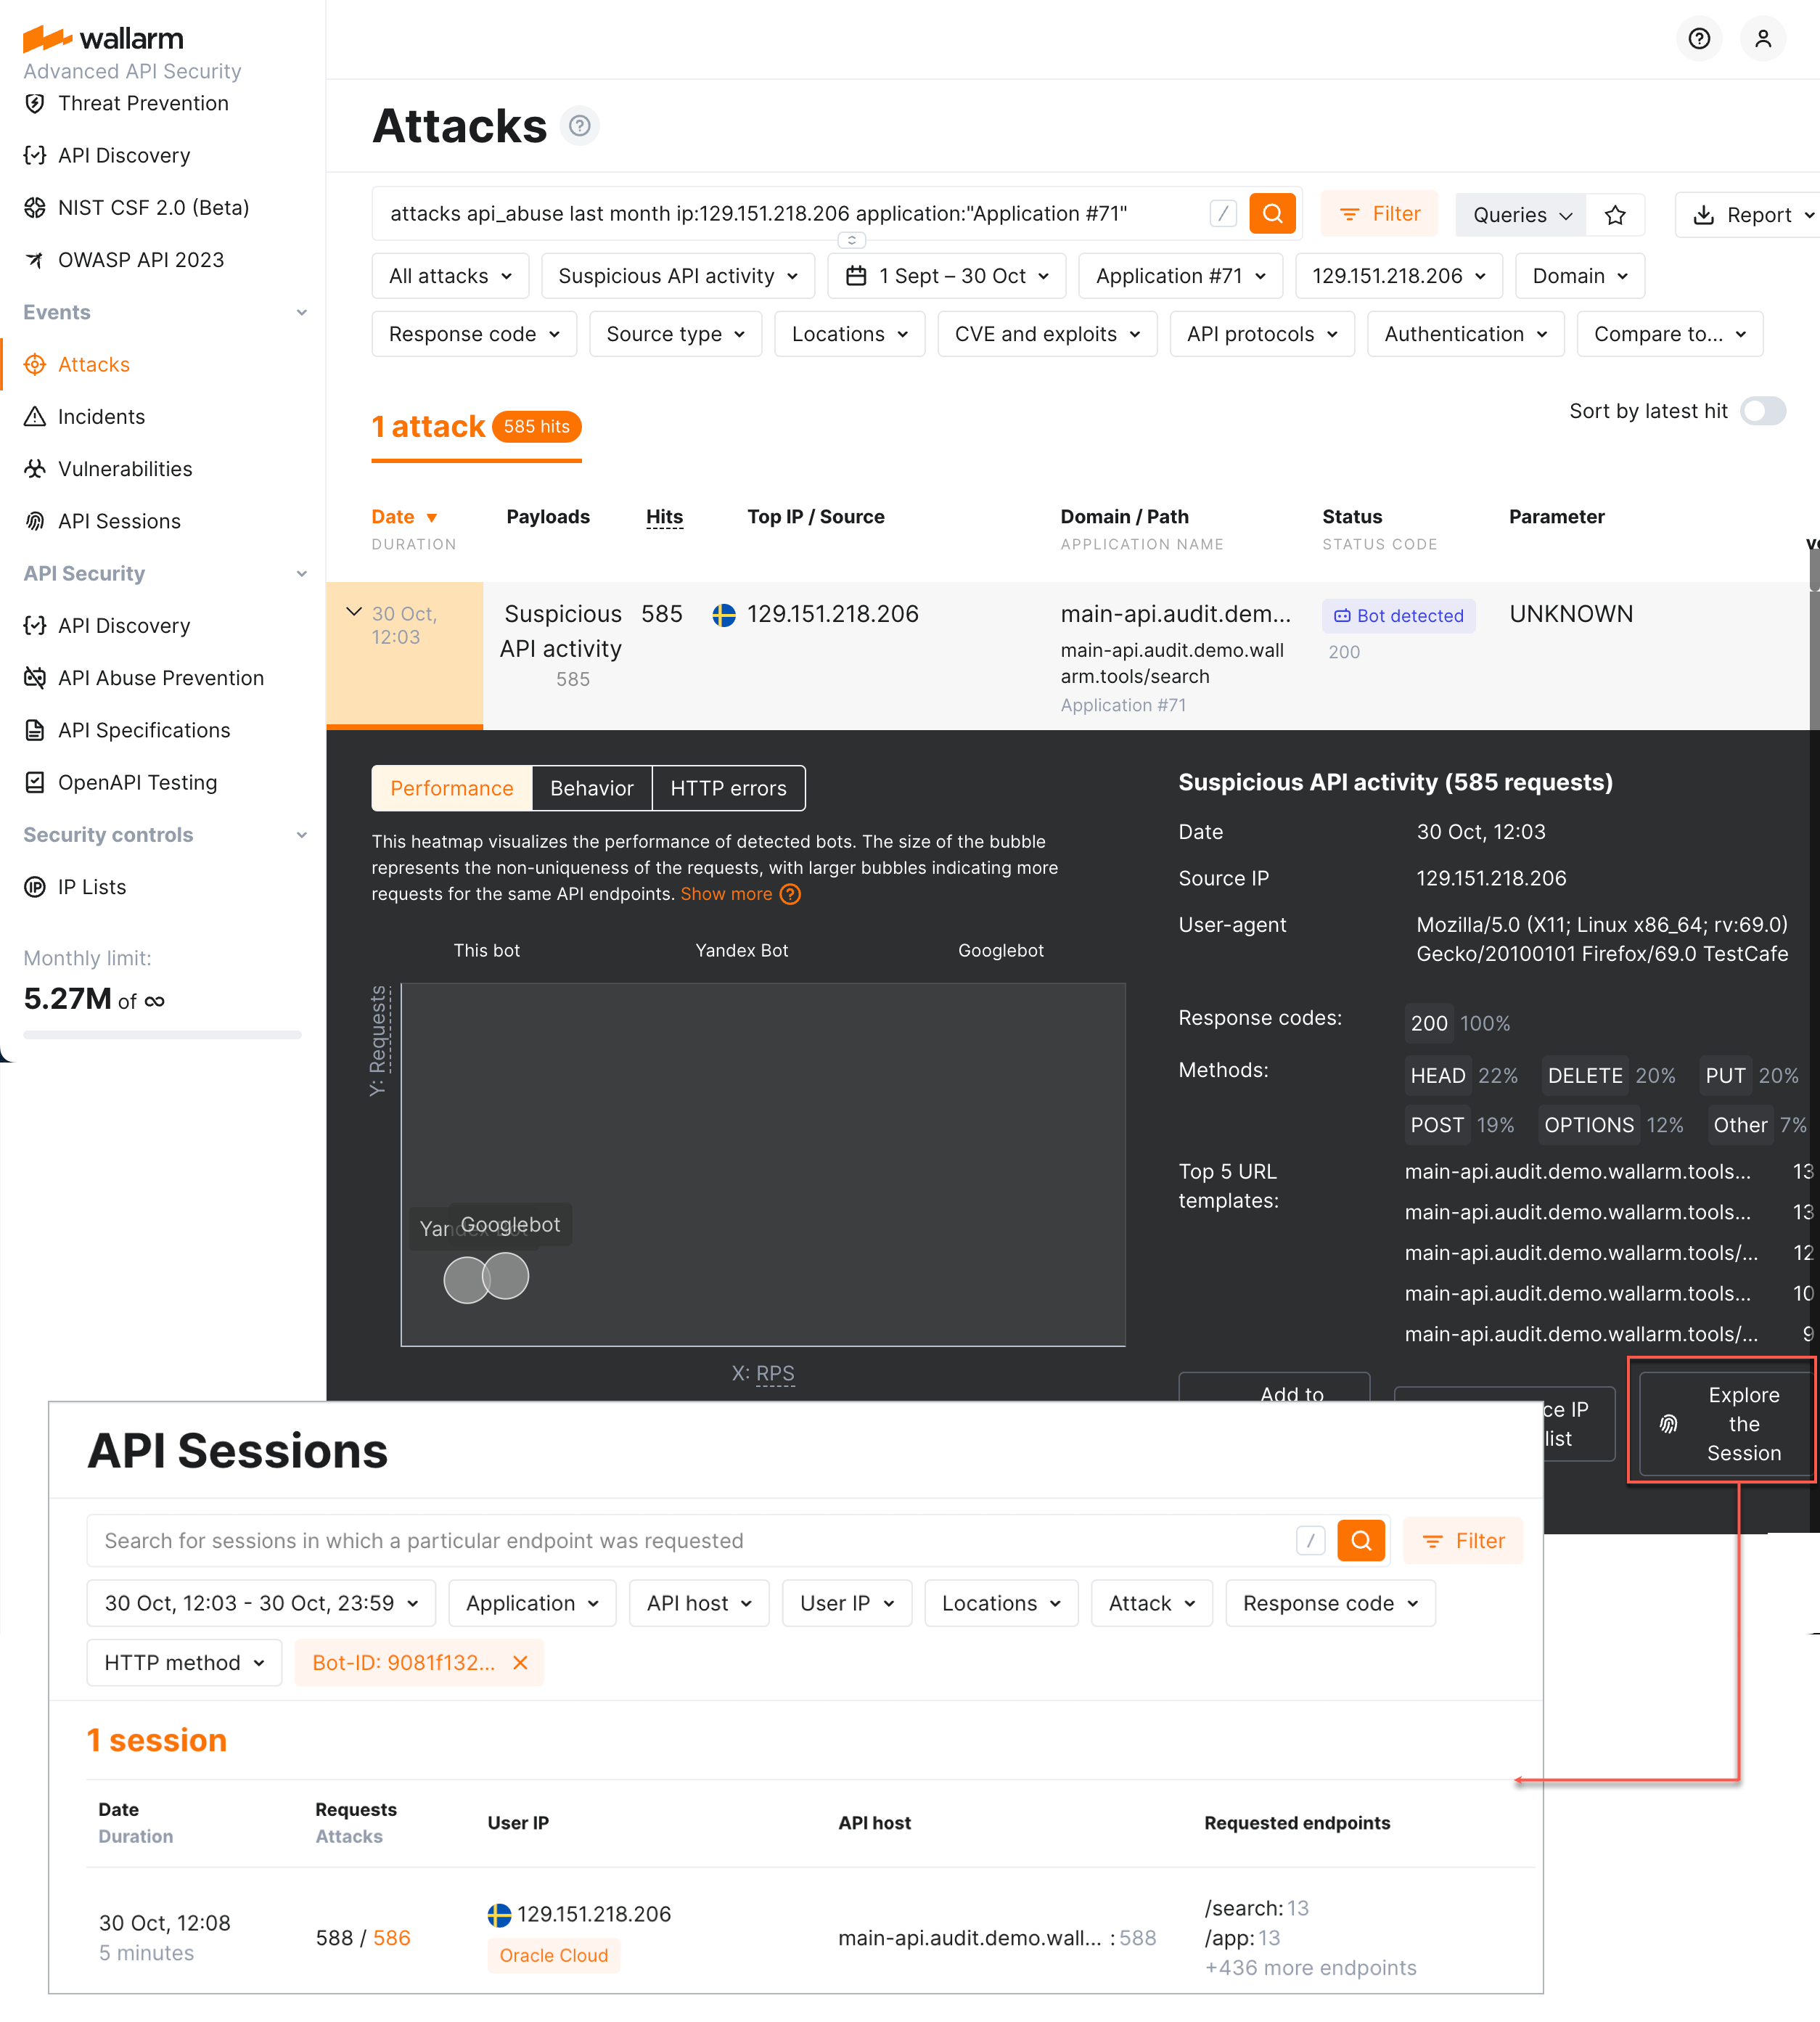
Once the malicious bot activity is detected by Wallarm's API Abuse Prevention and displayed in the Attacks section, you can see the full context of this attack's requests: to which user session they belong and what the full sequence of requests in this session is. This allows you to investigate all activity of the actor to verify whether the decision to mark this actor as a malicious bot was correct.
To perform this analysis, in Wallarm Console → Attacks, access the bot attack details, then click Explore in API Sessions. Wallarm will open the API Session section filtered: the session(s) related to these bot activities will be displayed.
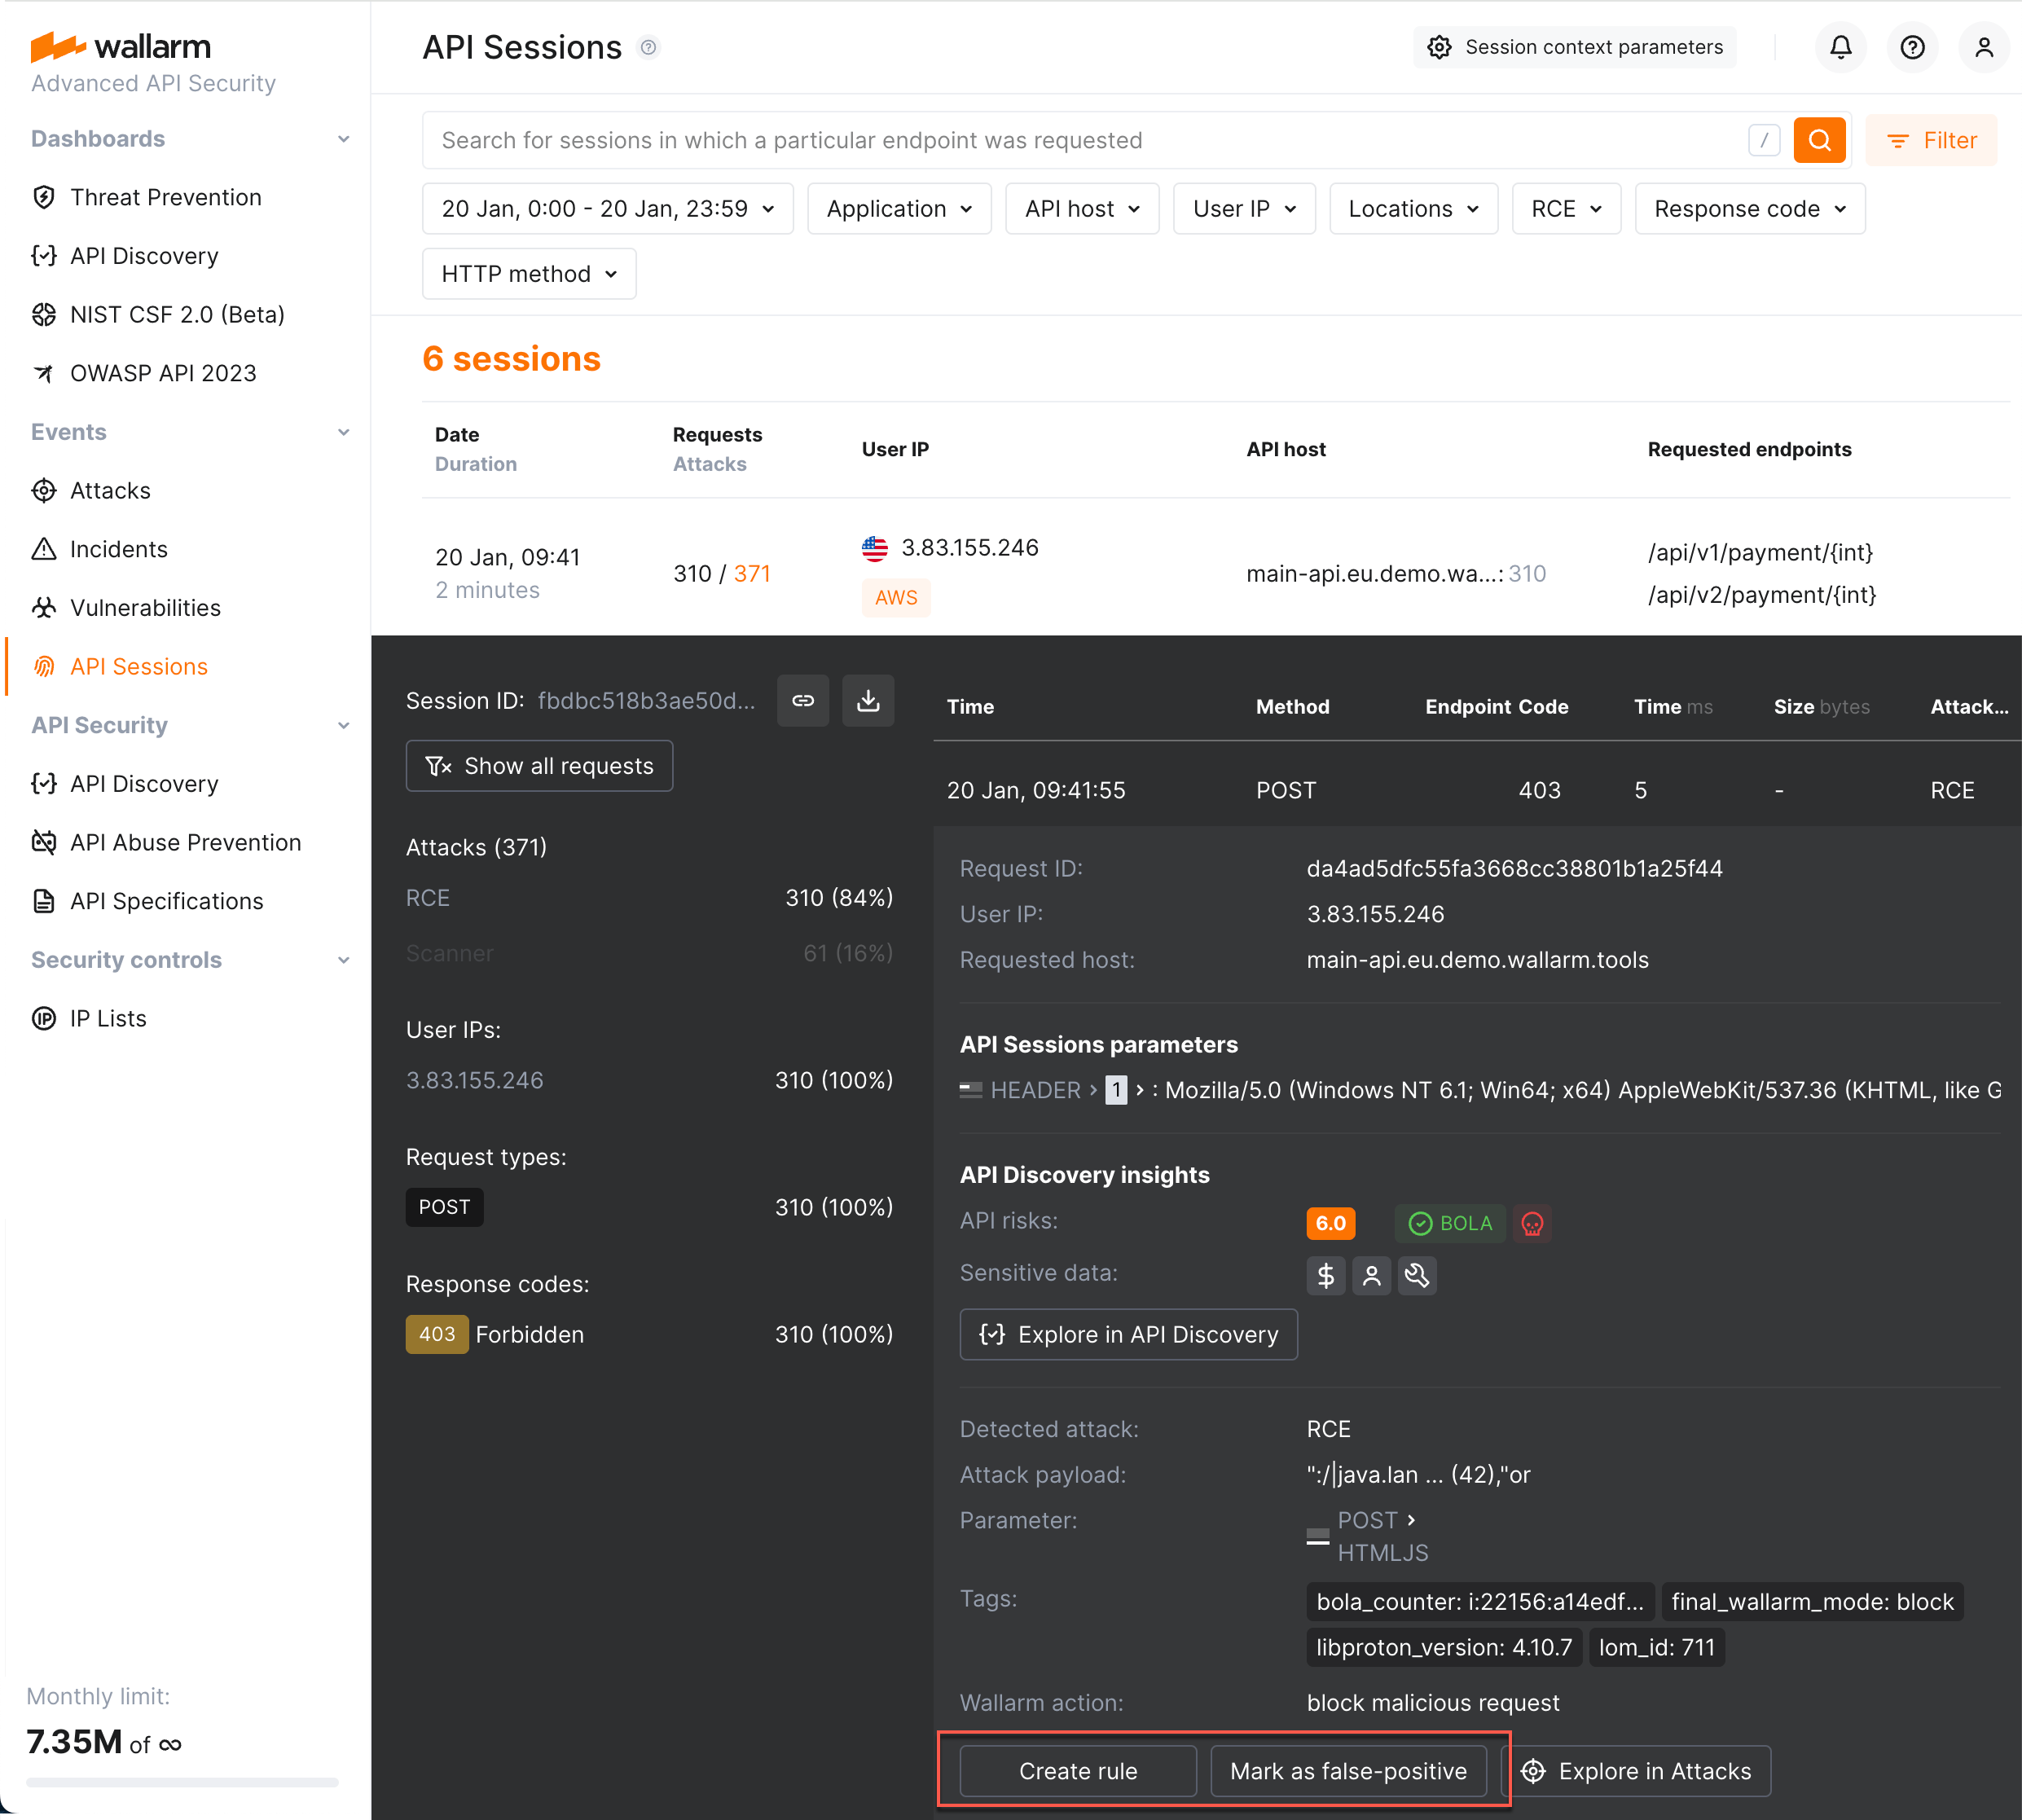
Adjusting attack detection
You can adjust how Wallarm behaves regarding attack detection directly from the malicious request of the session:
-
The attack may be marked as false-positive - the filtering node will not recognize such requests as attacks in future.
-
The rule may be created - once active, the rule will alter the default Wallarm behavior during the analysis of requests and their further processing.
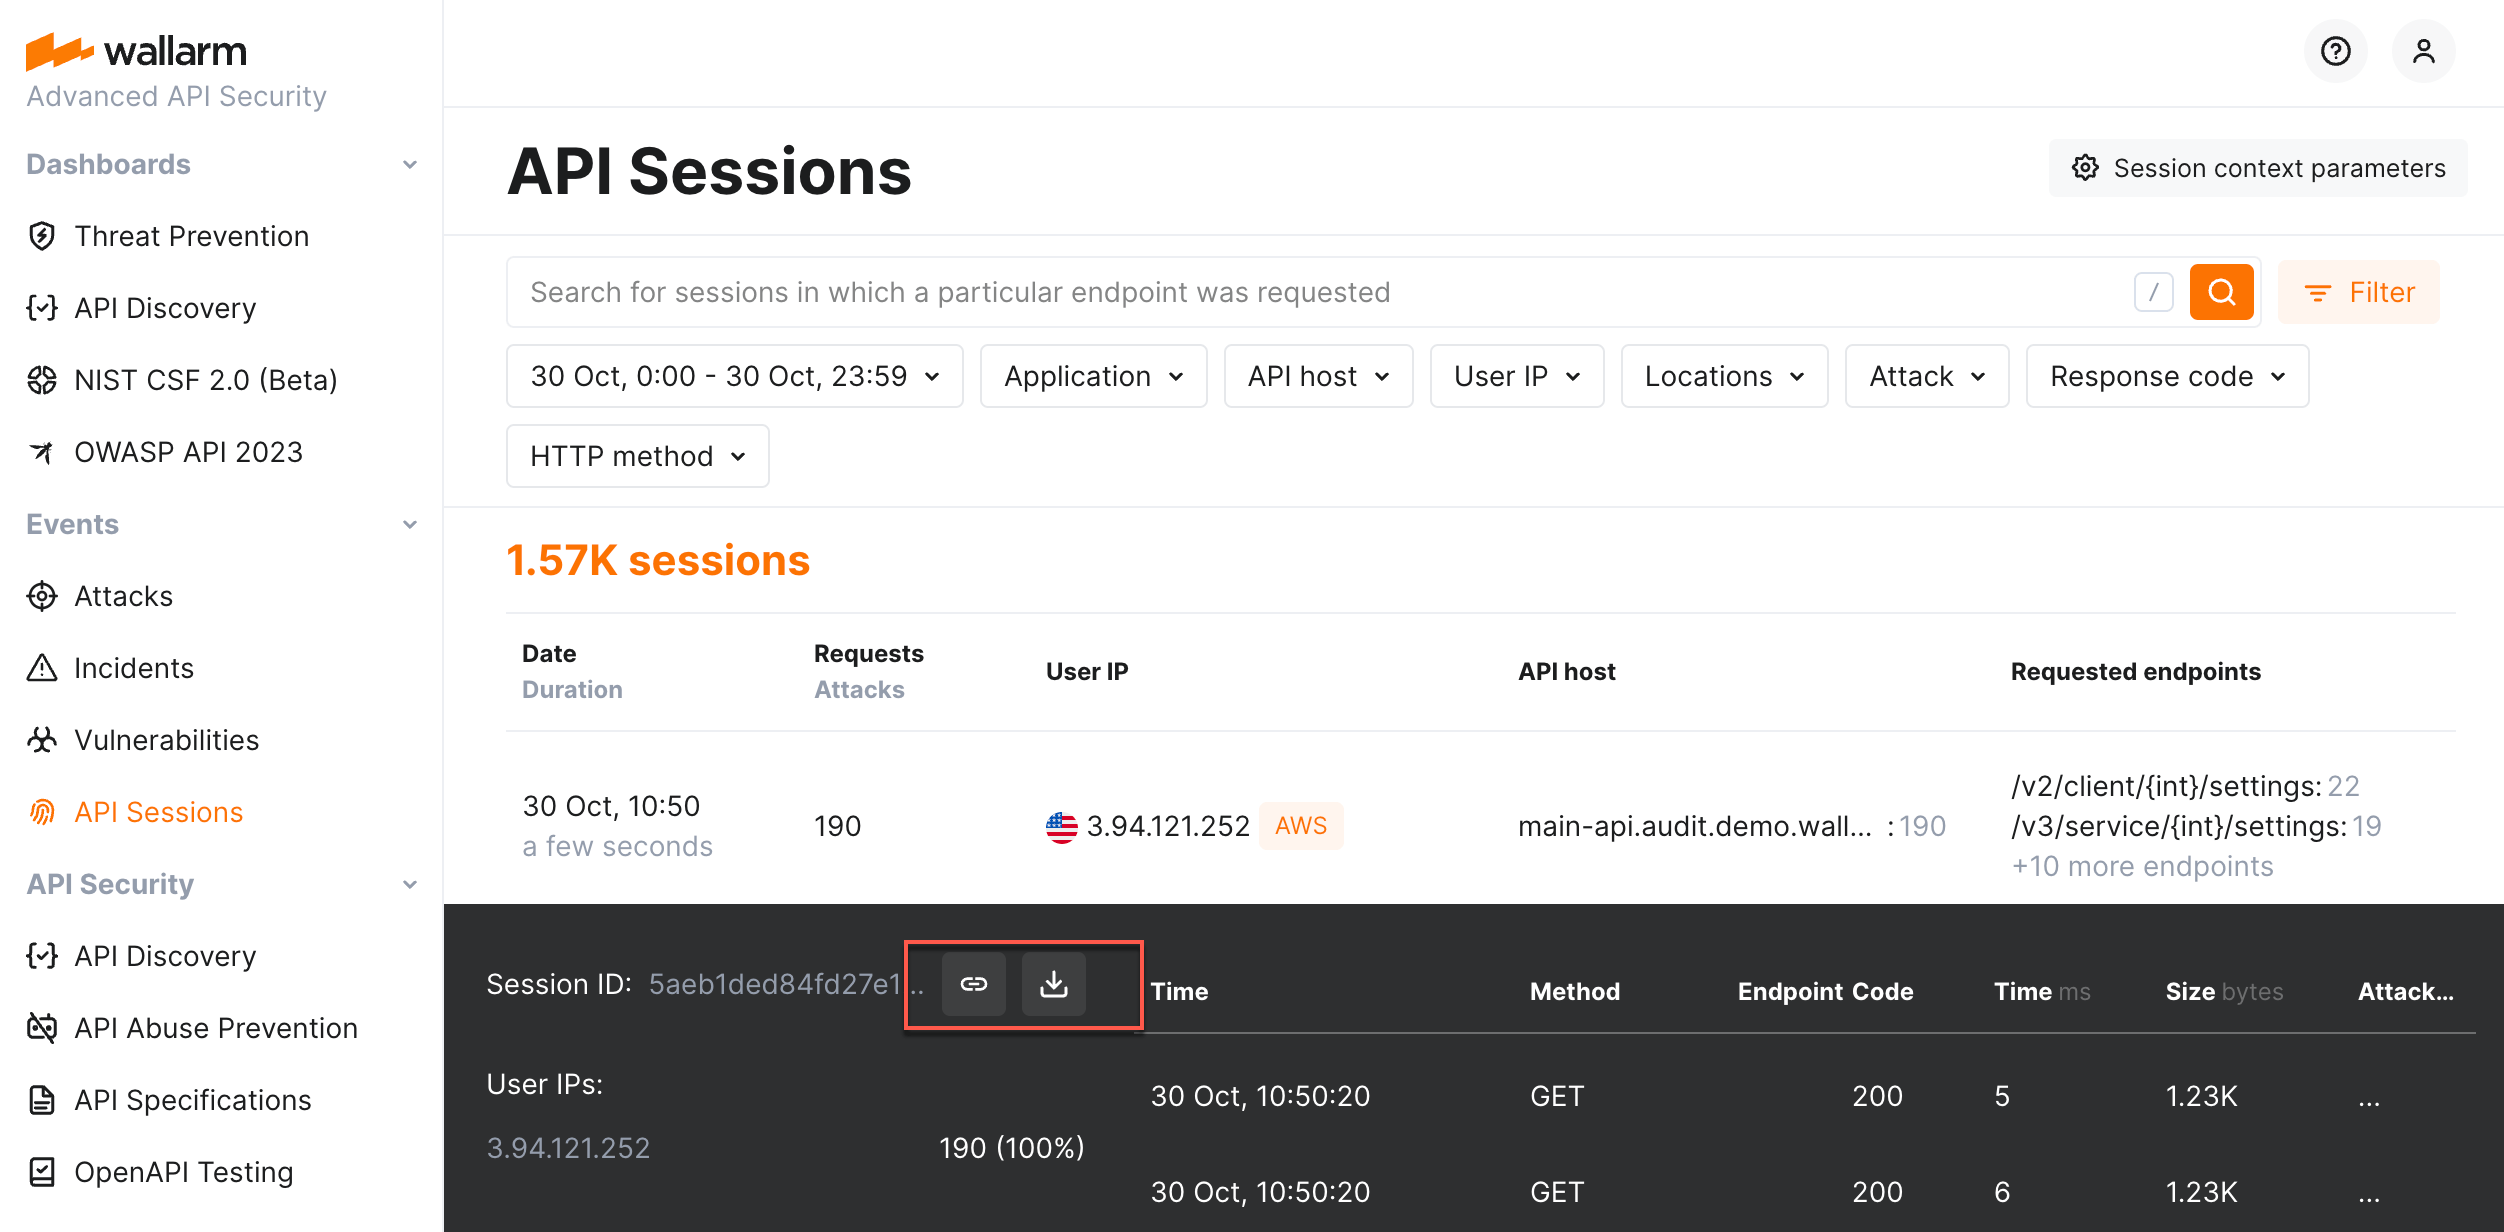
Sharing session information
If you found suspicious behavior in the session and would like to share insights with colleagues and store the session for further analysis, use the Copy link or Download CSV in the session details.