Threat Management Overview
Wallarm's Threat Management provides a full, real-time picture of your security posture and allows controlling the protection tools in use. This article gives an overview of Threat Management components, their purpose and main capabilities.
Overview
Threat Management provides a full picture of what is happening:
-
Do you want a visualized, interactive summary for attacks, endpoints, protection tools in action? Use dashboards.
-
Do you want to see occurring attacks, taken measures, and tools that provided these measures? Work with attacks, easily adjust the tools.
-
Work in the same way with incidents.
-
Is individual attack not giving you full understanding of what is happening? Switch to the session your attack is part of and see all user's previous and subsequent activities.
-
Is session around some endpoints? Switch to full endpoint information that Wallarm automatically discovered (requires API Discovery). Quickly create rules for your endpoint here.
-
Do you want informative documents on attacks, incidents or vulnerabilities? Generate PDF or CSV reports with the filtered data of your choice.
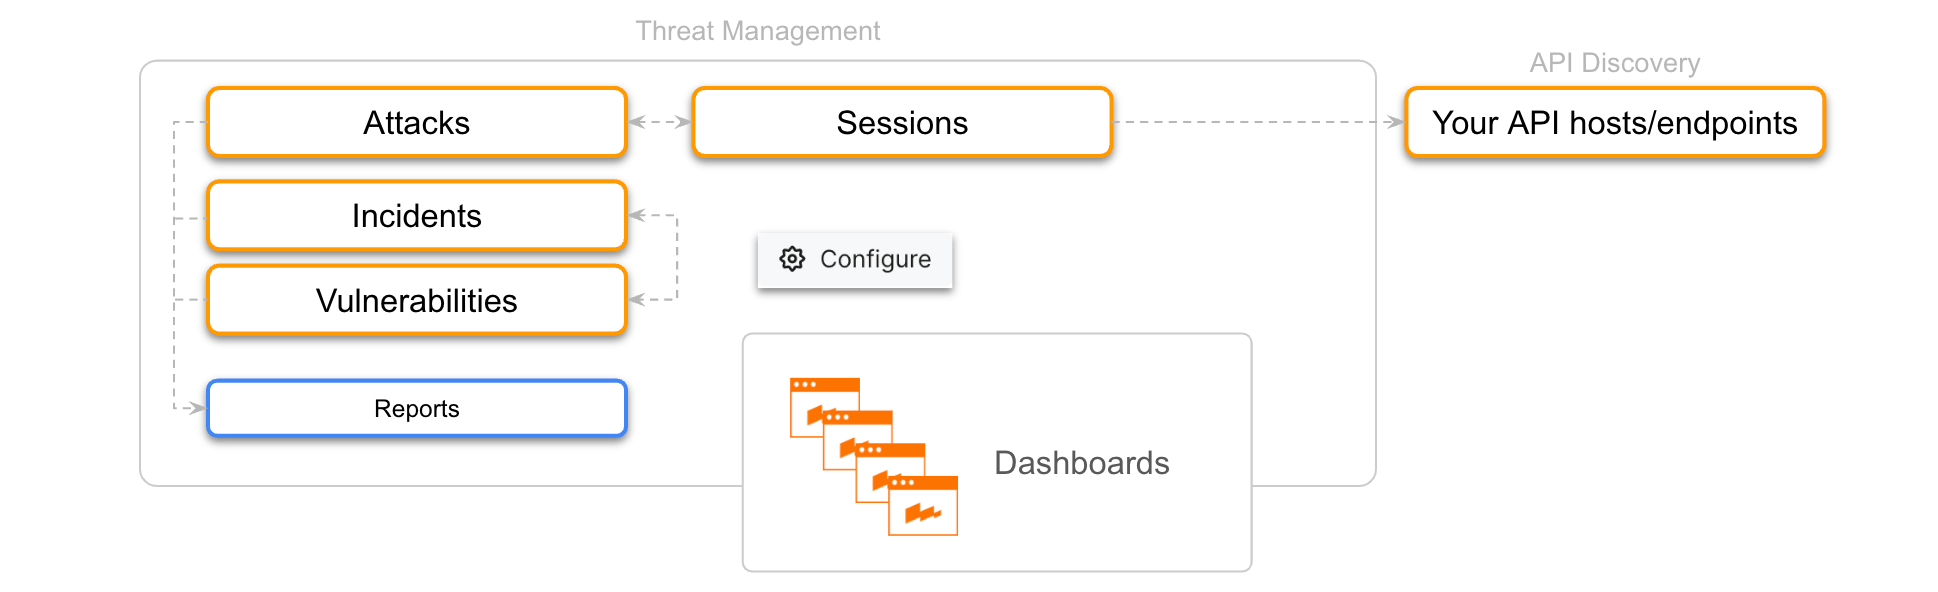
All Threat Management components include advanced search and filtering capabilities. You can also make PDF and CSV reports for attacks and incidents with the filtered content of your choice. Wallarm uses sophisticated grouping mechanisms to logically combine requests into attacks and sessions and provides you with the ability to modify how Sessions are detected to make a full match to your application logic.
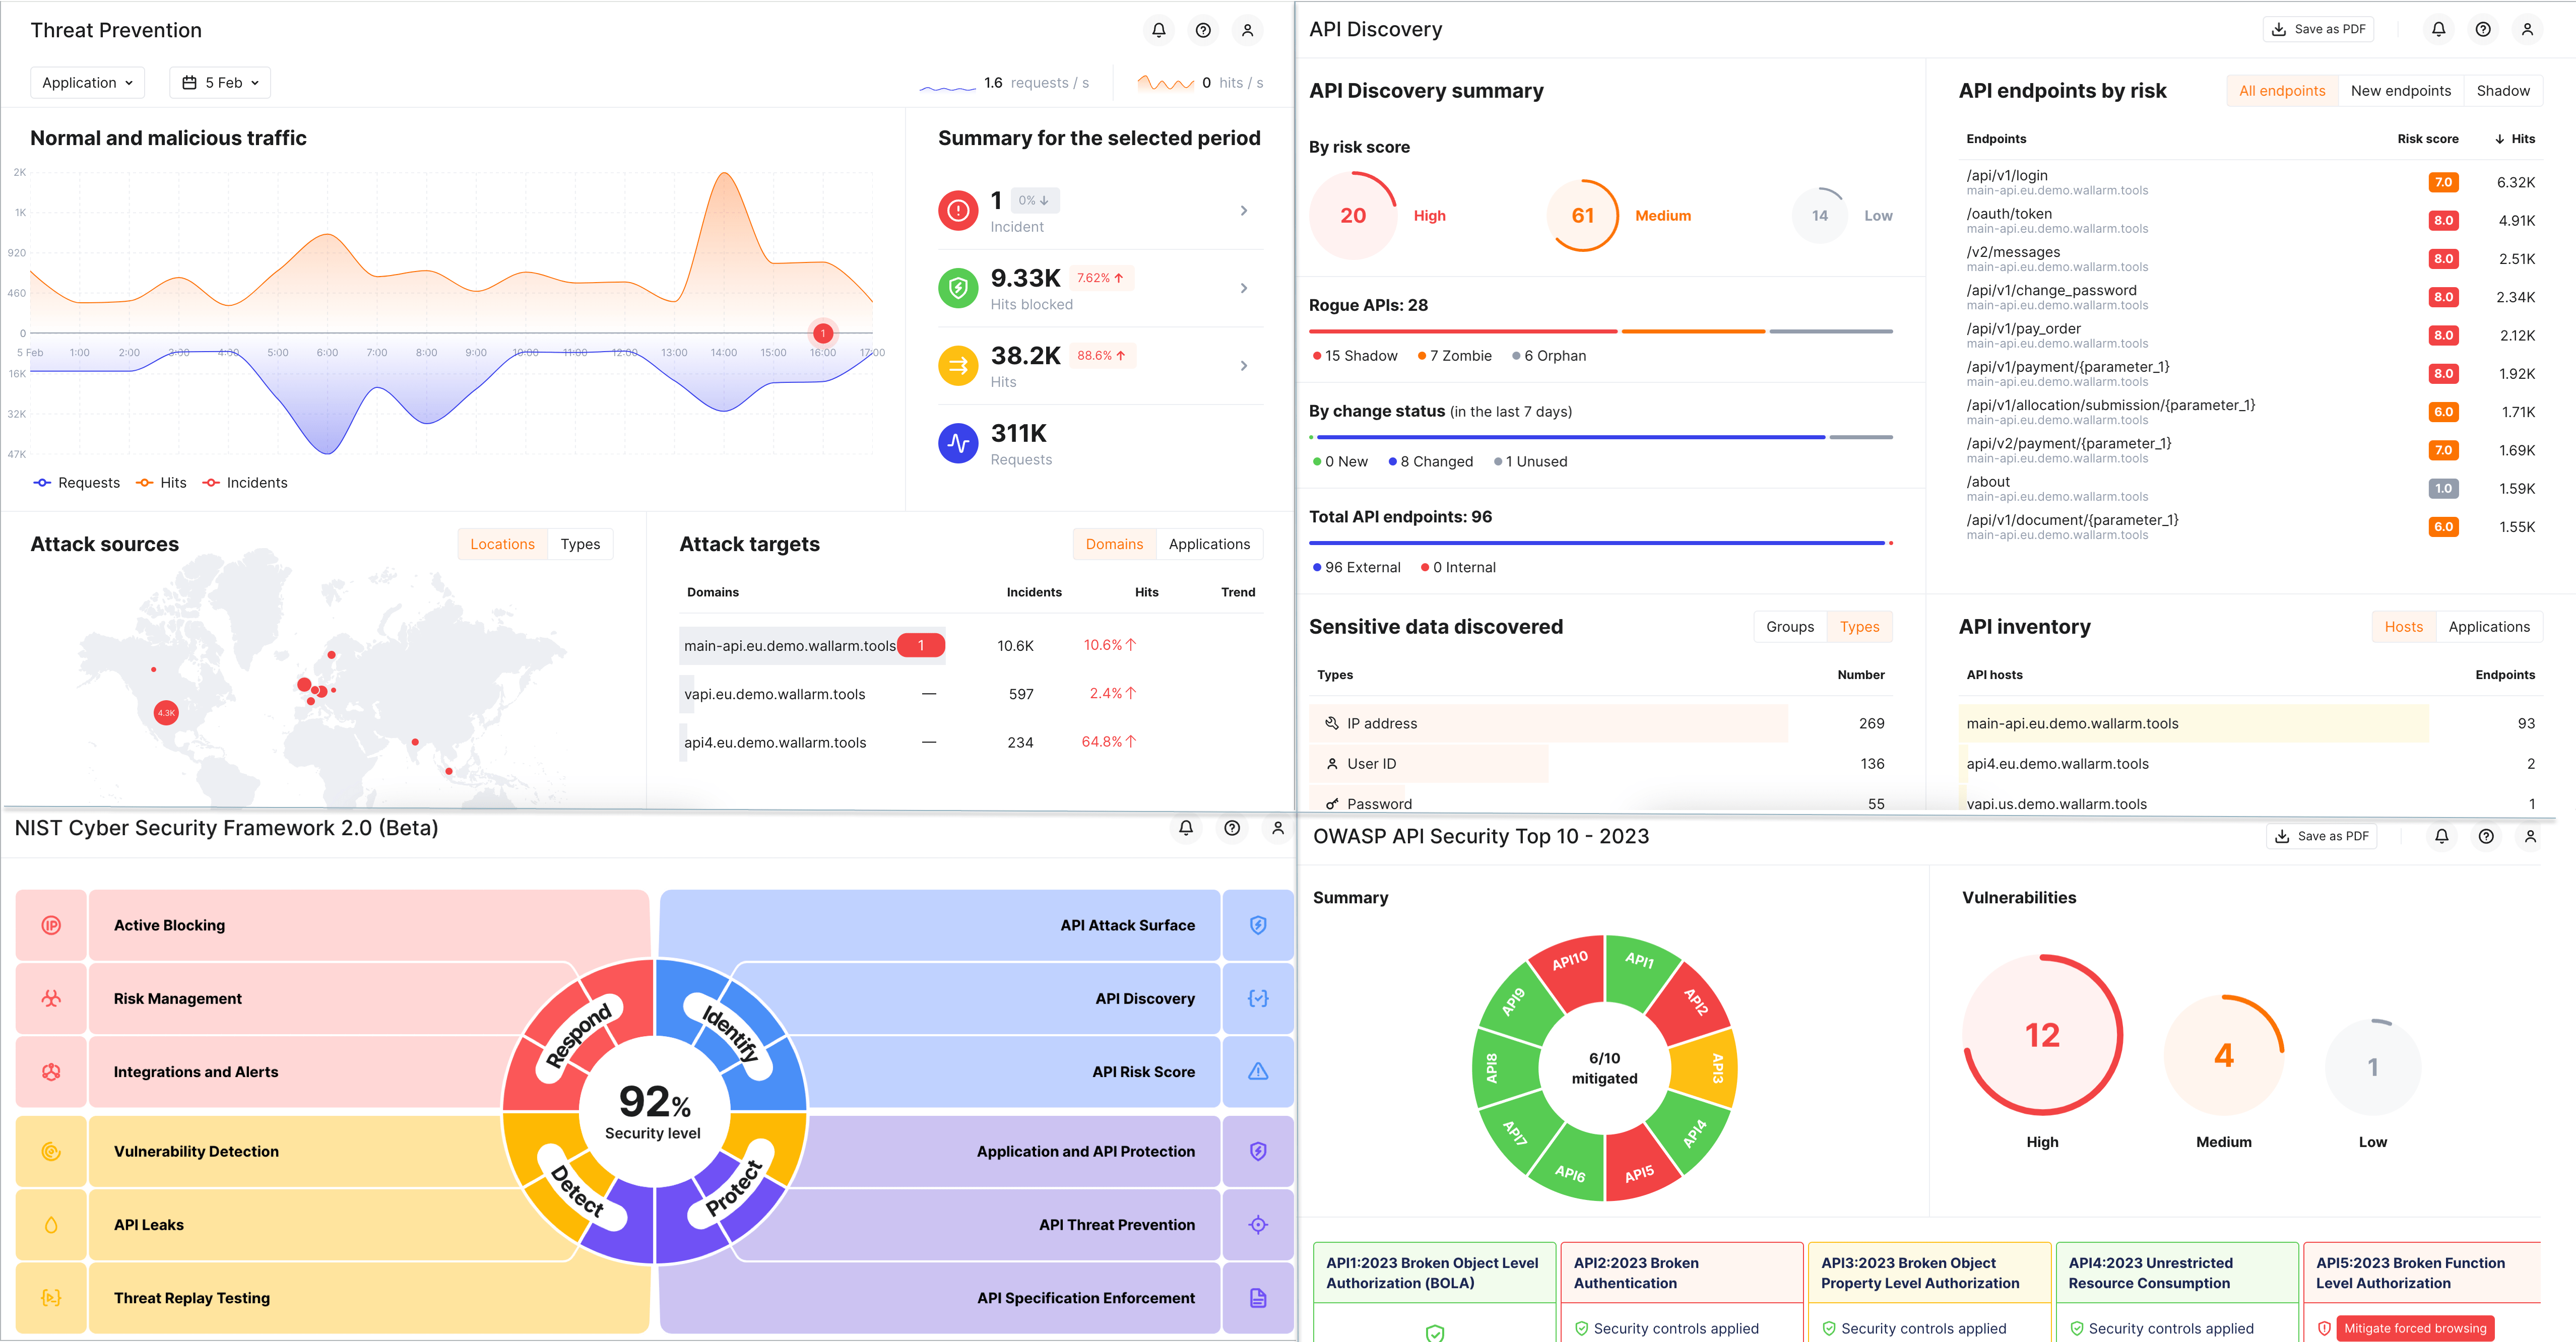
Dashboards
Built-in
Threat Management's built-in dashboards provide visualized summaries for your security perimeter and posture. All being interactive, they provide you with quick access to details and data in different parts of the system and configuration tools.
-
Get a clear view of the malicious traffic volume and its distribution by attack types, sources, protocols, authentication methods, etc. with the Threat Prevention dashboard.
-
Review data about your API collected by Wallarm's API Discovery with the API Discovery dashboard.
-
Check your coverage of the OWASP API Security Top 10 2023 and proactively implement security controls on the OWASP API Security Top 10 - 2023 dashboard.
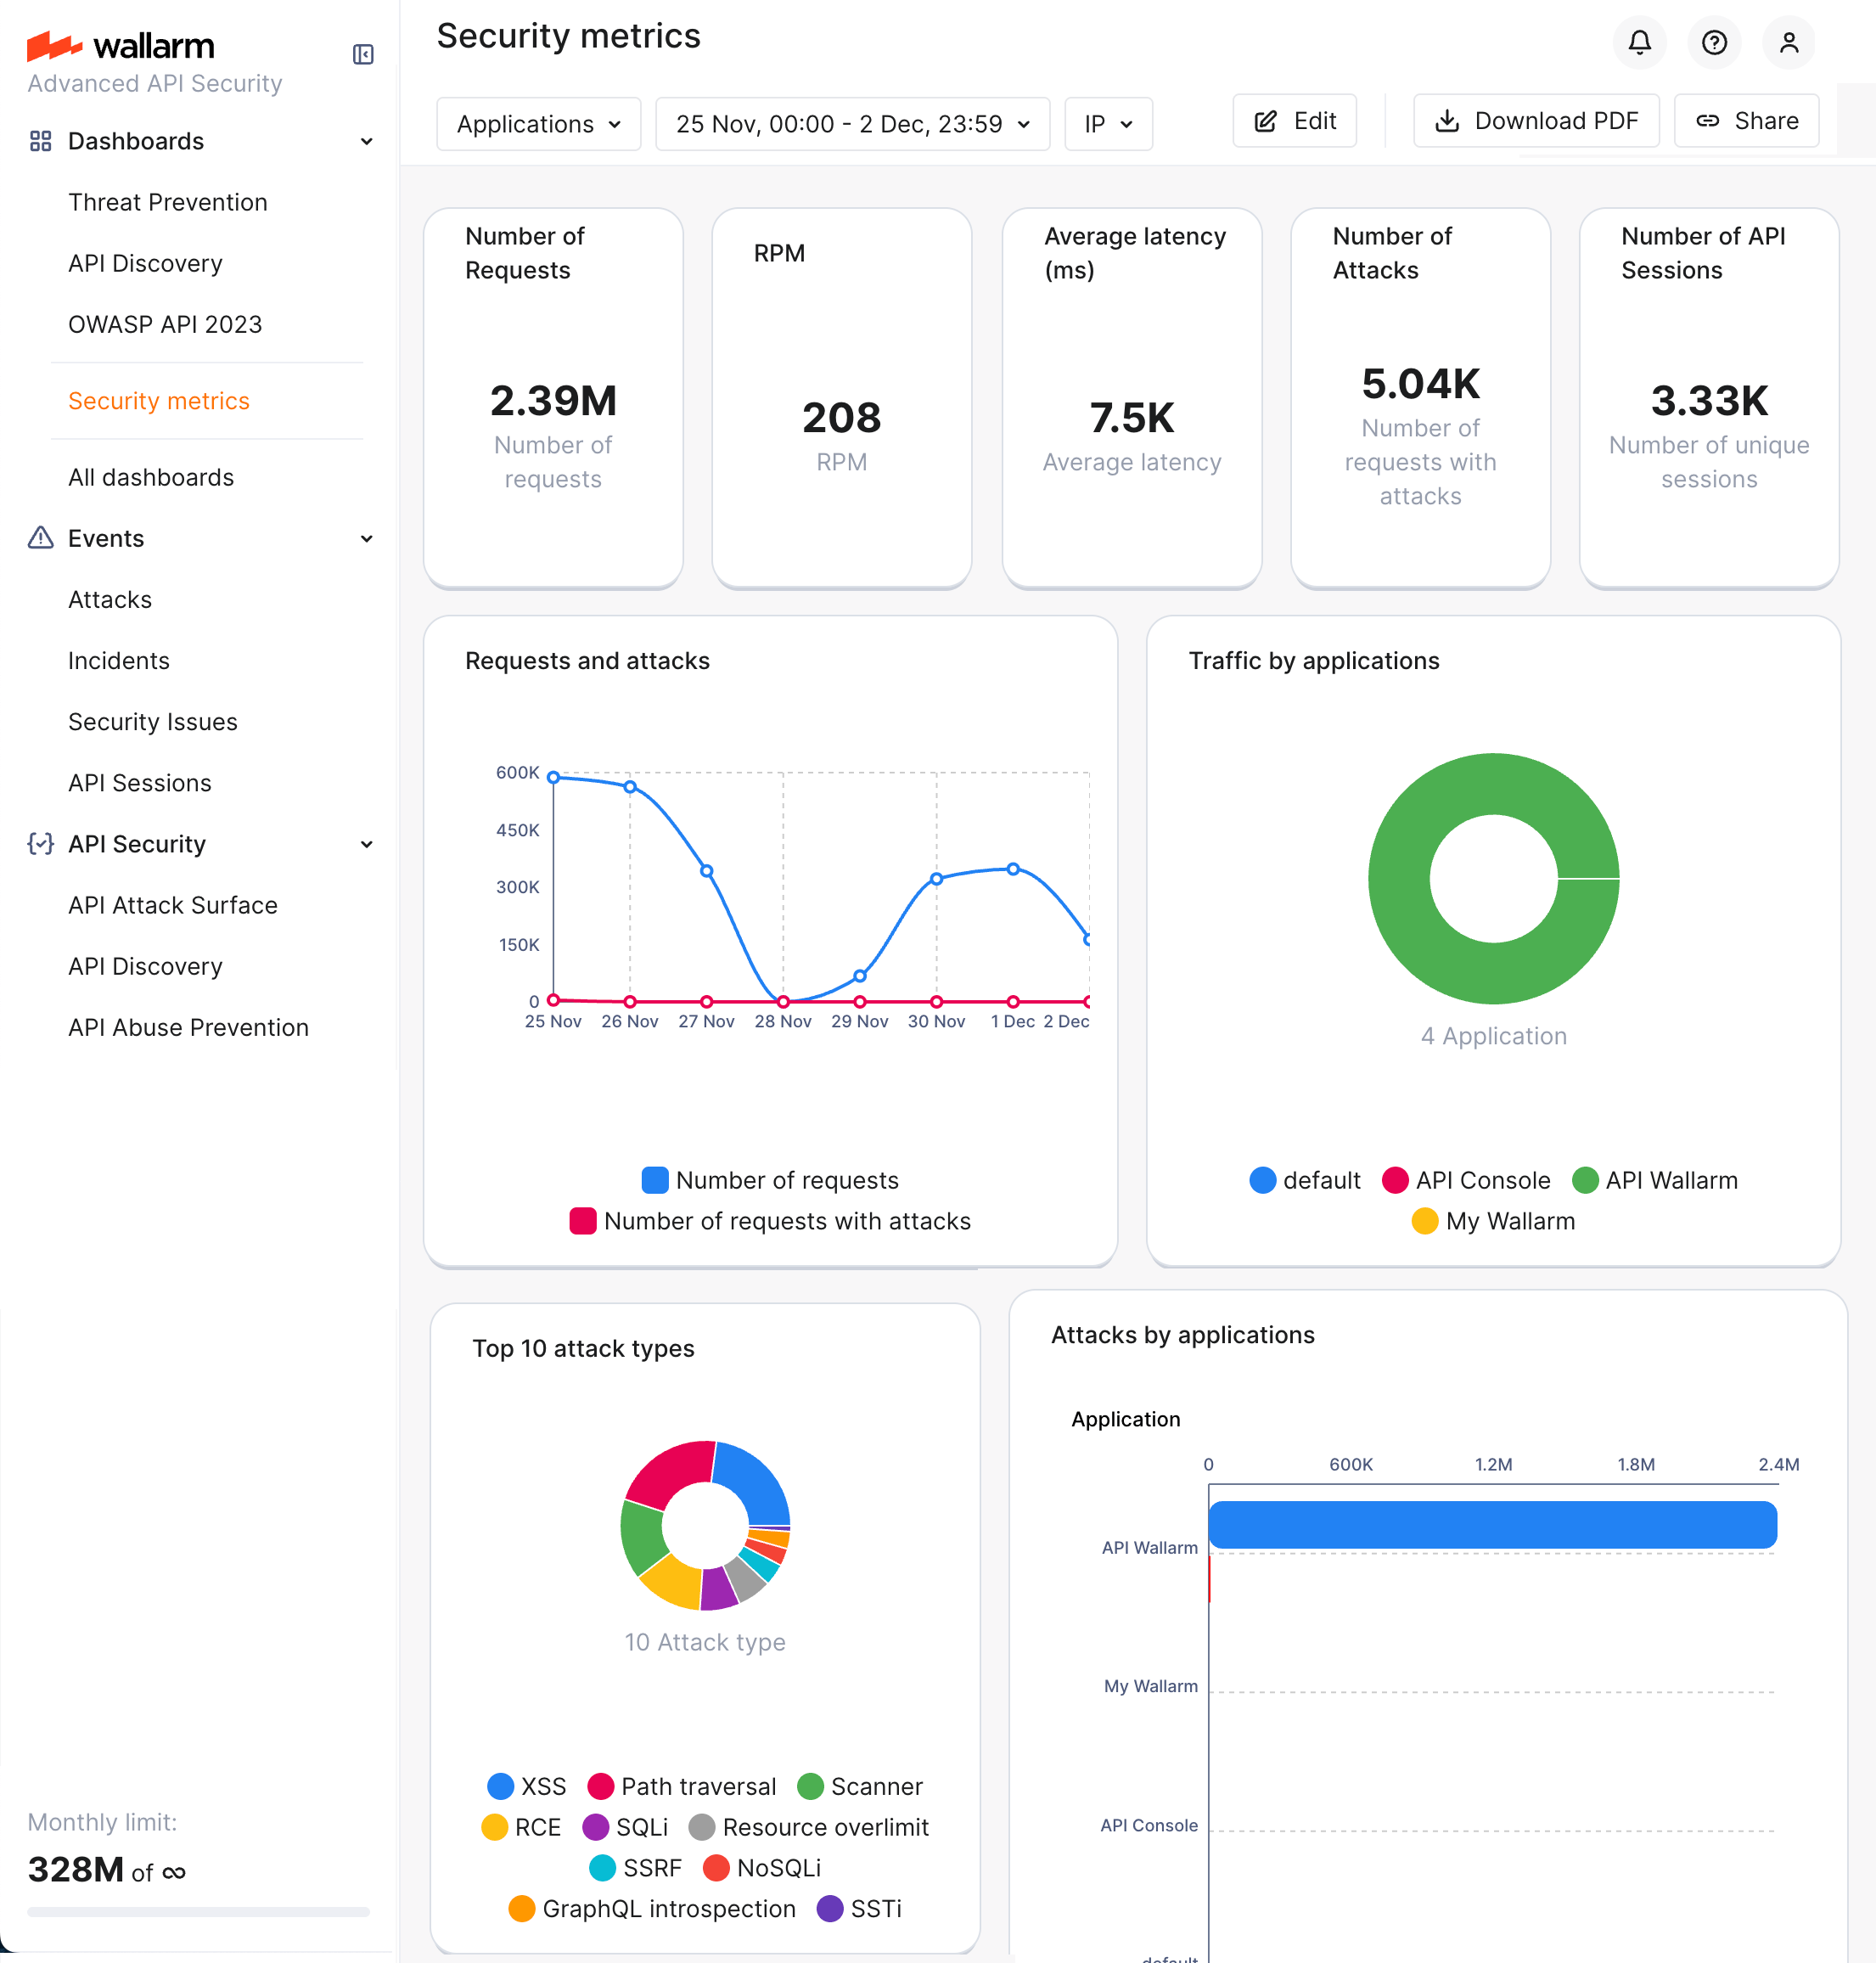
Business Intelligence
In addition to built-in dashboards, you can collect, present, and share the security data, crucial for your business in your own customizable dashboards.
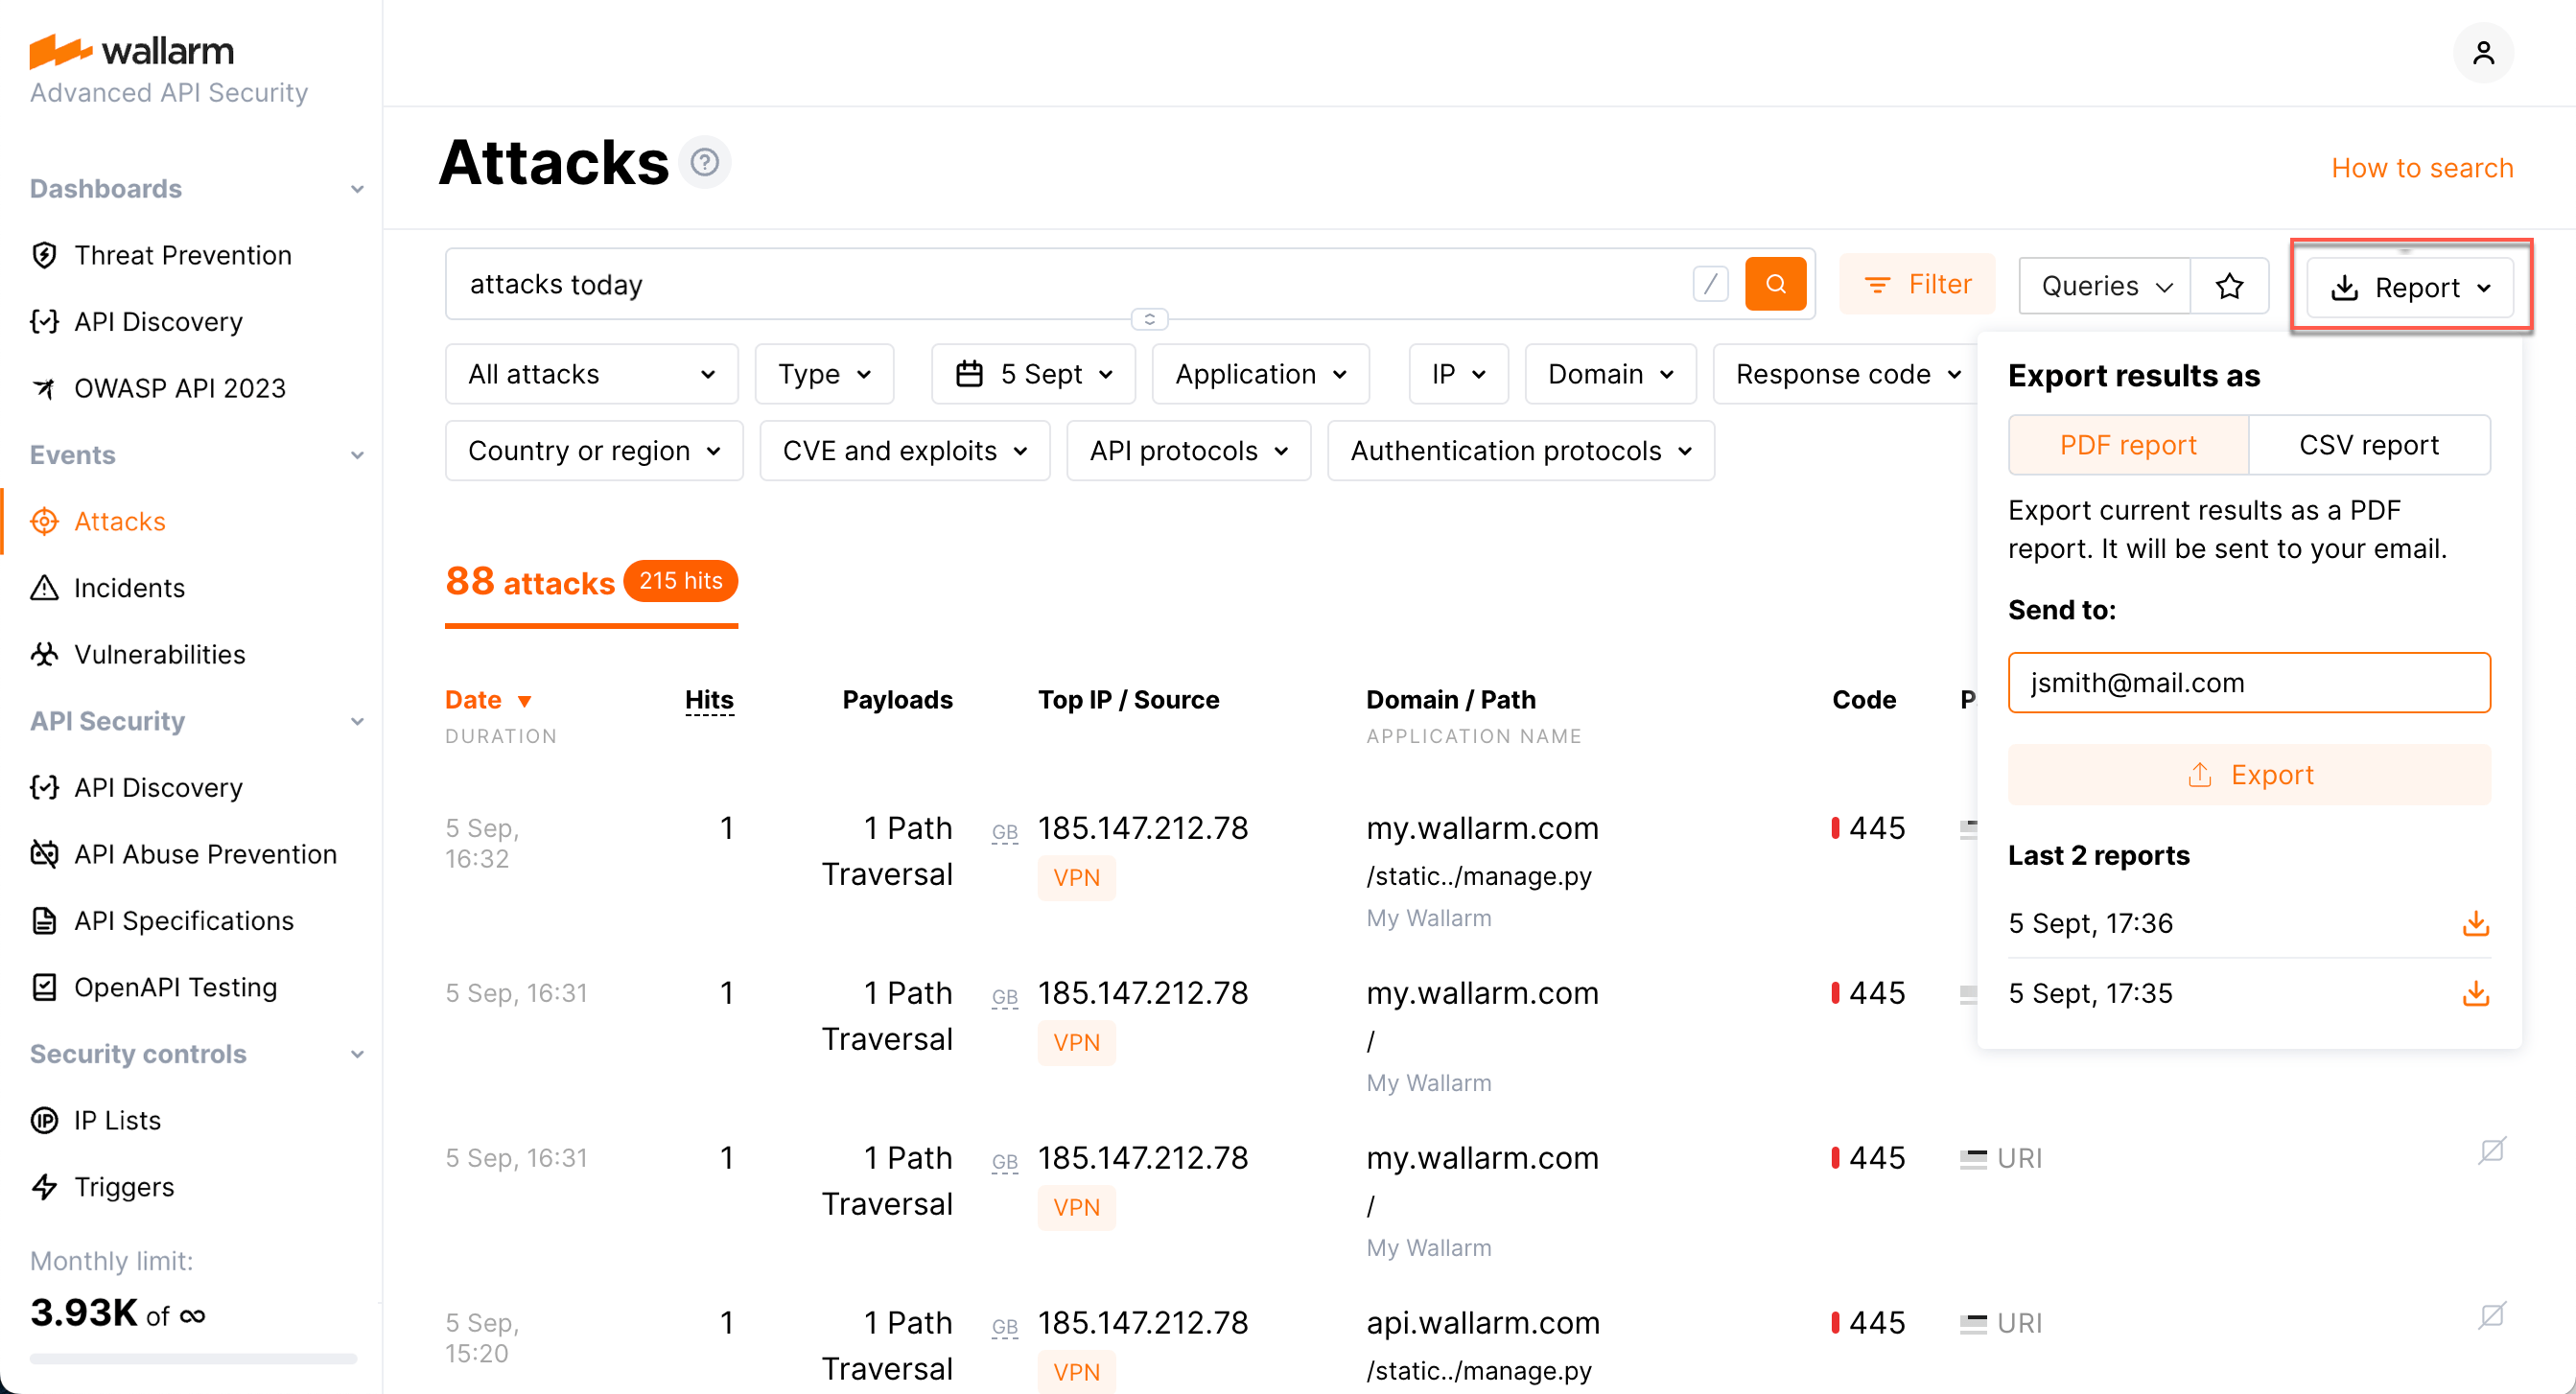
Attacks
Wallarm continuously analyzes application traffic, detects and mitigates attacks in real-time. The Attacks section of the Wallarm Console is the central hub for analyzing current attempts to penetrate your security perimeter and its staying protected from them as well as the tool for configuring additional security measures.
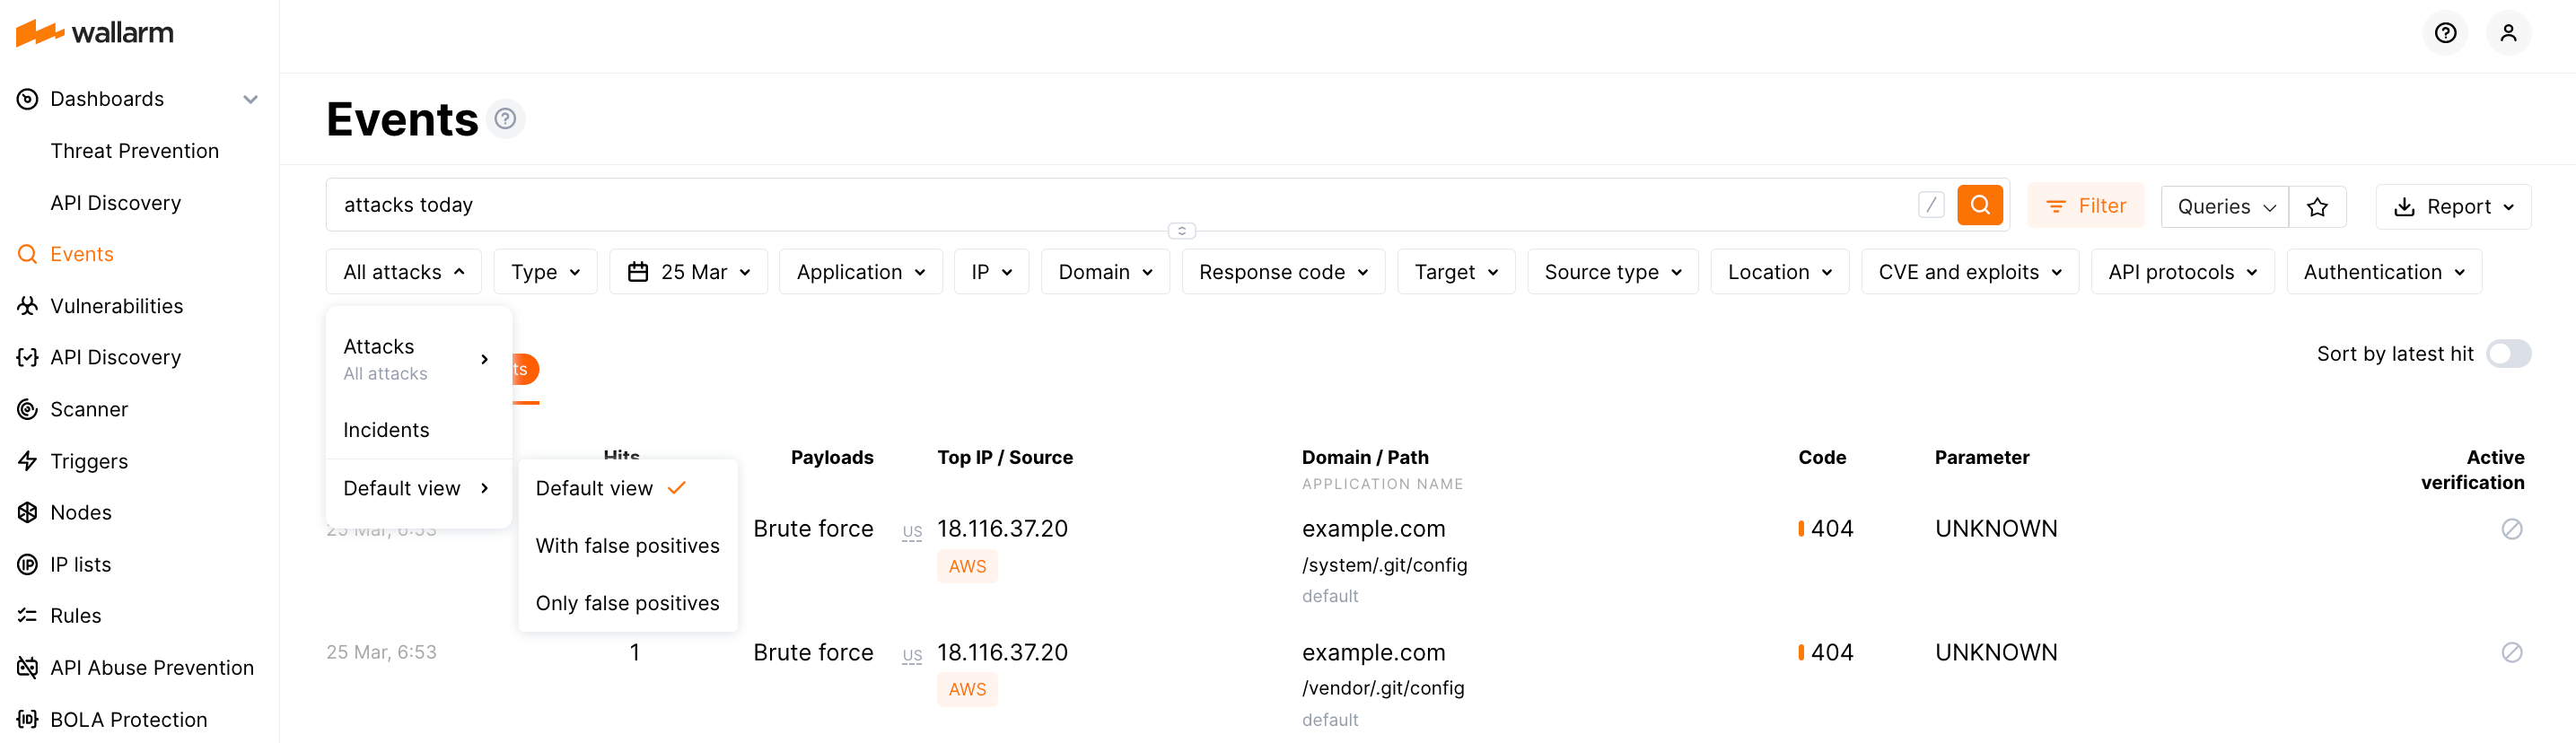
With Attacks section you can:
-
See current attacks and Wallarm's taken measures and limit what you see to:
- Attacks of specific types
- From specific IPs or geographical locations
- Occurred in specific time
- To specific applications or domains
- Etc.
-
See the same info for different periods - up to last 3 months
-
Create or modify rules for treating similar attacks in the future
-
Correct Wallarm's decision making by highlighting false positives
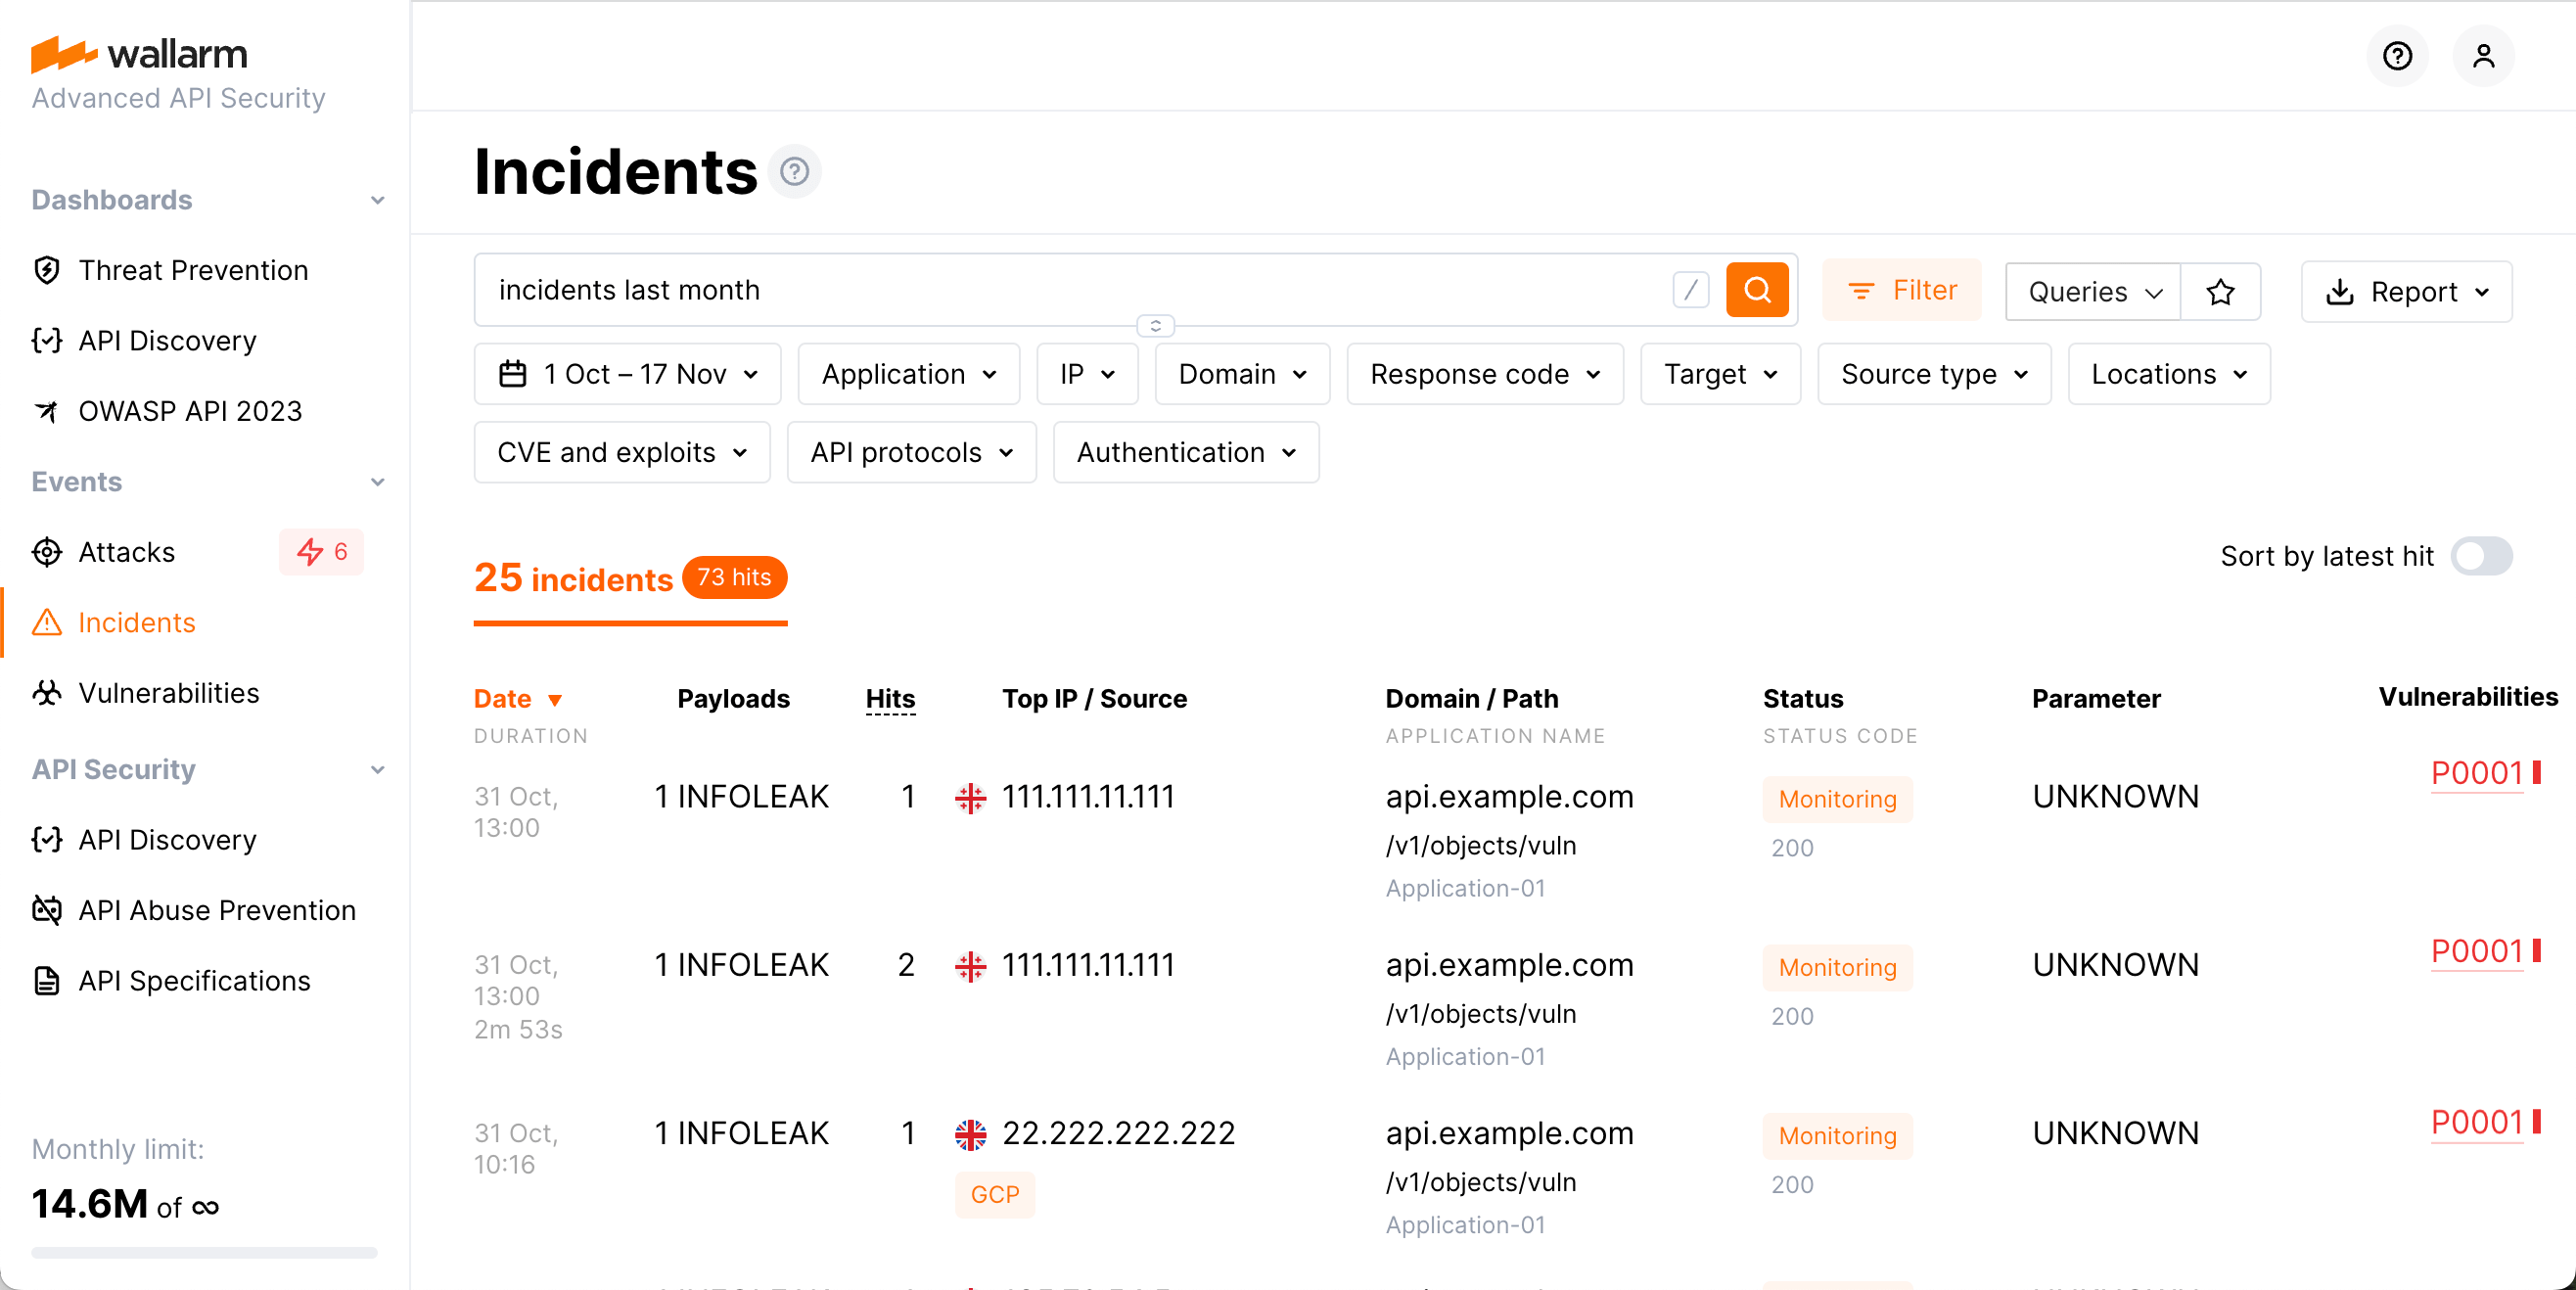
Incidents
The incidents are the attacks targeted at a confirmed vulnerability. The Incidents section connects all common attack data with the vulnerability it tries to exploit and thus you can:
-
Have all info and tools available in Attacks
-
Get related vulnerability data and full information about it
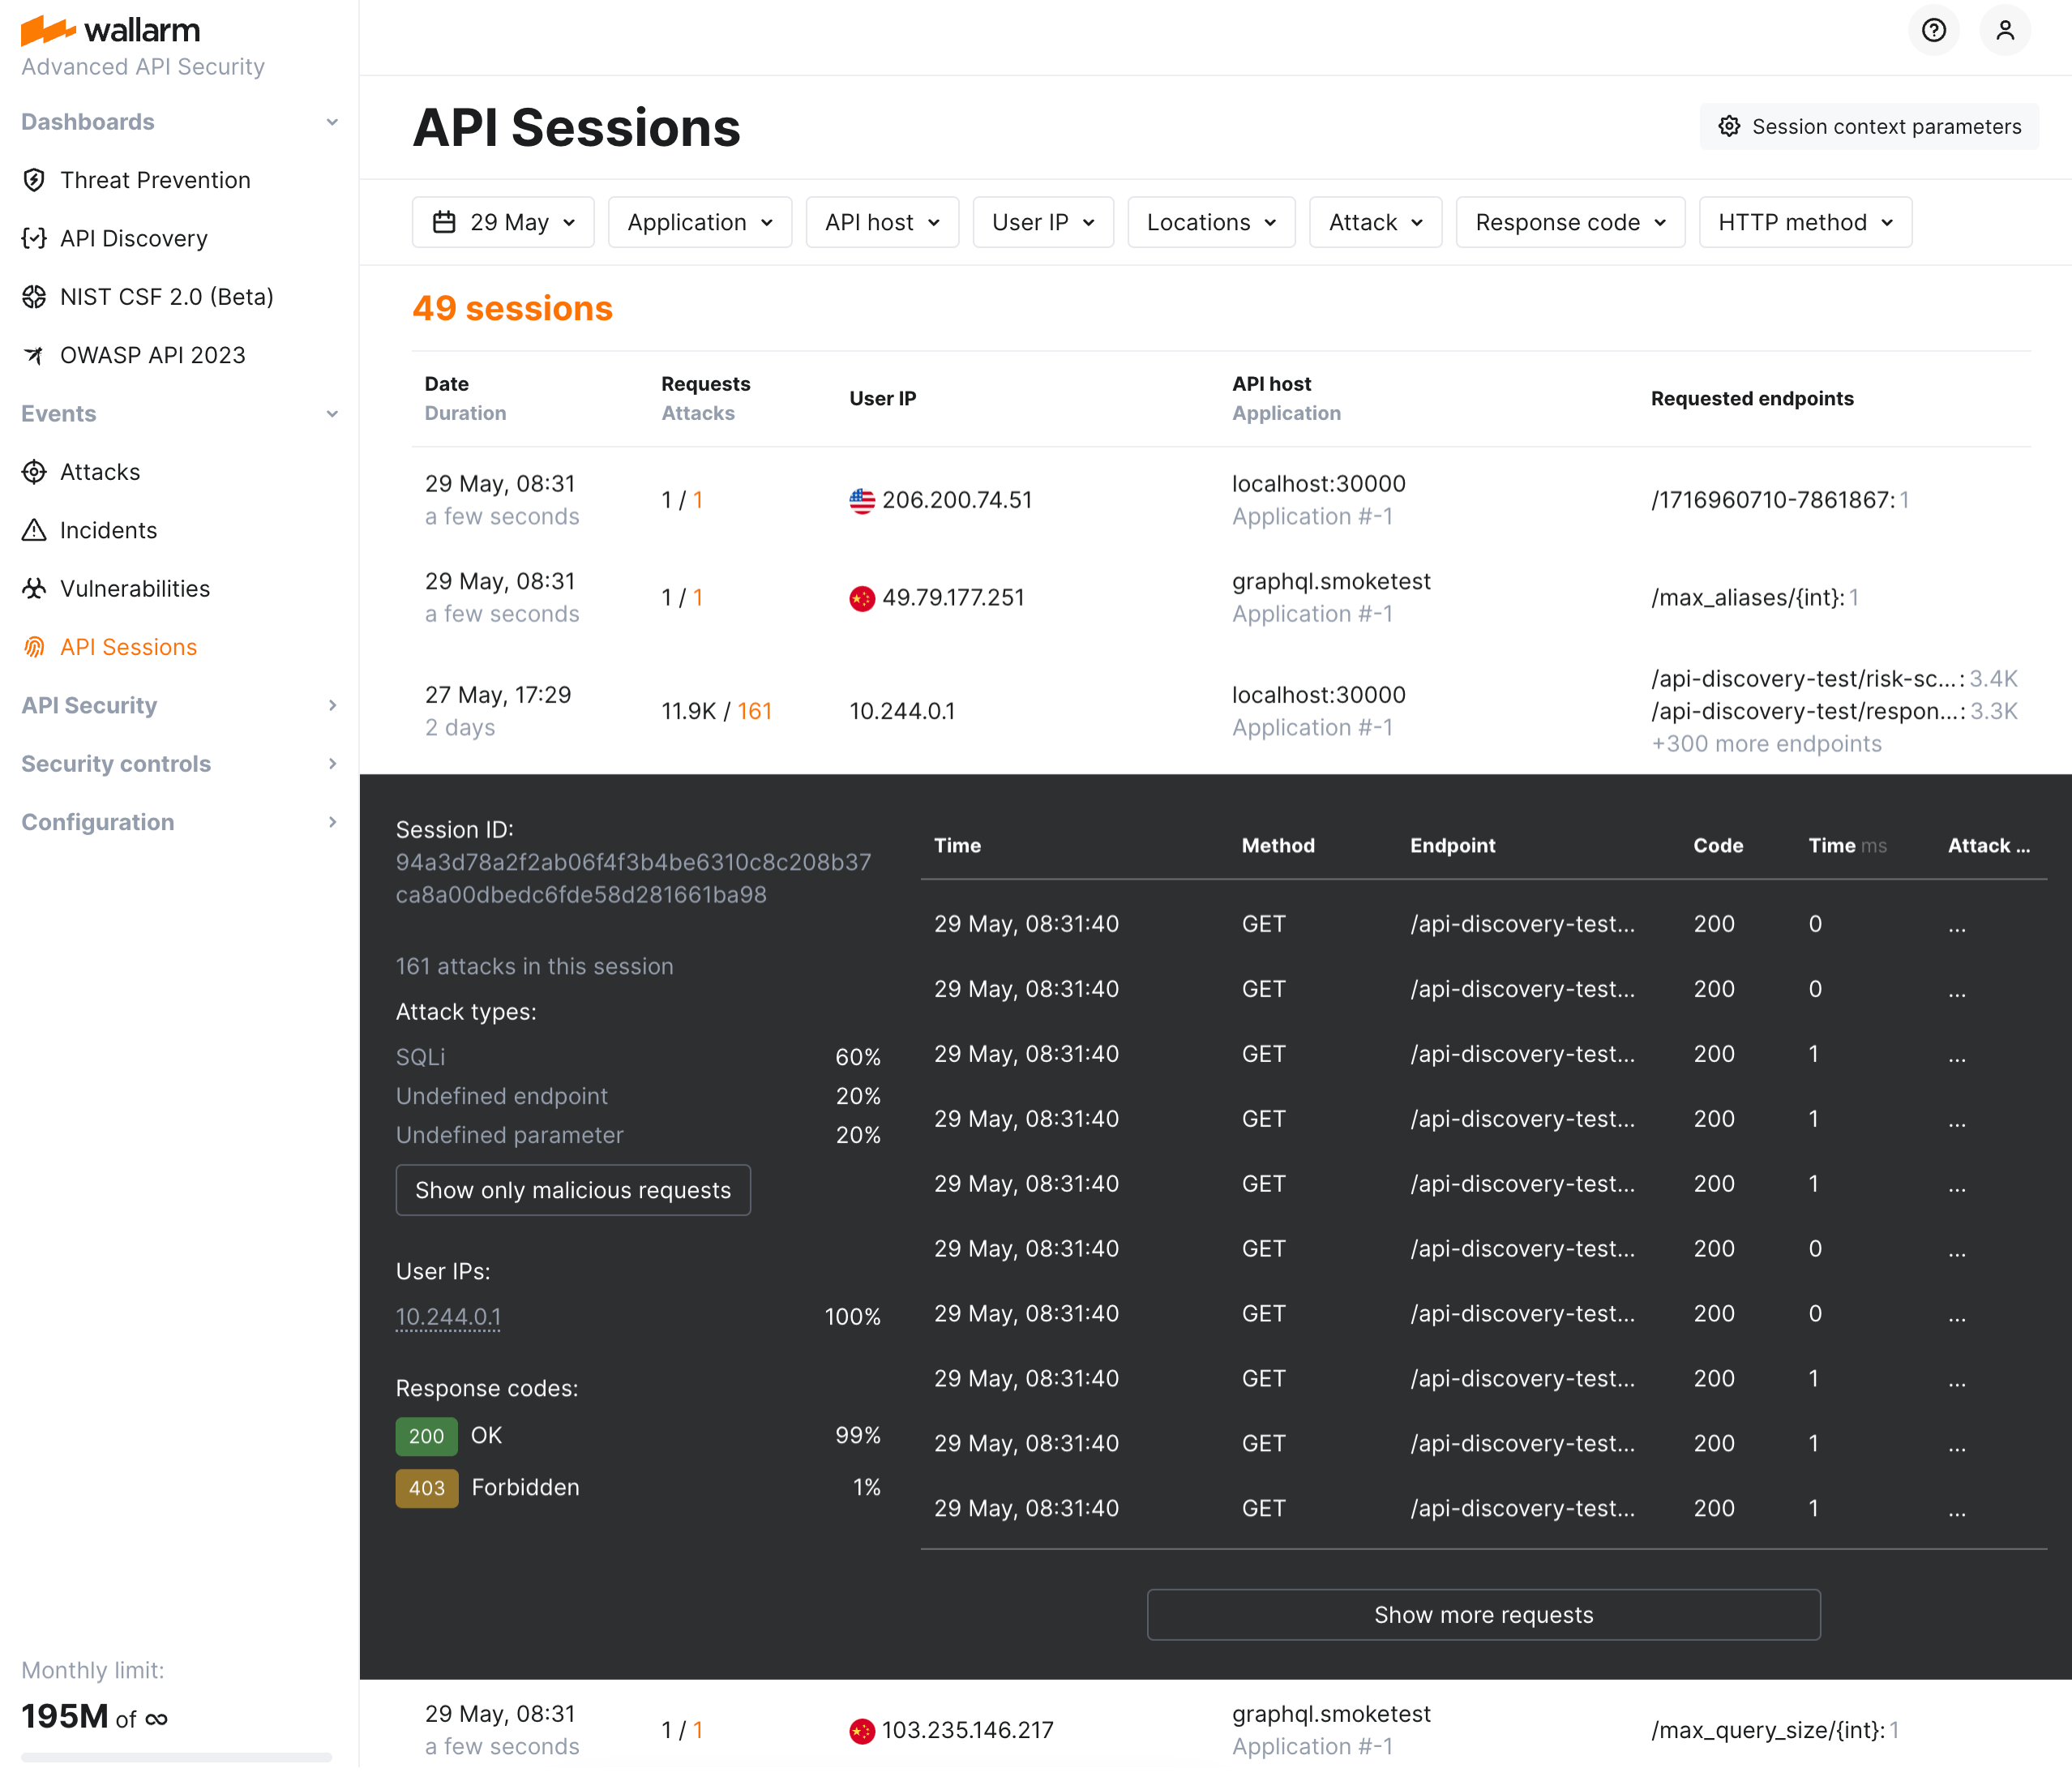
Sessions
The primary challenge the API Sessions address is the lack of full context when viewing only individual attacks detected by Wallarm. By capturing the logical sequence of requests and responses within each session, API Sessions provide insights into broader attack patterns and help identify the areas of business logic impacted by security measures.
Reports
For attacks, incidents or vulnerabilities, generate PDF or CSV reports. Do you want selected data? Apply filters and only filtered data will become part of the report.