User Tracks  


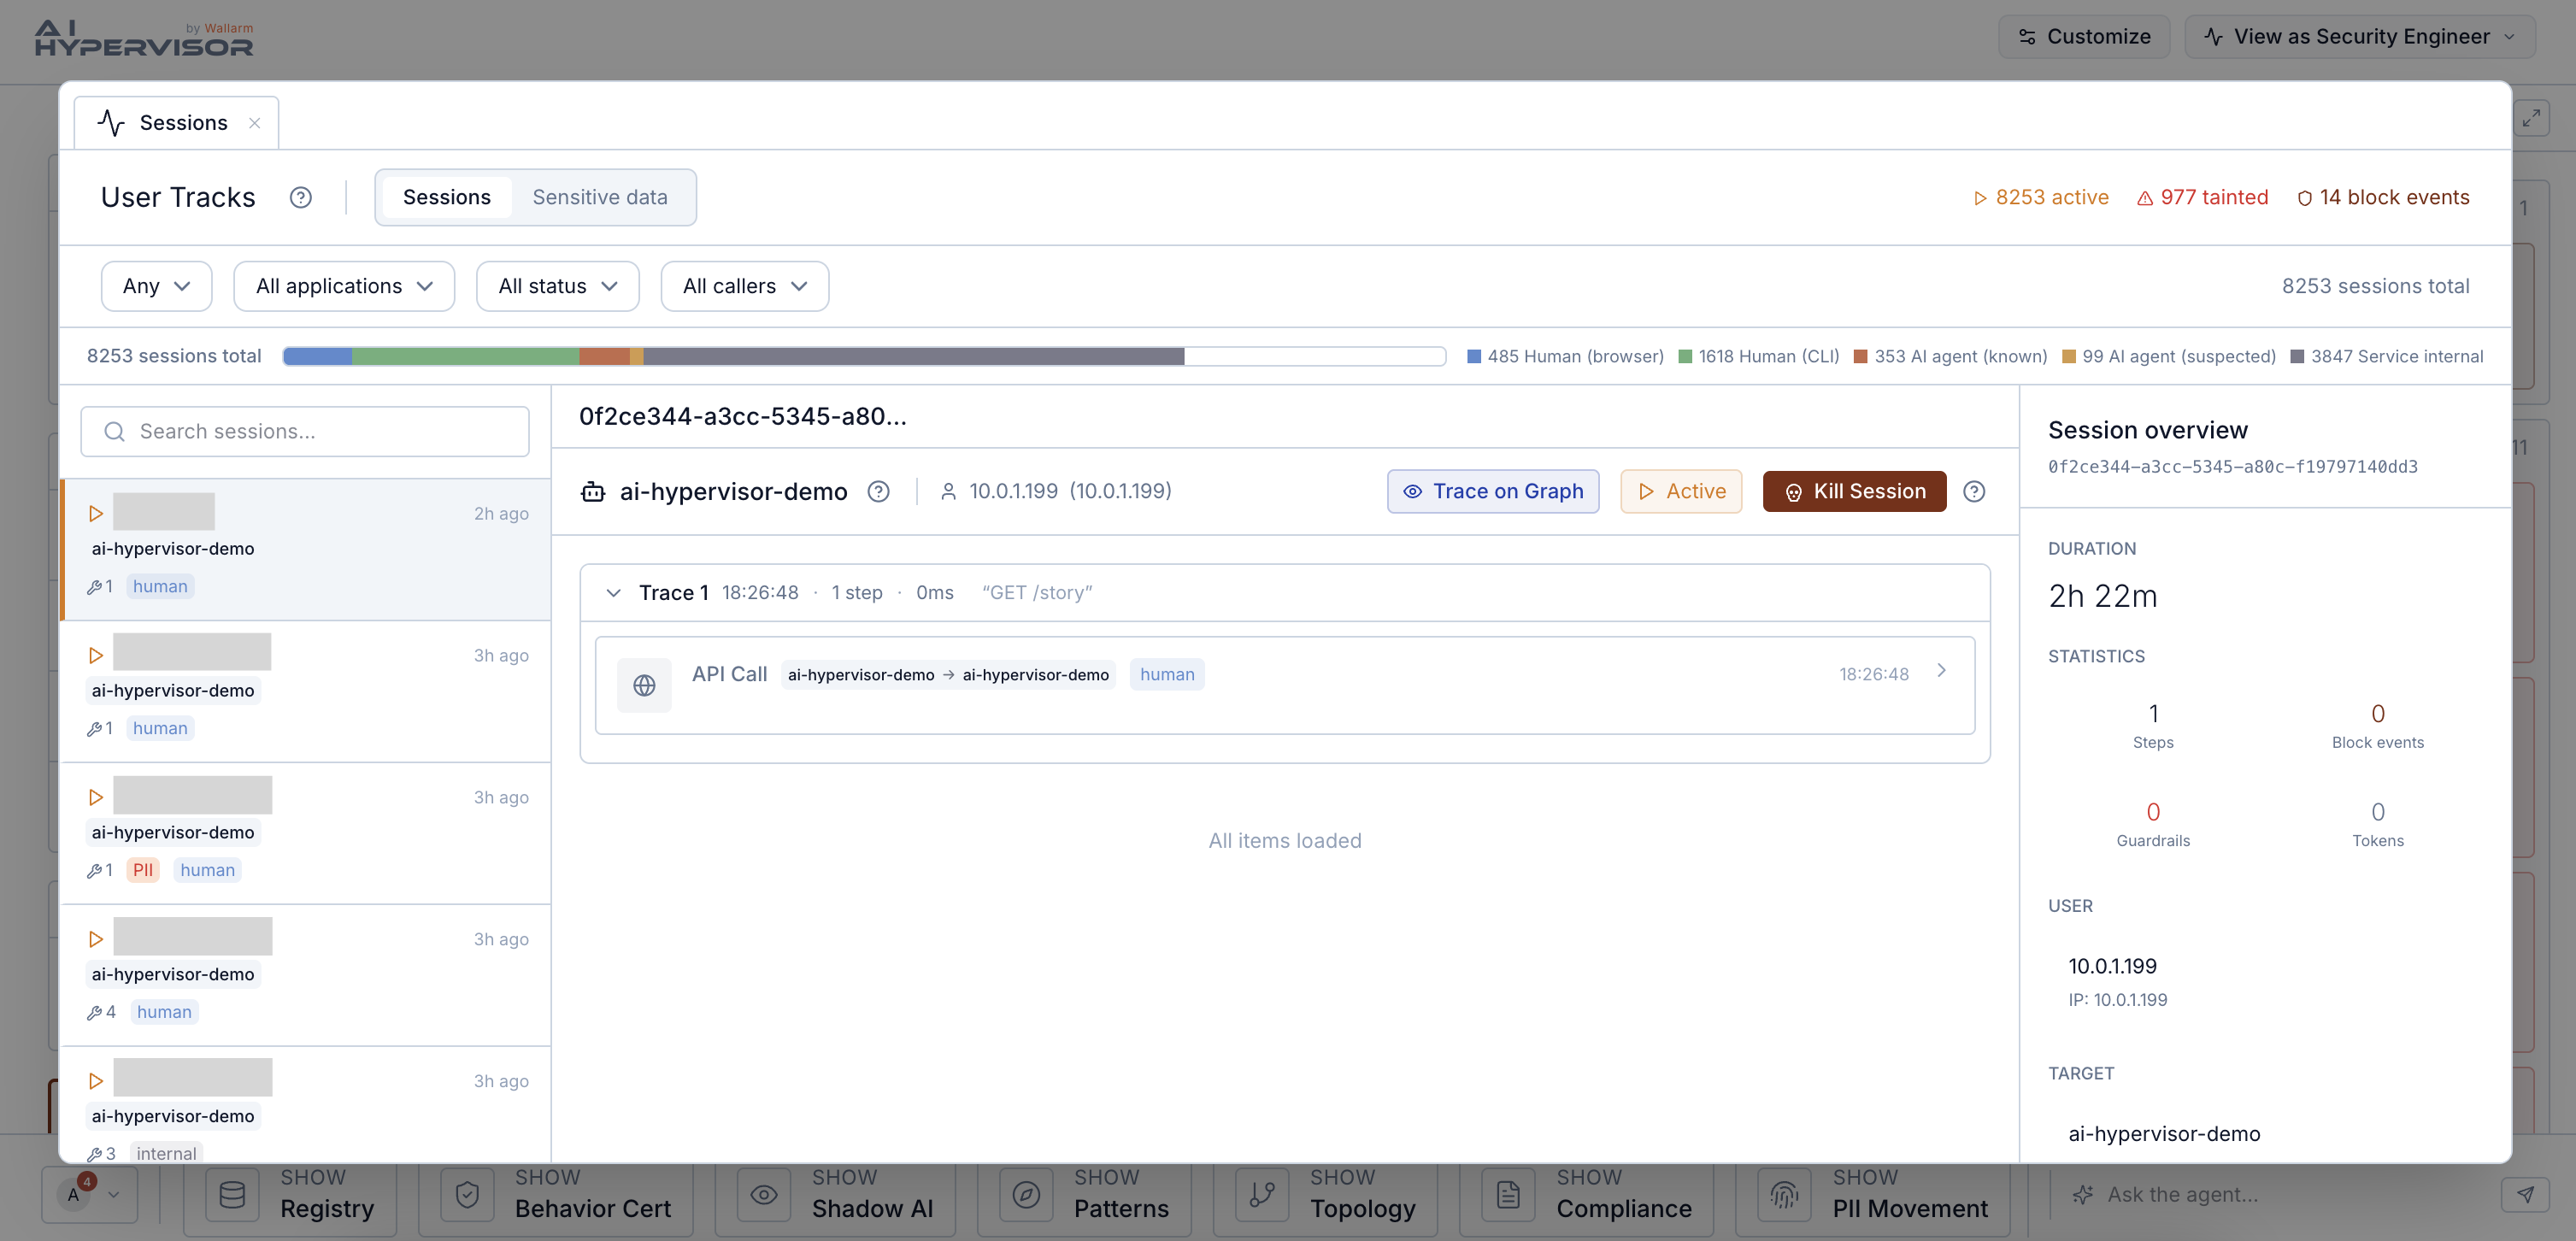
User Tracks is the session-level evidence view: every user-to-agent or agent-to-agent interaction as a discrete session, with the full chain from prompt through tool calls through responses, plus the PII profile and step-level evidence.
The page has two complementary views. Sessions follows agent sessions end to end. Sensitive data follows individual PII records across sessions.
How to reach this view
User Tracks does not appear in the Briefing action bar. You arrive here by drilling in from a session count or a finding:
-
Click a session-count tile on the Briefing (for example, Blocked sessions on the Executive view, Recent sessions on the Security Engineer view) and the destination is User Tracks filtered to that cohort.
-
Open a finding from the Findings by dimension strip and follow the sessions link on a row that carries one. The session waterfall opens here.
-
Follow a Trace on graph link from Data Tracks — it opens User Tracks in record mode for the trace that produced the flow.
Whether the entry tiles appear depends on the role's Briefing layout (Security Engineer has direct surfaces; Executive sees aggregate counts that drill in).
What a session record contains
For every session, AI Hypervisor reconstructs the chronological waterfall: every step in order, each with its own evidence. Step types include user prompts, agent thoughts, LLM calls, tool intents, tool calls, MCP responses, API calls, responses, and errors. The exact sequence depends on what the session did.
Per session, the record carries:
-
User identity. The calling end user, stitched across every internal service hop. See Cross-hop attribution below.
-
Applications touched. One or several, when the session crossed multiple apps via linked traces.
-
Tool-call count and PII presence indicators.
-
Status:
active,completed,killed,error, ortimeout. -
Per-step evidence. The prompt or payload, the step's status, and any PII detected in the payload.
For sessions that are actively misbehaving, the HIGGS Scanner can terminate the session at the kernel level (every open TCP connection of the session is reset, without touching other sessions on the same pod). The operator-facing Kill Session button is feature-flagged and enabled per tenant by Wallarm; the scanner-side primitive is always present. See Enforcement → Session-level termination.
Sensitive data view
Switching the page to Sensitive data follows individual PII records (a tracked email, an SSN, a token) rather than agent sessions. Each record carries:
-
Data class and the masked value.
-
Risk score derived from how the record has been accessed.
-
Access count. How many times the record was observed in motion.
-
Unique-agents count. How many distinct agents have touched it.
-
Journey of events: the timeline of accesses across sessions.
This is the right view for who has touched this customer's data, when, and how. Sessions are useful when investigating an incident; individual records are useful when answering a subject-access request or proving non-egress.
How user attribution works across service hops
When a session crosses multiple services (for example, a browser request enters service A, which calls service B, which calls an LLM) AI Hypervisor stitches the same user identity across all three hops. The downstream LLM call is attributed to the original caller even when the intermediate services did not forward the identity.
Stitching uses two methods:
-
Trace correlation. If the request carries a W3C
traceparentheader, the scanner reads it and joins on the trace ID. -
Kernel TID correlation. For services that do not propagate trace headers, the scanner correlates outbound socket activity to the inbound request via the kernel thread ID and a short observation window.
The result is the per-session waterfall described above: the original user's identity is attached to every step the session triggered, regardless of how many service hops separate the entry point from the model call.
Cross-references
| From User Tracks | You land in |
|---|---|
| Session → trace on graph | Data Tracks, filtered to the flow this session traversed |
| Sensitive-data record → trace flow | Data Tracks, filtered to the flow that produced the PII record |
| Calling agent | Registry, agent detail |
| Session-derived compliance evidence | Compliance |
Settings that affect User Tracks
-
Scan frequency (Settings → Cluster Infrastructure) controls how quickly new sessions appear.
-
The applications and namespaces observed are determined by where the scanner is deployed and which workloads carry the
higgs.scan=enabledlabel. See Labels and Annotations.