Learning the number of requests per month handled by your APIs
Wallarm's primary licensing/billing methods are based on the level of requests served by Wallarm filtering nodes deployed in your environment. This document explains how to easily learn the number of requests handled by your APIs.
Teams having an access to the information
Normally, the following teams in a company may have an easy access to the information:
-
DevOps
-
Technical Operations
-
Cloud Operations
-
Platform Operations
-
DevSecOps
-
System Administrators
-
NOC
Methods to learn the number of requests
There are several methods to look for the number of requests handled by the API:
-
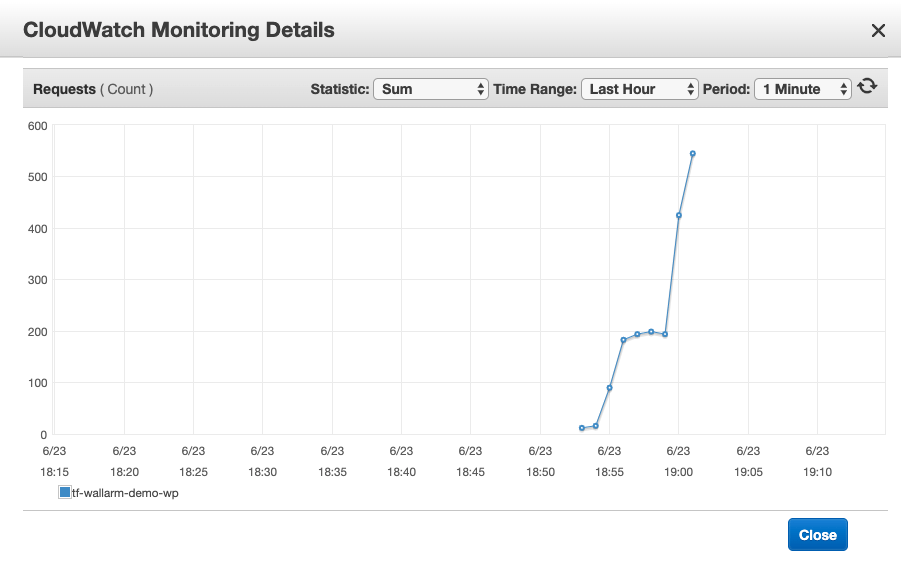
AWS customers using ELB or ALB load balancers can use AWS monitoring metrics of load balancers to estimate the level of daily and weekly requests for APIs served by the load balancers:

For example, if a graph shows that the average request per minute level is 350 and assuming that there are, on average, 730 hours in a month, then the number of monthly requests is
350 * 60 * 730 = 15,330,000. -
GCP users of HTTP load balancers can use monitoring metric https/request_count. The metric is not available for Network Load Balancers.
-
Microsoft IIS users can rely on Requests Per Sec metric to average the number of requests per second and calculate the number of requests served by a single IIS server per month. In calculation, assume that there are, on average,
730 * 3,600seconds per month. -
Users of Application Performance Monitoring services like New Relic, Datadog, AppDynamics, SignalFX and others can get the information from their APM consoles (just make sure to get an aggregated value for all involved servers in the edge layer, and not just one server).
-
Users of cloud‑based infrastructure monitoring systems like Datadog, AWS CloudWatch (and many others) or users of internal monitoring systems like Prometheus or Nagios most likely already monitor the level of requests served on their edge location (load balancers, web servers, API servers), and can use the information to easily estimate the average number of handled requests per month.
-
Another approach is to use the logs of edge load balancers or web servers to count the number of log records in a period of time (ideally - 24 hours) assuming that there is one log record per served requests. For example, this web server rotates the NGINX access log file once a day, with 653,525 requests recorded in the log file:
- The estimate of requests served by the server in a month is
653,525 * 30 = 19,605,750. - Knowing the total number of used web servers makes it possible to estimate the number of requests handled by the whole API.
- The estimate of requests served by the server in a month is
-
For pure web applications using Google Analytics or similar user experience tracking and monitoring services, the information about the number of served pages and all embedded objects can be extracted from the services.