IBM QRadar via Logstash
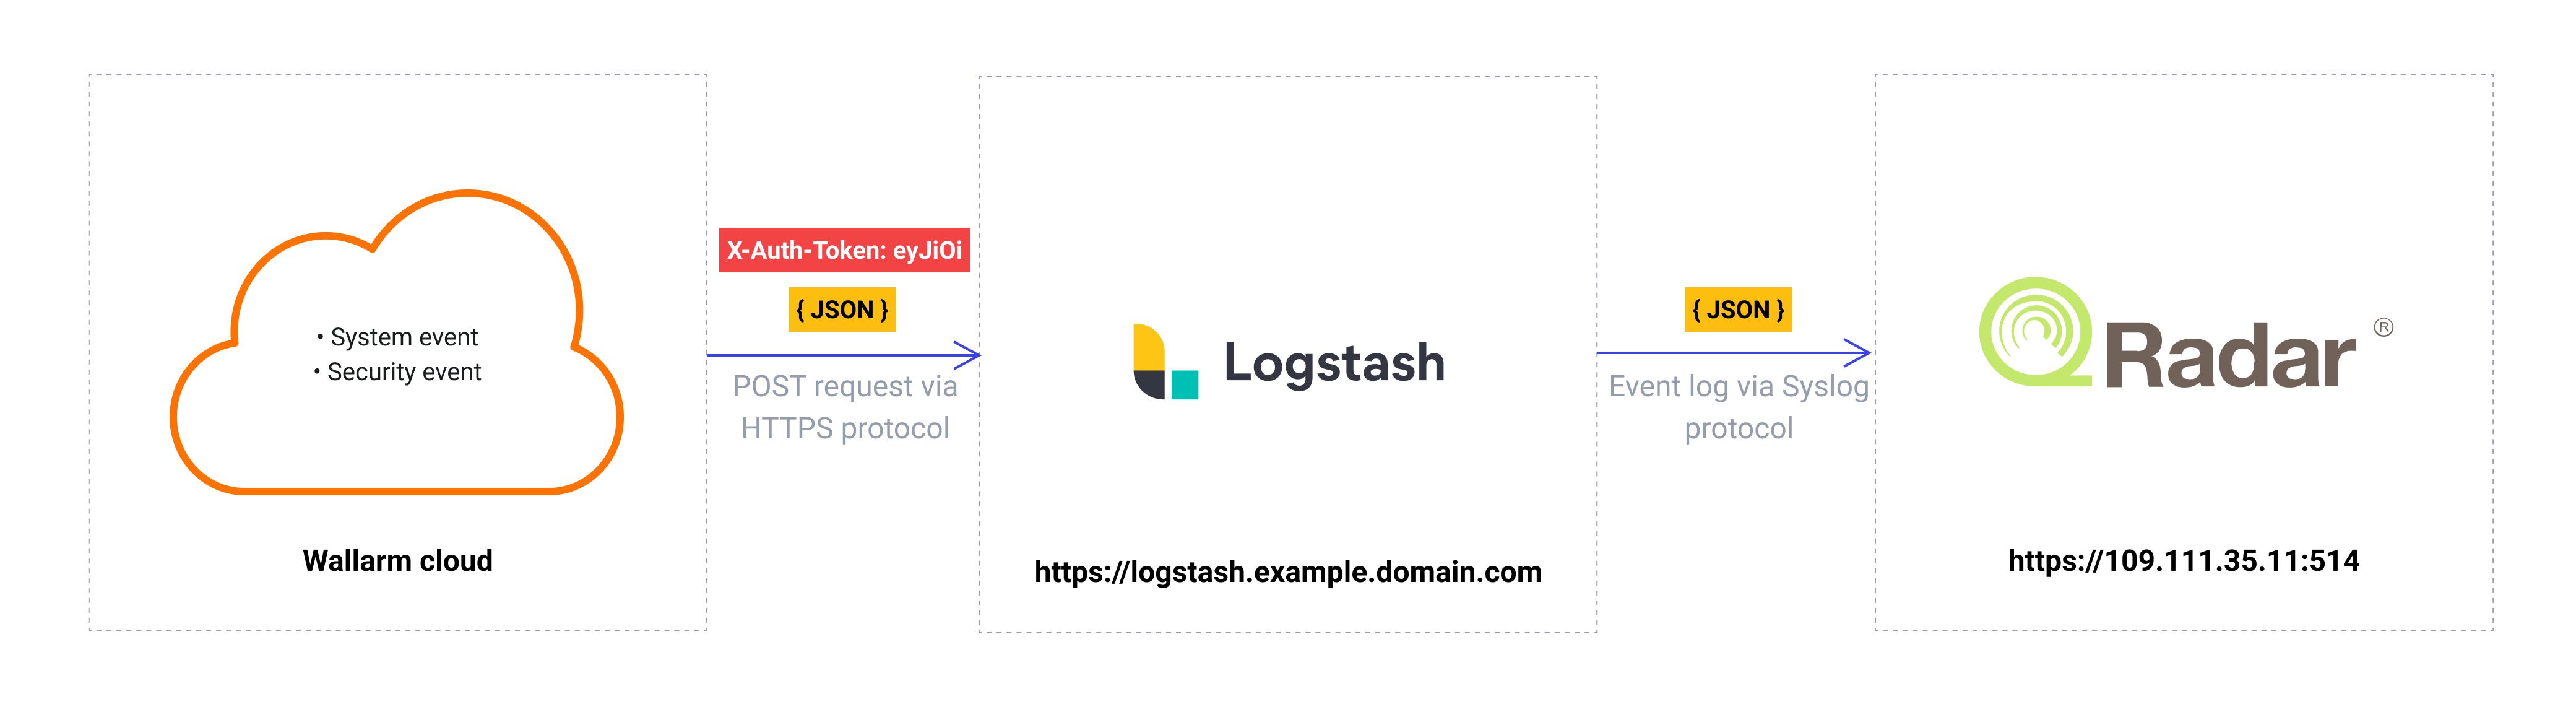
These instructions provide you with the example integration of Wallarm with the Logstash data collector to further forward events to the QRadar SIEM system.
The most common logging scheme in complex systems consists of the following components:
-
Data collector: accepts logs from several sources and forwards logs to the SIEM system
-
SIEM system or log management systems: used to analyze logs and monitor the system status
Used resources
-
Logstash 7.7.0 installed on Debian 11.x (bullseye) and available on
https://logstash.example.domain.com -
QRadar V7.3.3 installed on Linux Red Hat and available with the IP address
https://109.111.35.11:514 -
Administrator access to Wallarm Console in EU cloud to configure the Logstash integration
Wallarm Cloud IP addresses
To provide Wallarm Cloud access to your system, you may need a list of its public IP addresses:
Since the links to the Logstash and QRadar services are cited as examples, they do not respond.
Logstash configuration
Since Wallarm sends logs to the Logstash intermediate data collector via webhooks, the Logstash configuration should meet the following requirements:
-
Accept the POST or PUT requests
-
Accept HTTPS requests
-
Have a public URL
-
Forward logs to IBM QRadar, this example uses the
syslogplugin to forward logs
Logstash is configured in the logstash-sample.conf file:
-
Incoming webhook processing is configured in the
inputsection:- Traffic is sent to port 5044
- Logstash is configured to accept only HTTPS connections
- Logstash TLS certificate signed by a publicly trusted CA is located within the file
/etc/server.crt - Private key for TLS certificate is located within the file
/etc/server.key
-
Forwarding logs to QRadar and log output are configured in the
outputsection:- All event logs are forwarded from Logstash to QRadar at the IP address
https://109.111.35.11:514 - Logs are forwarded from Logstash to QRadar in the JSON format according to the Syslog standard
- Connection with QRadar is established via TCP
- Logstash logs are additionally printed on the command line (15th code line). The setting is used to verify that events are logged via Logstash
- All event logs are forwarded from Logstash to QRadar at the IP address
A more detailed description of the configuration files is available in the official Logstash documentation.
Testing Logstash configuration
To check that Logstash logs are created and forwarded to QRadar, the POST request can be sent to Logstash.
Request example:
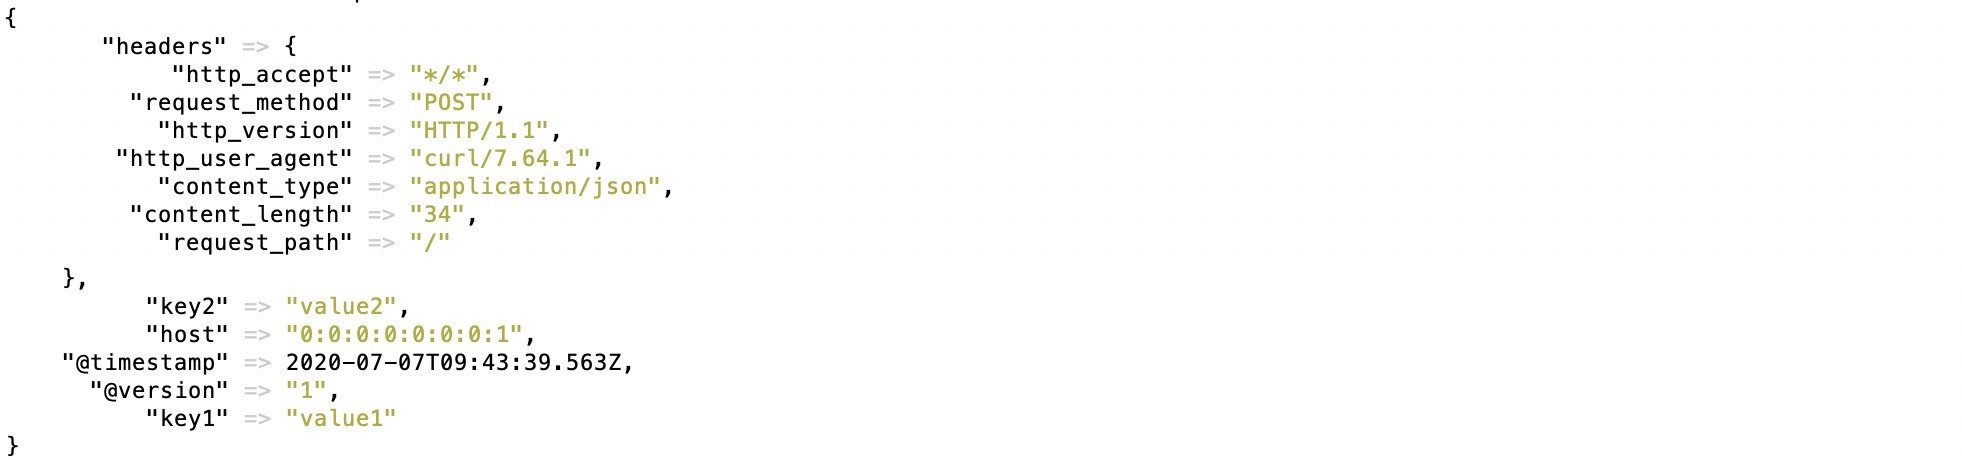
curl -X POST 'https://logstash.example.domain.com' -H "Content-Type: application/json" -d '{"key1":"value1", "key2":"value2"}'
Logstash logs:
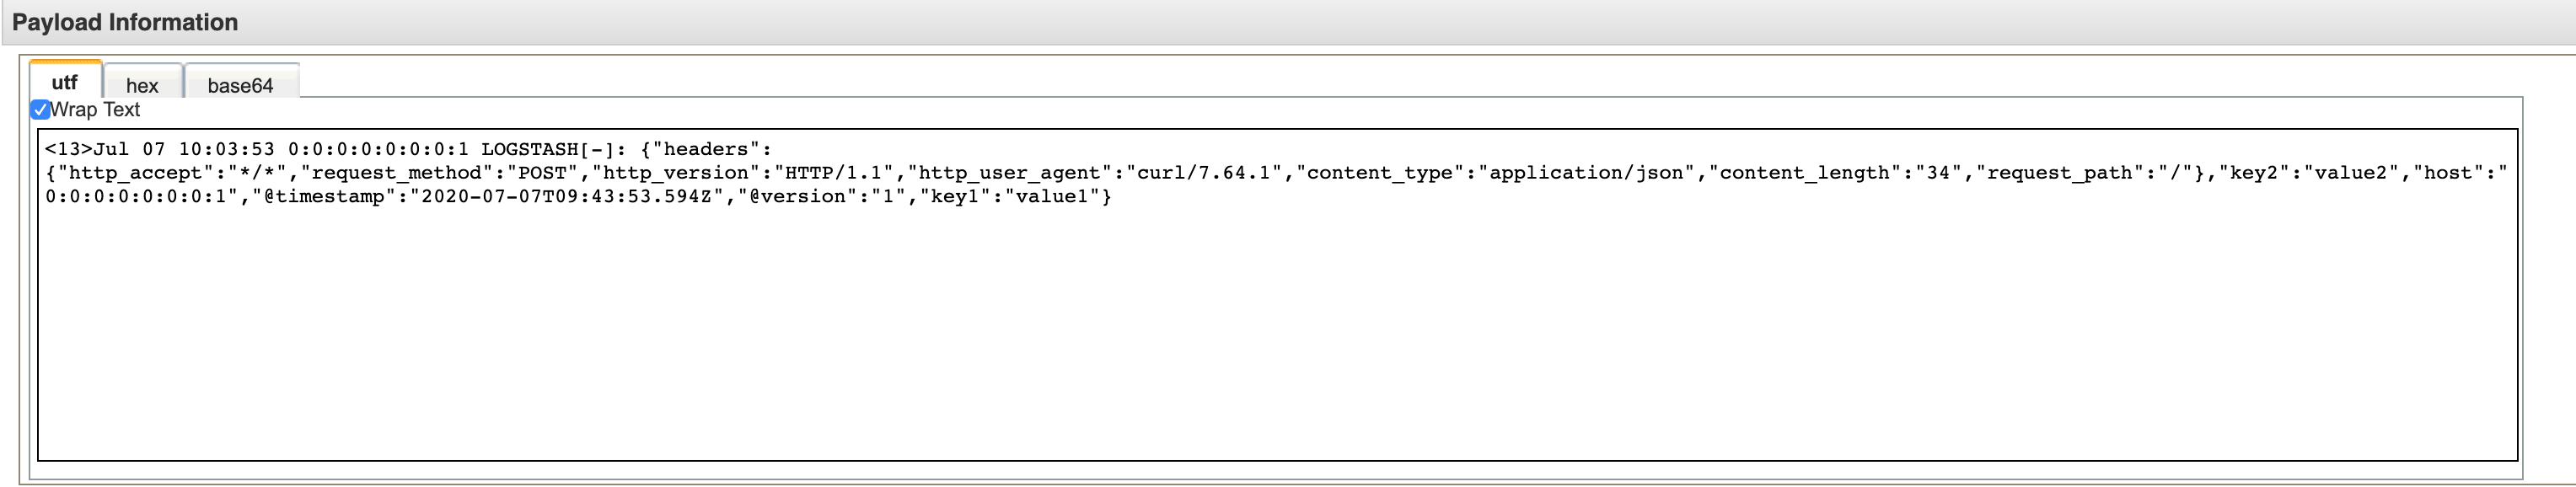
QRadar logs:

QRadar log payload:
QRadar configuration (optional)
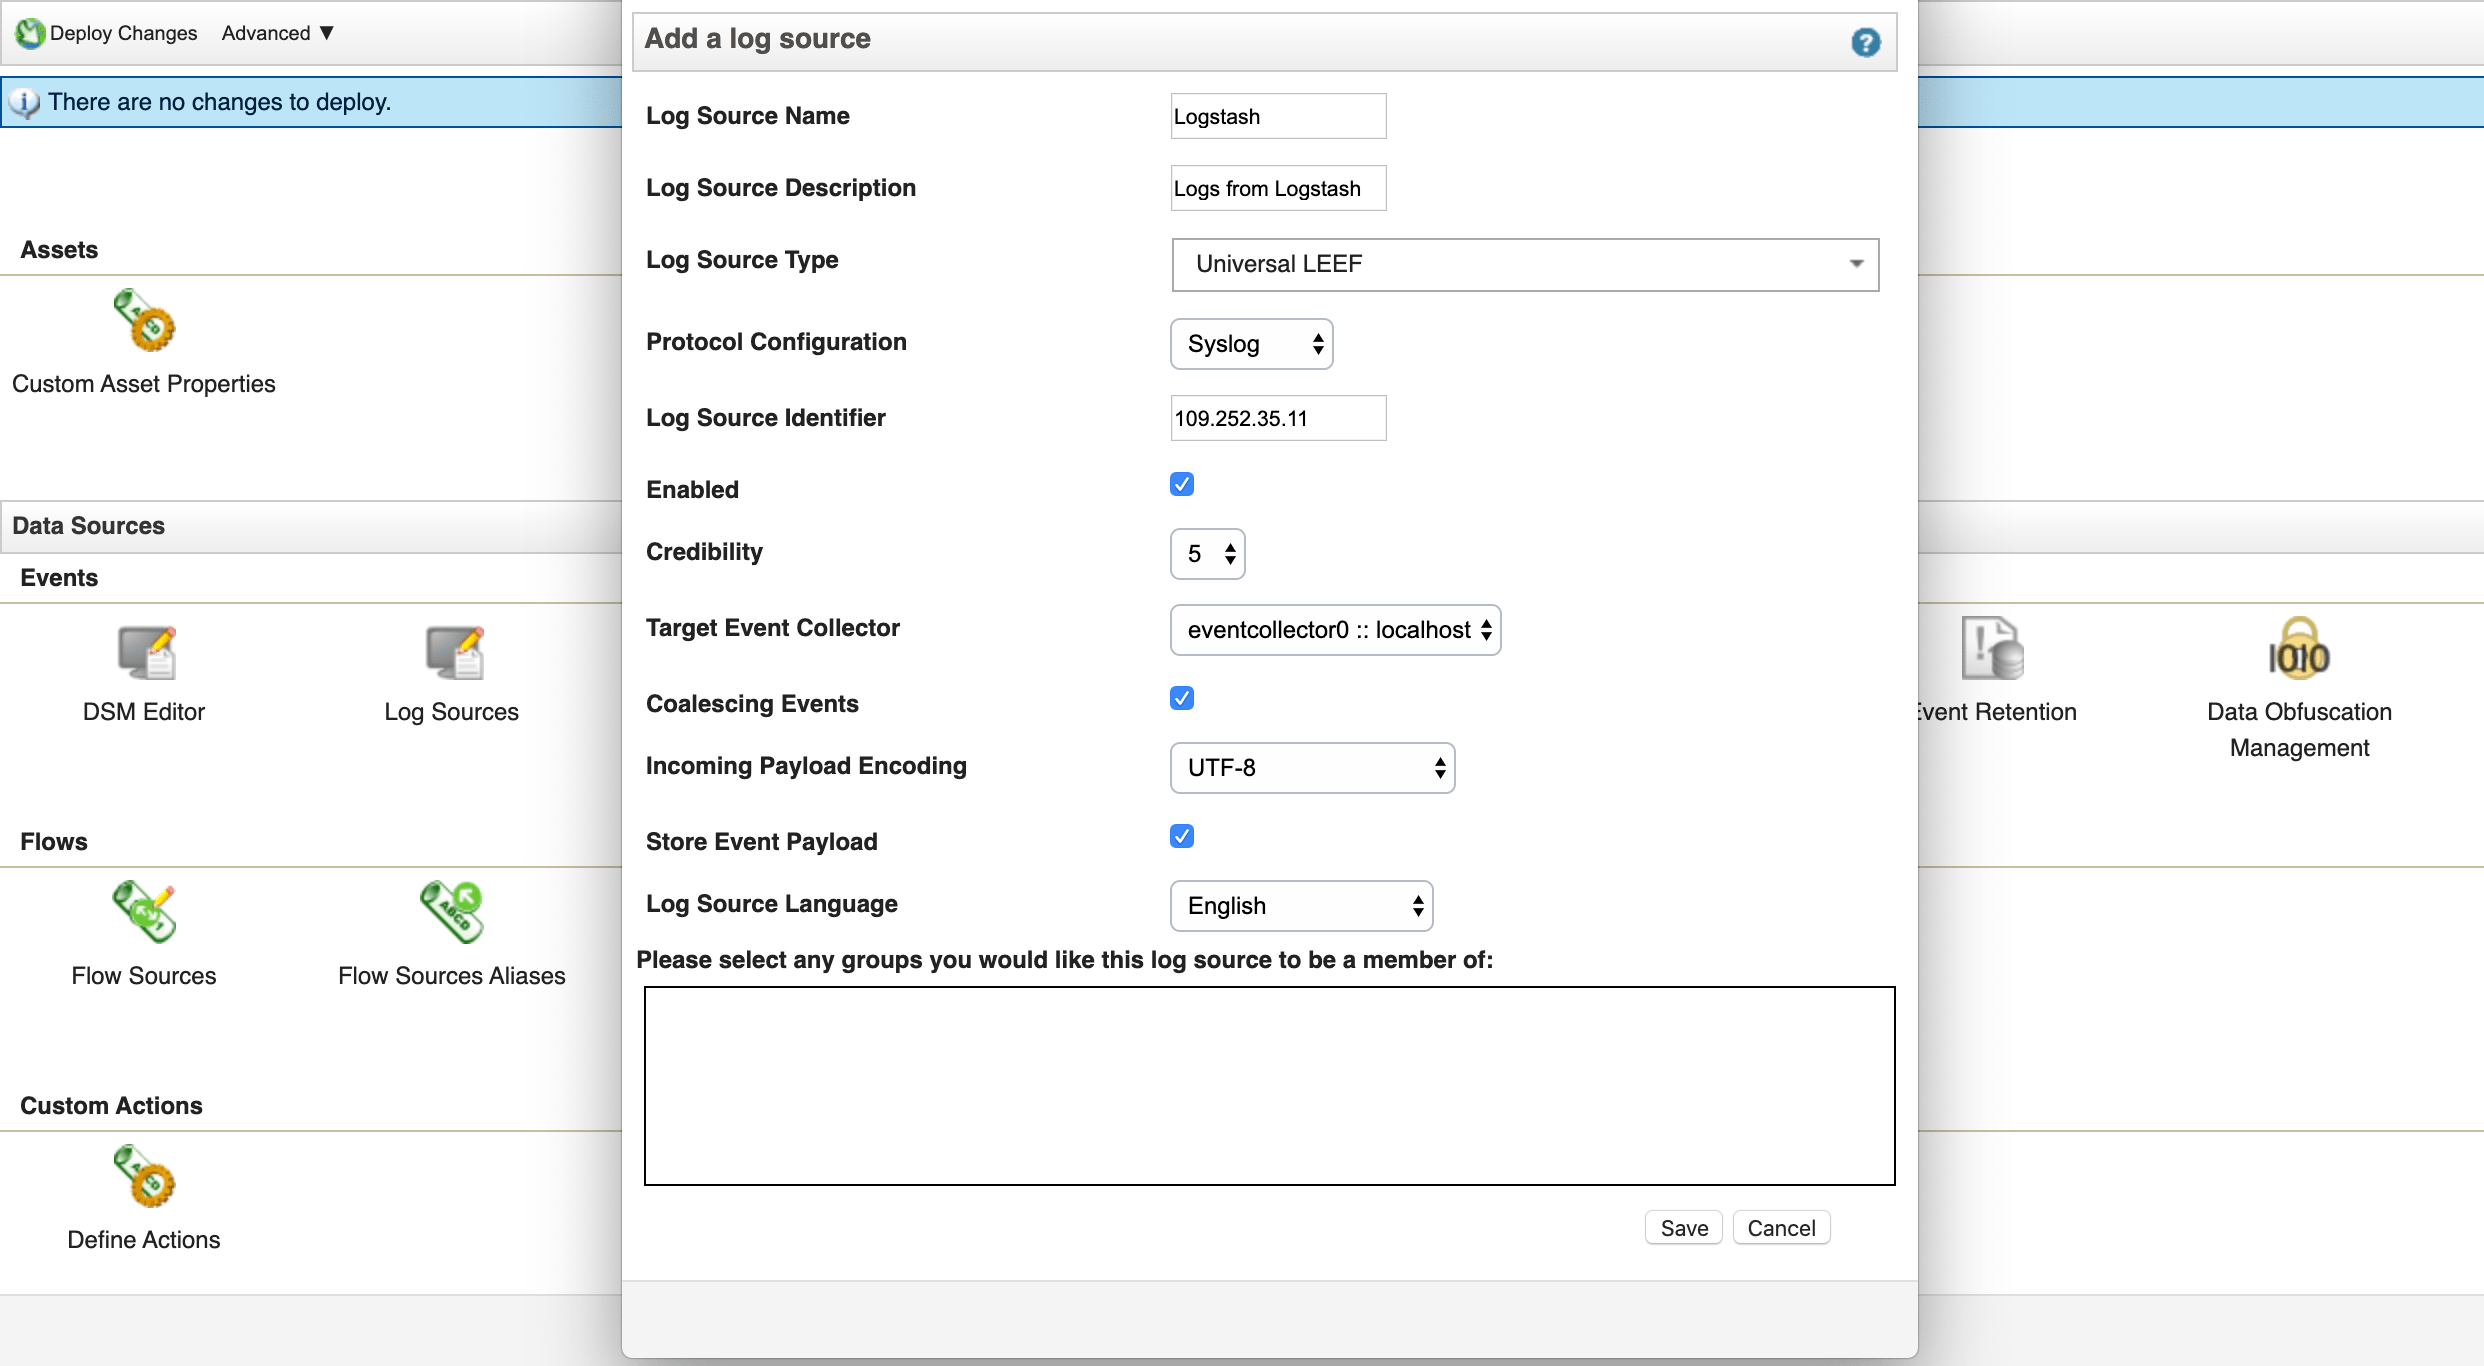
In QRadar, the log source is configured. It helps to easily find Logstash logs in the list of all logs in QRadar, and can also be used for further log filtering. The log source is configured as follows:
-
Log Source Name:
Logstash -
Log Source Description:
Logs from Logstash -
Log Source Type: type of incoming logs parser used with Syslog standard
Universal LEEF -
Protocol Configuration: standard of logs forwarding
Syslog -
Log Source Identifier: Logstash IP address
-
Other default settings
A more detailed description of the QRadar log source setup is available in the official IBM documentation.
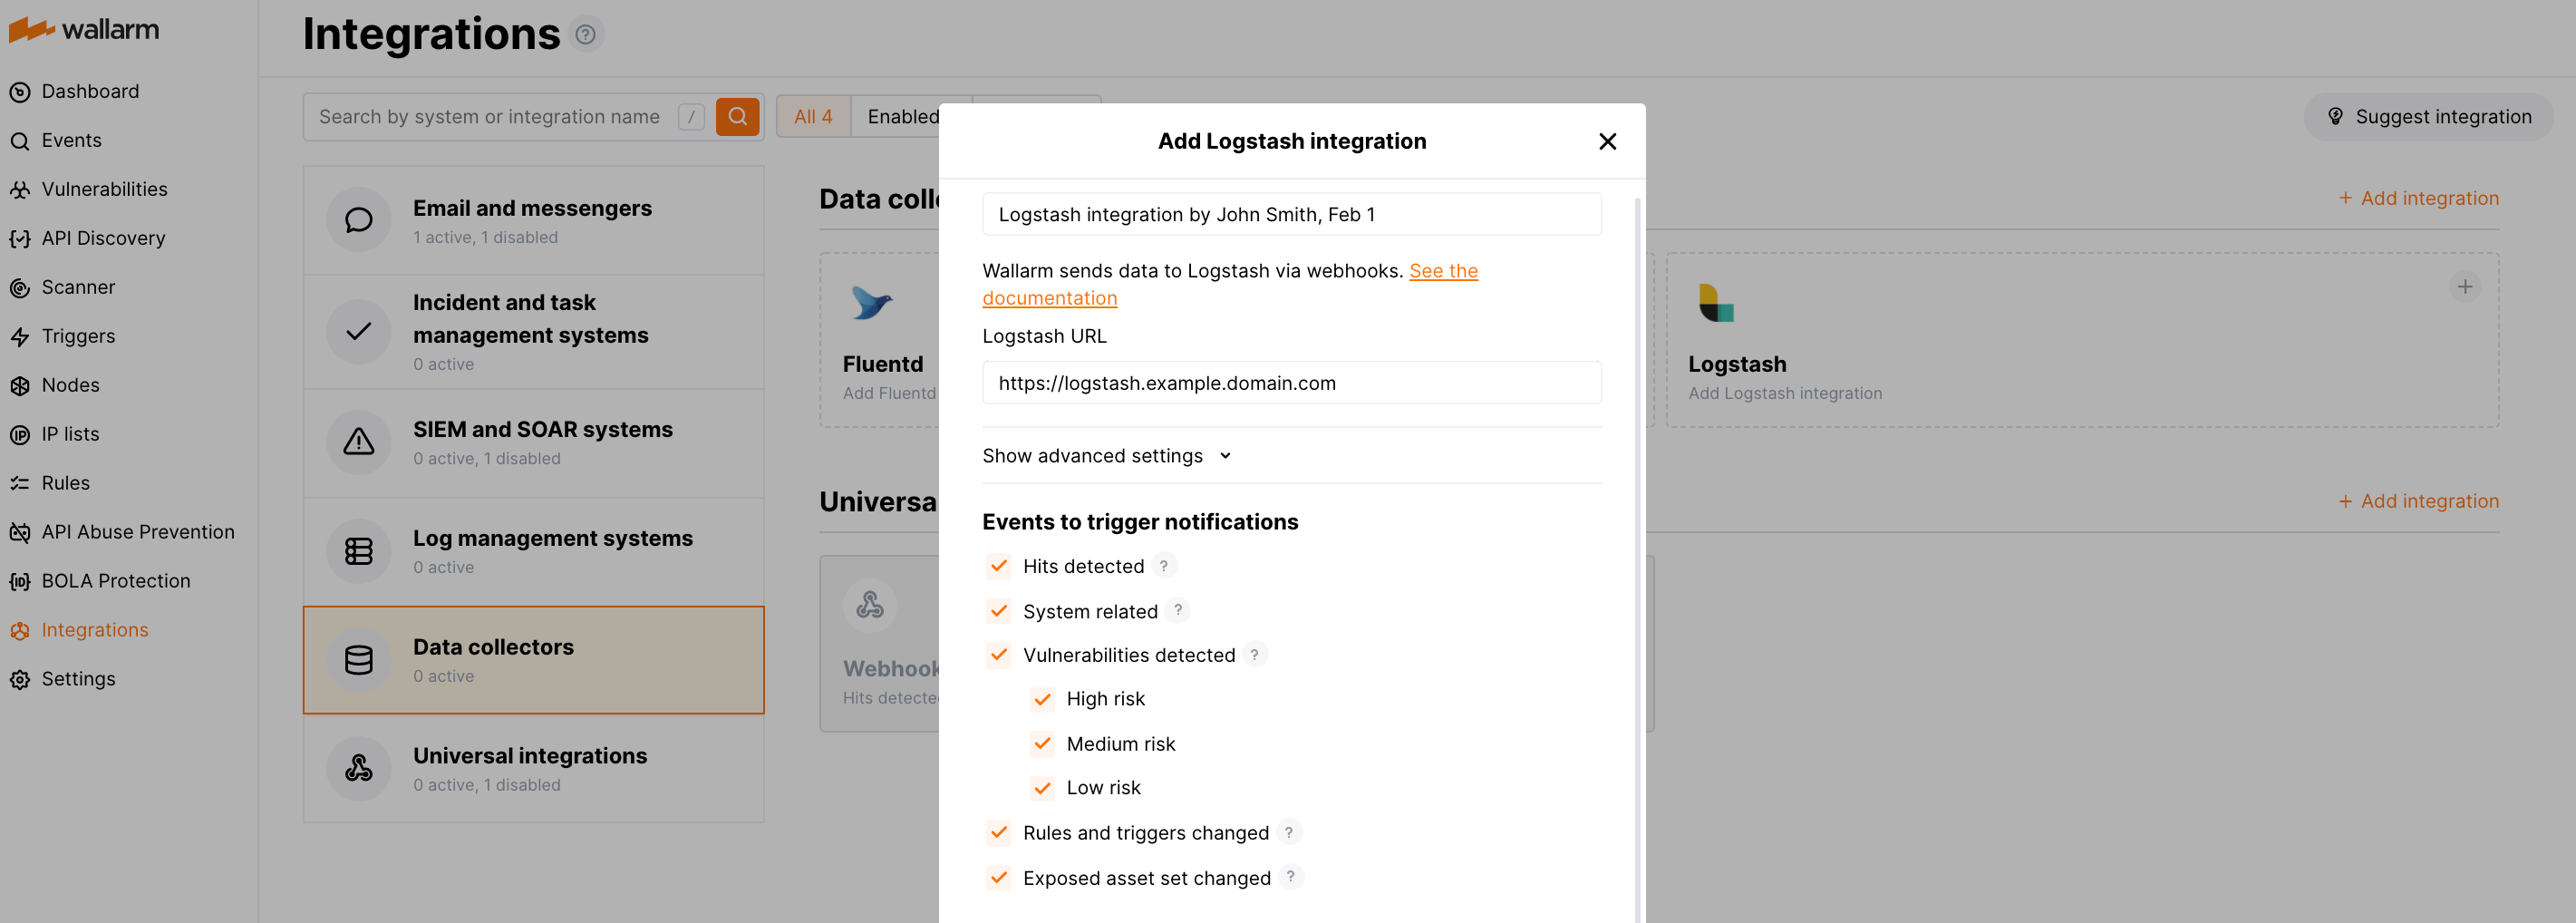
Configuration of Logstash integration
-
Webhooks are sent to
https://logstash.example.domain.com -
Webhooks are sent via POST requests
-
The webhook integration has default advanced settings
-
All available events are sent to the webhook URL: hits, system events, vulnerabilities, scope changes
More details on the Logstash integration configuration
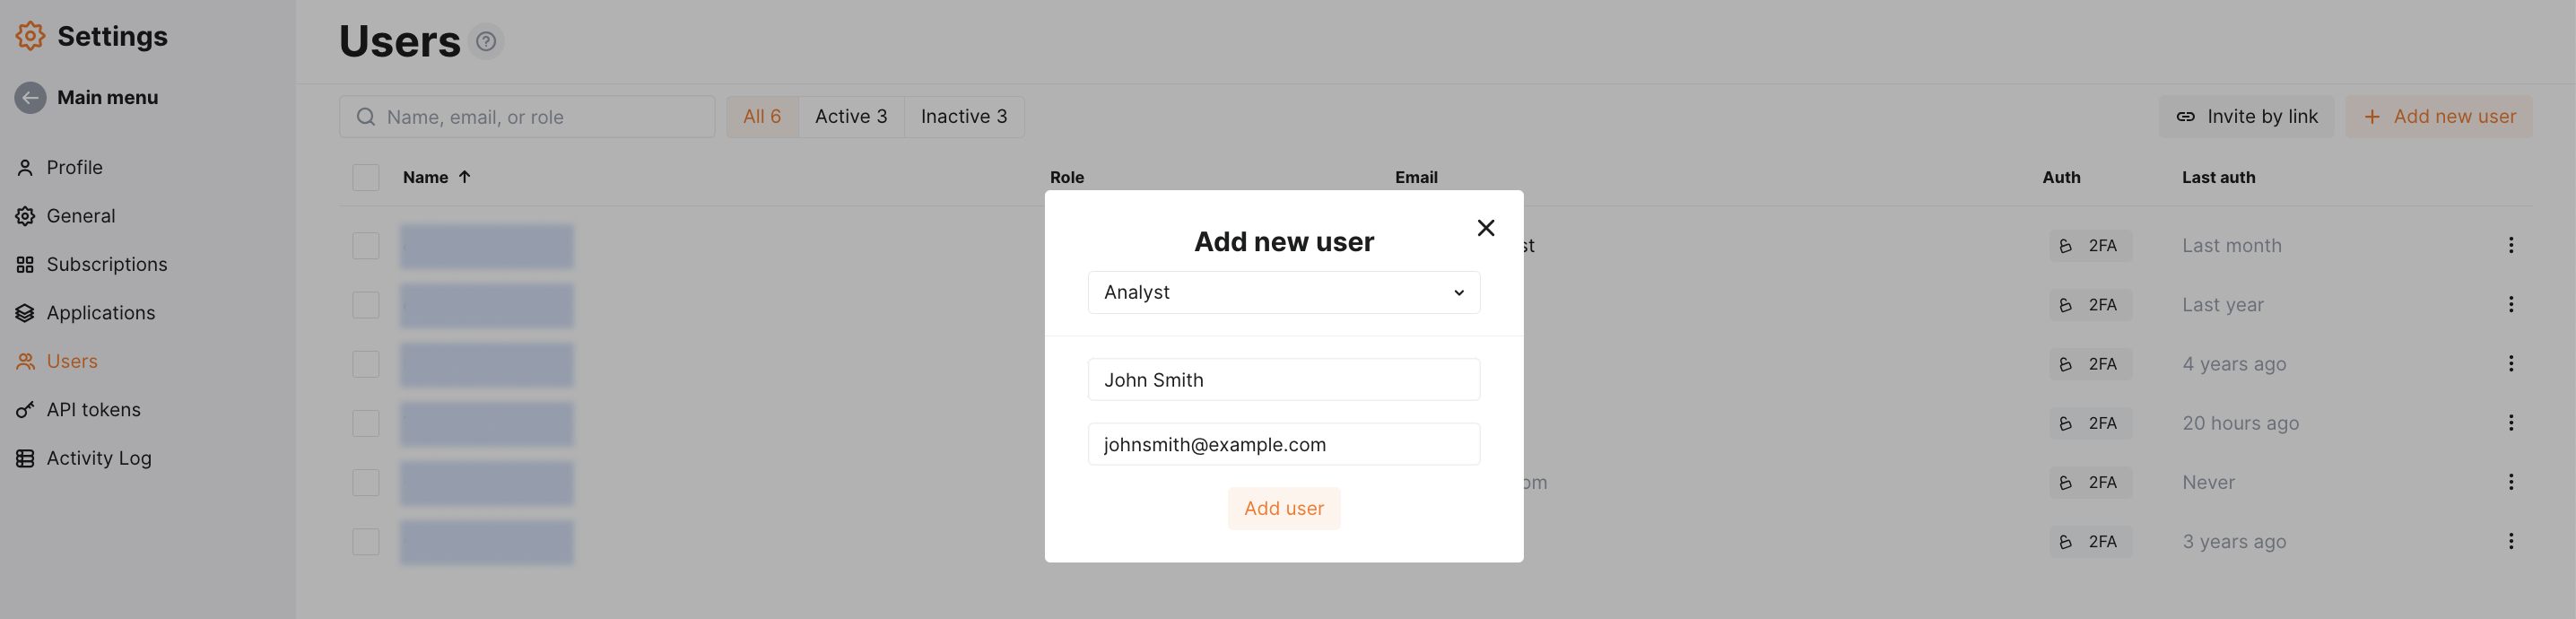
Example testing
To test the configuration, a new user is added in Wallarm Console:
Logstash will log the event as follows:
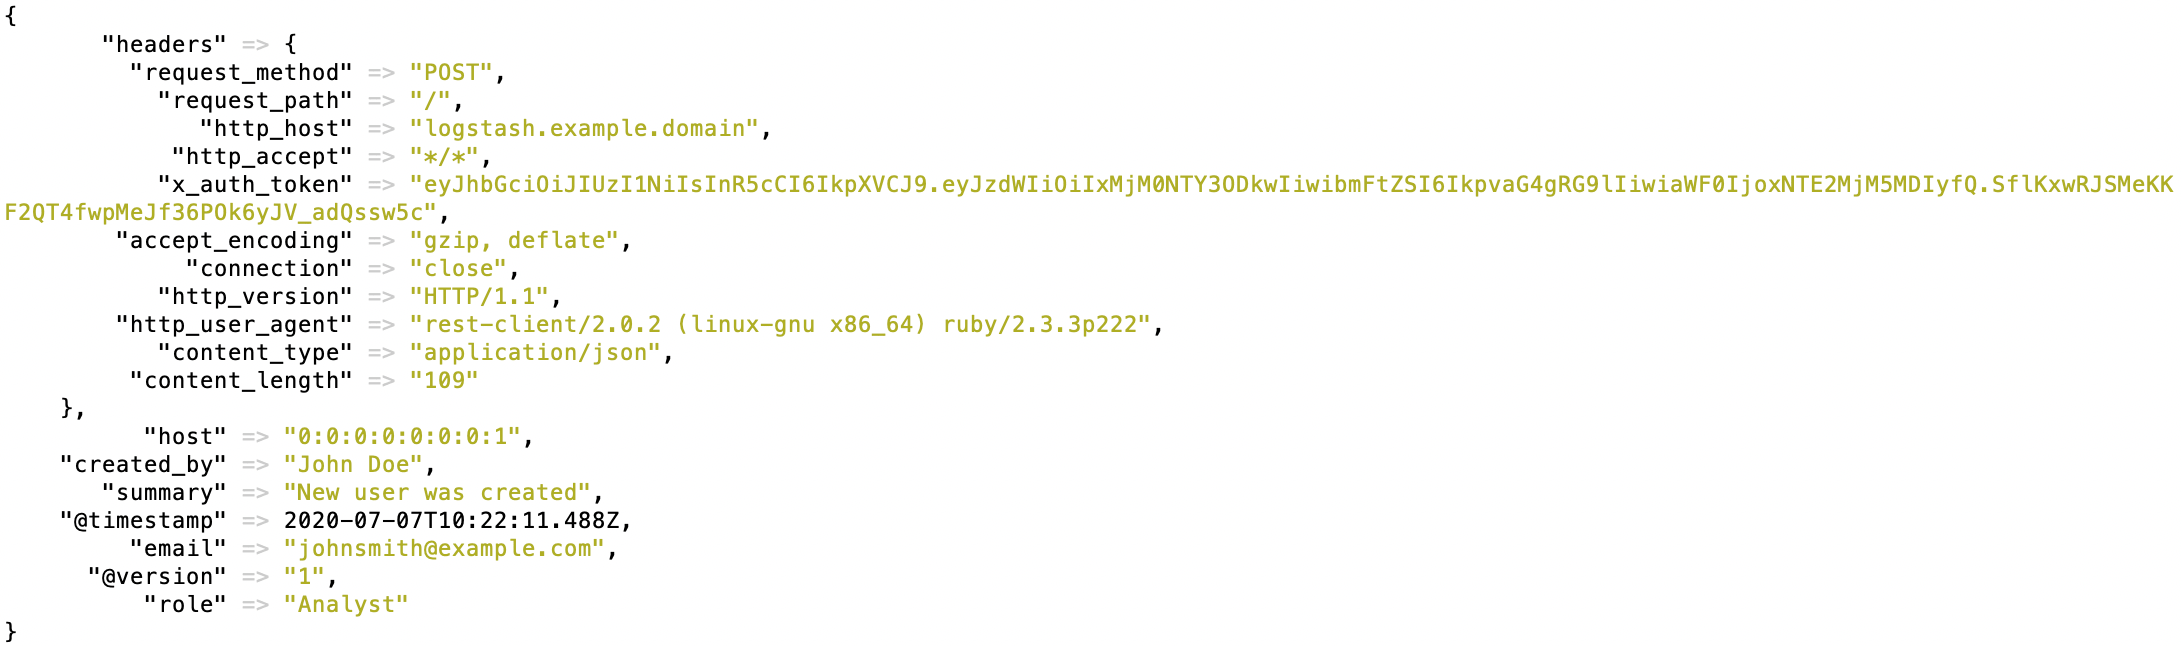
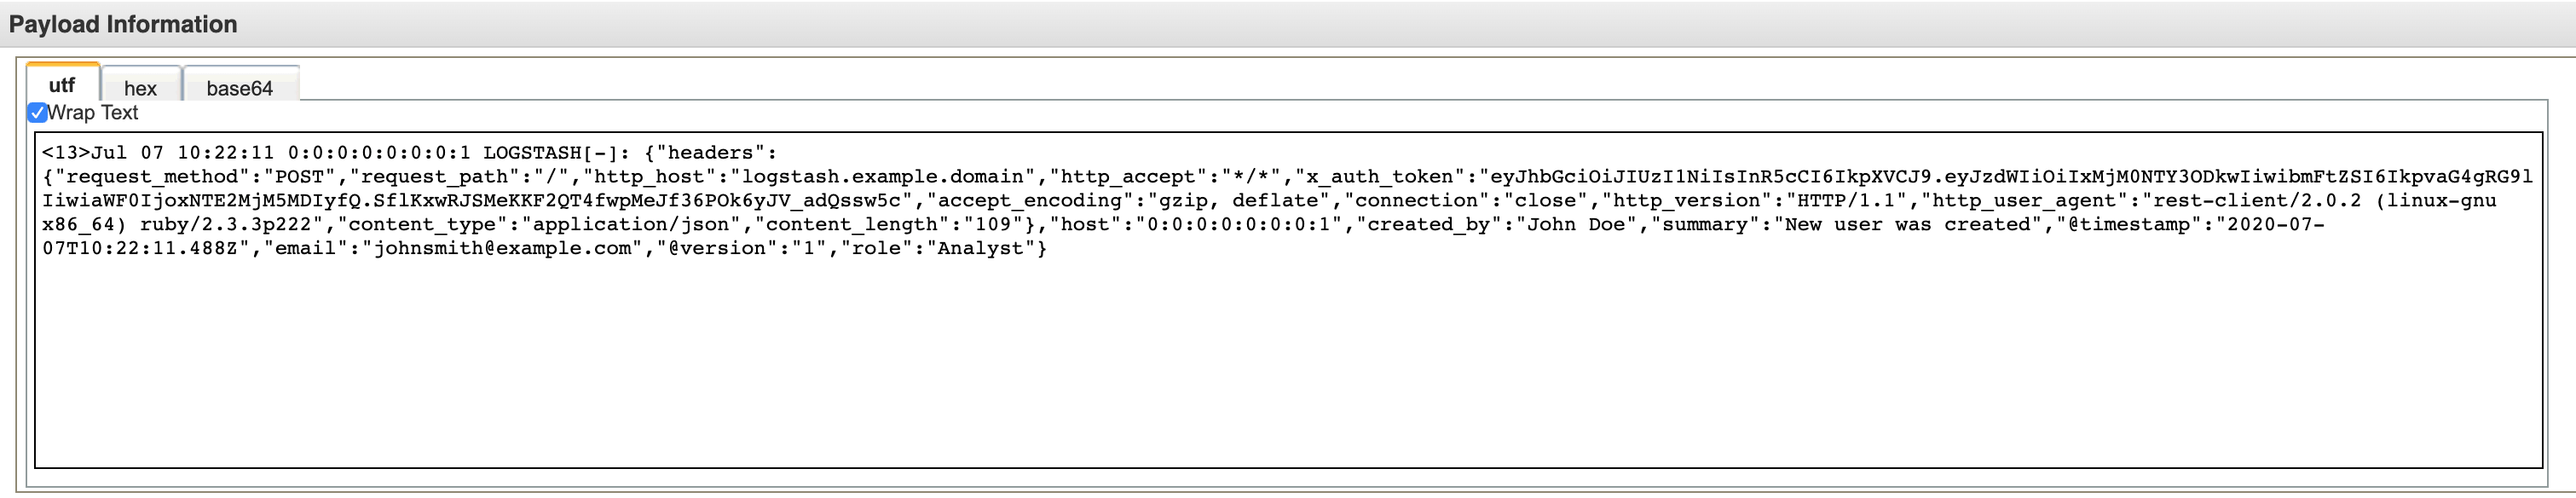
The following data in JSON format will be displayed in the QRadar log payload: