Incident Analysis
An incident is an attack that successfully exploited a security issue in your application. Wallarm detects such an attack but does not block it, because the targeted scope runs in a non-blocking filtration mode. This article explains how to analyze and respond to incidents.
Detection
Wallarm registers incidents through passive detection, which is enabled by default in every active filtering node. When Wallarm detects an attack and the response confirms that the attack succeeded, it concludes that the application has a vulnerability and that an attacker has exploited it — this is an incident.
Key points:
-
Each incident is registered together with the security issue (vulnerability) it exploits. When more incidents exploit the same security issue later, they are all linked to it.
-
Incidents come only from passive detection. Vulnerabilities found by other detection methods do not produce incidents.
Filtration mode
Passive detection relies on both the request and the response, so incidents are registered only for a scope in the monitoring filtration mode.
Importance
An incident marks the jump from a theoretical risk (an open vulnerability) to a live threat, so the security issues behind incidents should be prioritized for fixing:
-
A successfully exploited vulnerability often becomes public knowledge in the attacker community.
-
When one attacker succeeds, others reuse the same method. An incident means your system is a confirmed target.
-
Each incident warrants investigation to identify data loss or other damage.
Incidents page
Wallarm Console displays detected incidents in the Incidents section. The page works like the Attacks section, but it lists only incidents, and it groups them in one fixed way built for investigating them.
The page presents incidents for the selected period:
-
The time range selector limits the data to a period.
-
The filter field narrows the list down to the incidents you are interested in. It uses the same syntax as the Attacks section. See Incident Search and Filters.
-
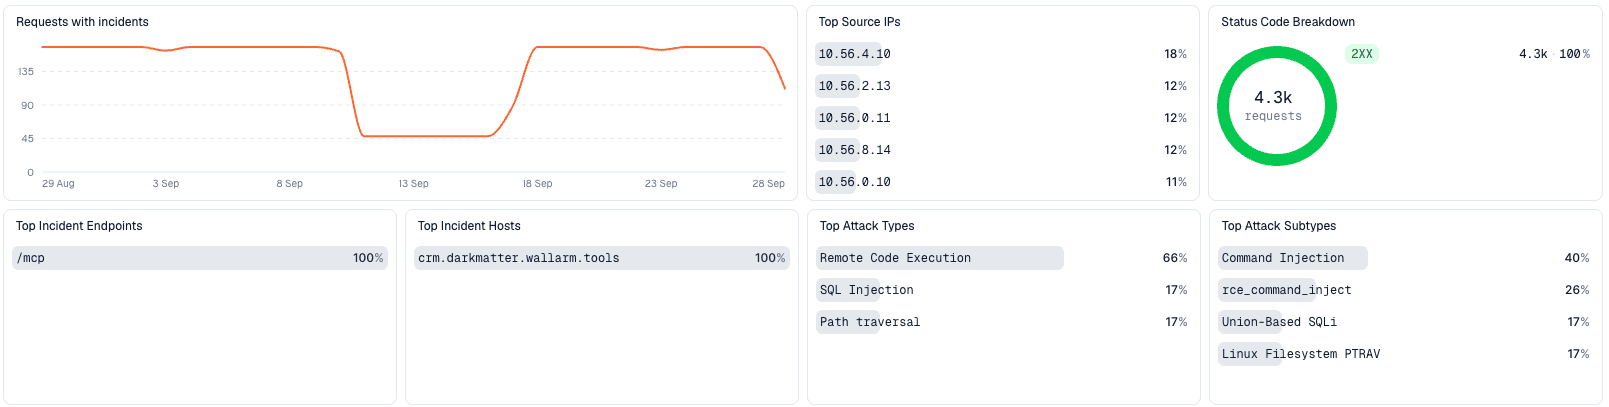
Statistic is a collapsible panel with charts summarizing the filtered incidents: requests with incidents over time, top source IPs, status code breakdown, top incident endpoints and hosts, top attack types and subtypes.
The filter and the time range are stored in the page address. Reloading the page keeps them, and a copied link opens the same list for a colleague.
The table below the panel lists the incidents. Use Table settings to choose and arrange its columns. The Security issues column shows the severity and the state of each security issue that the incident exploits.
To get the data outside of Wallarm Console, export the incidents you currently see as CSV. The export reproduces the filter and the time range. See Creating Reports.
Grouping
The Incidents section always groups incident requests by the following attributes, in this order. Each attribute is a level you open to drill down, and a row at any level summarizes all requests below it:
-
Attack type, for example, SQL Injection.
-
HTTP method.
-
Domain.
-
Path.
-
Parameter: the request point where the malicious payload was found.
Requests that exploit different security issues always stay in separate rows, even when all of the attributes match.
Unlike the Attacks section, the Incidents section has no views and no Group by control.
Incident details
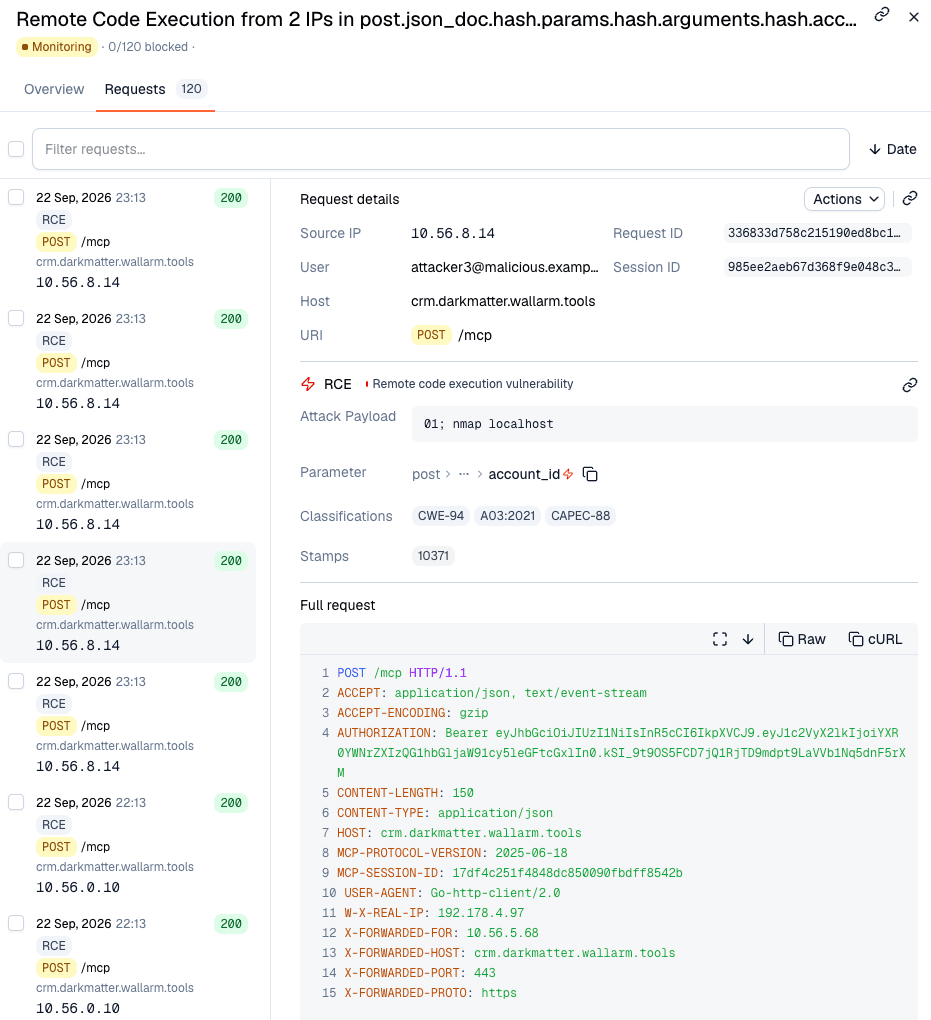
Clicking an incident opens its details in a drawer with the Overview and Requests tabs. The tabs work as described in Attack details.
A single request can carry several attack signs, and only some of them exploit the security issue. In the Requests tab, the request details mark the attack sign that exploited the security issue and show the name of that security issue. Other attack signs of the same request are regular attacks and carry no mark.
Checking incidents via security issues
You can also analyze incidents from the perspective of the security issues they exploit:
-
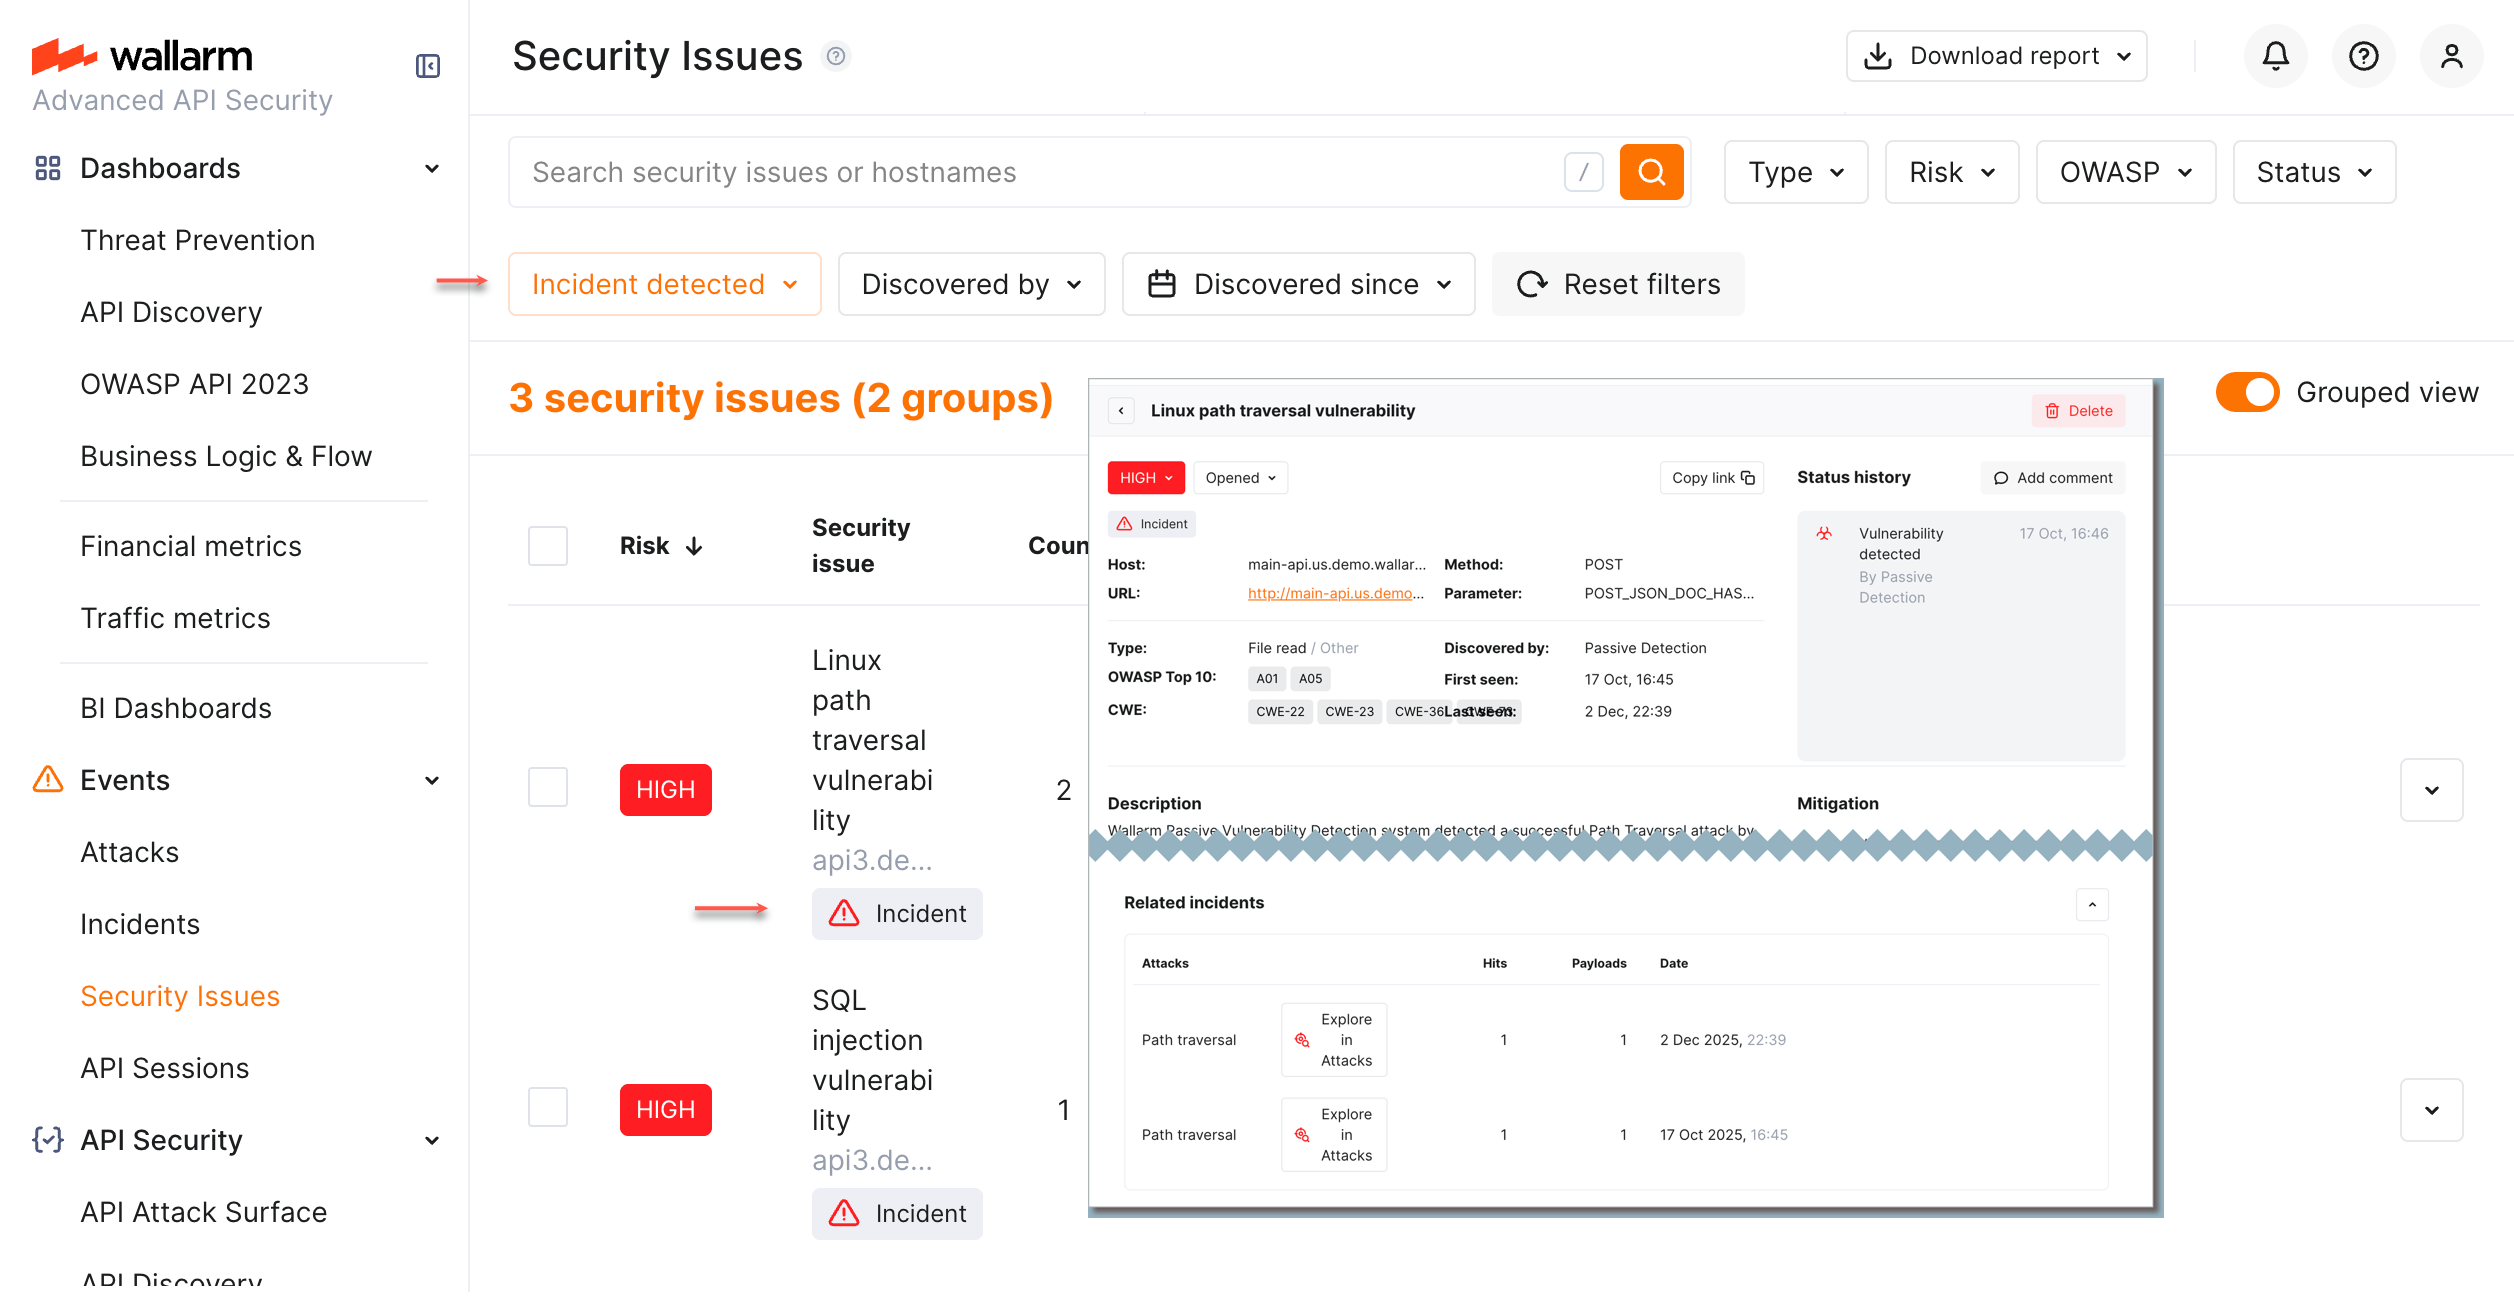
In the Security Issues section, look for issues that have the
Incidenttag in the Security issue column. -
Set the Incident filter to
Incident detectedto list all issues with incidents. Open an issue and view its Related incidents section, from which you can open the details of each incident.
Security issues from other detection methods
The Related incidents section is displayed only for security issues found by passive detection. The details of security issues found by other detection methods do not include this section.
Full context of threat actor activities
Once the malicious request is detected by Wallarm and displayed in the Attacks or Incidents section as the part of some attack, you can see the full context of this request: to which user session it belongs and what the full sequence of requests in this session is. This allows you to investigate all activity of the threat actor to understand attack vectors and what resources can be compromised.
To perform this analysis, in Wallarm Console → Attacks, open the attack, switch to the Requests tab, and select a request. In the request details, open the Session ID field menu and select Investigate this attack in API Sessions.
In Incidents, the request details work the same way: open the incident, switch to the Requests tab, select a request, and use the Session ID field menu.
Wallarm opens the API Sessions section filtered: the session that the initial request belongs to is displayed; only the initial request is displayed within this session.
Remove the filter by request ID to see all other requests in the session: now you have the full picture of what was going on within the session the malicious request belongs to.
Responding to incidents
When an incident appears in the Incidents section, respond to it as follows:
-
Recommended: investigate the full context of the incident's malicious requests — which user session they belong to and the full sequence of requests in that session.
This reveals the threat actor's activity and intent, the attack vectors used, and the resources that could be compromised.
-
Open the security issue (vulnerability) that the incident exploits to see its details, including the list of related incidents (for security issues found by passive detection) and instructions on how to fix the vulnerability. Its severity and state are shown in the Security issues column of the incident list.
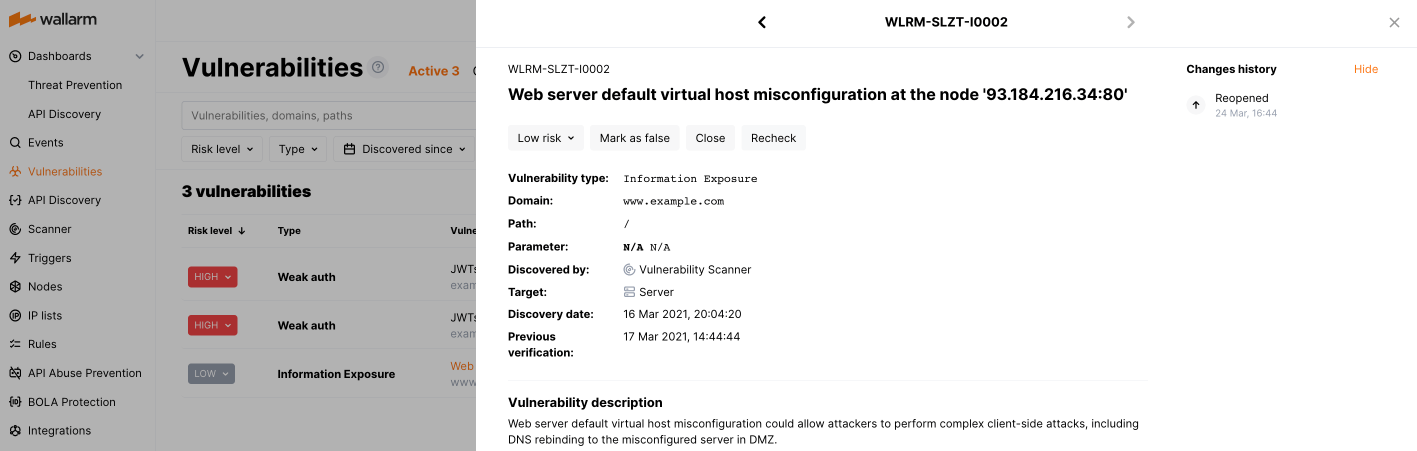
Fix the security issue, then mark it closed in Wallarm. For details, see Managing Security Issues.
-
Return to the incident and investigate the system reaction: check the
Blocked,Partially blocked, andMonitoringstatuses, determine how the system will handle similar requests in the future, and adjust this behavior if necessary.For incidents, you investigate and adjust this behavior in the same way as for any other attack.
API calls to get incidents
Besides using Wallarm Console, you can retrieve incidents by calling the Wallarm API directly. The Incidents section is backed by the same Attacks API as the Attacks section.
To get incidents, call security-agg/query with the incidents preset. It returns only the attacks bound to a security issue, grouped by attack type, and allows the security_issue_ids column with the security issues that each row exploits. The example below returns the incidents of the last 24 hours, sorted by the number of requests.
curl -X POST "https://us1.api.wallarm.com/v1/client/5/attack-vectors/security-agg/query" \
  -H "X-WallarmAPI-Token: YOUR_API_TOKEN" \
  -H "Content-Type: application/json" \
  -d '{
    "preset": "incidents",
    "select": ["attack_types", "requests_count", "security_issue_ids", "hosts"],
    "order_by": [{"field": "requests_count", "desc": true}],
    "time_range": "-24h",
    "limit": 50
  }'
curl -X POST "https://api.wallarm.com/v1/client/5/attack-vectors/security-agg/query" \
  -H "X-WallarmAPI-Token: YOUR_API_TOKEN" \
  -H "Content-Type: application/json" \
  -d '{
    "preset": "incidents",
    "select": ["attack_types", "requests_count", "security_issue_ids", "hosts"],
    "order_by": [{"field": "requests_count", "desc": true}],
    "time_range": "-24h",
    "limit": 50
  }'
Replace 5 with your client_id and YOUR_API_TOKEN with your API token.
Each row of the response is one incident group:
{
  "data": [
    {
      "id": "BASE64_GROUP_ID",
      "attack_type": "rce",
      "attack_types": {"count": 1, "values": ["rce"]},
      "requests_count": 120,
      "security_issue_ids": {"count": 1, "values": [310381]},
      "hosts": {"count": 1, "values": ["api.example.com"]}
    }
  ]
}
To list the requests of an incident group, pass its id to attack-vectors/by-group, as described in Drill into a group.