Exploring Bot Activity  

API Abuse Prevention identifies malicious bot activity based on ML algorithms. Such attacks are impossible to analyze based on a single blocked request. Therefore, it is essential that the Wallarm platform offers a wide range of tools to investigate bot activity from different angles.
API abuse dashboards
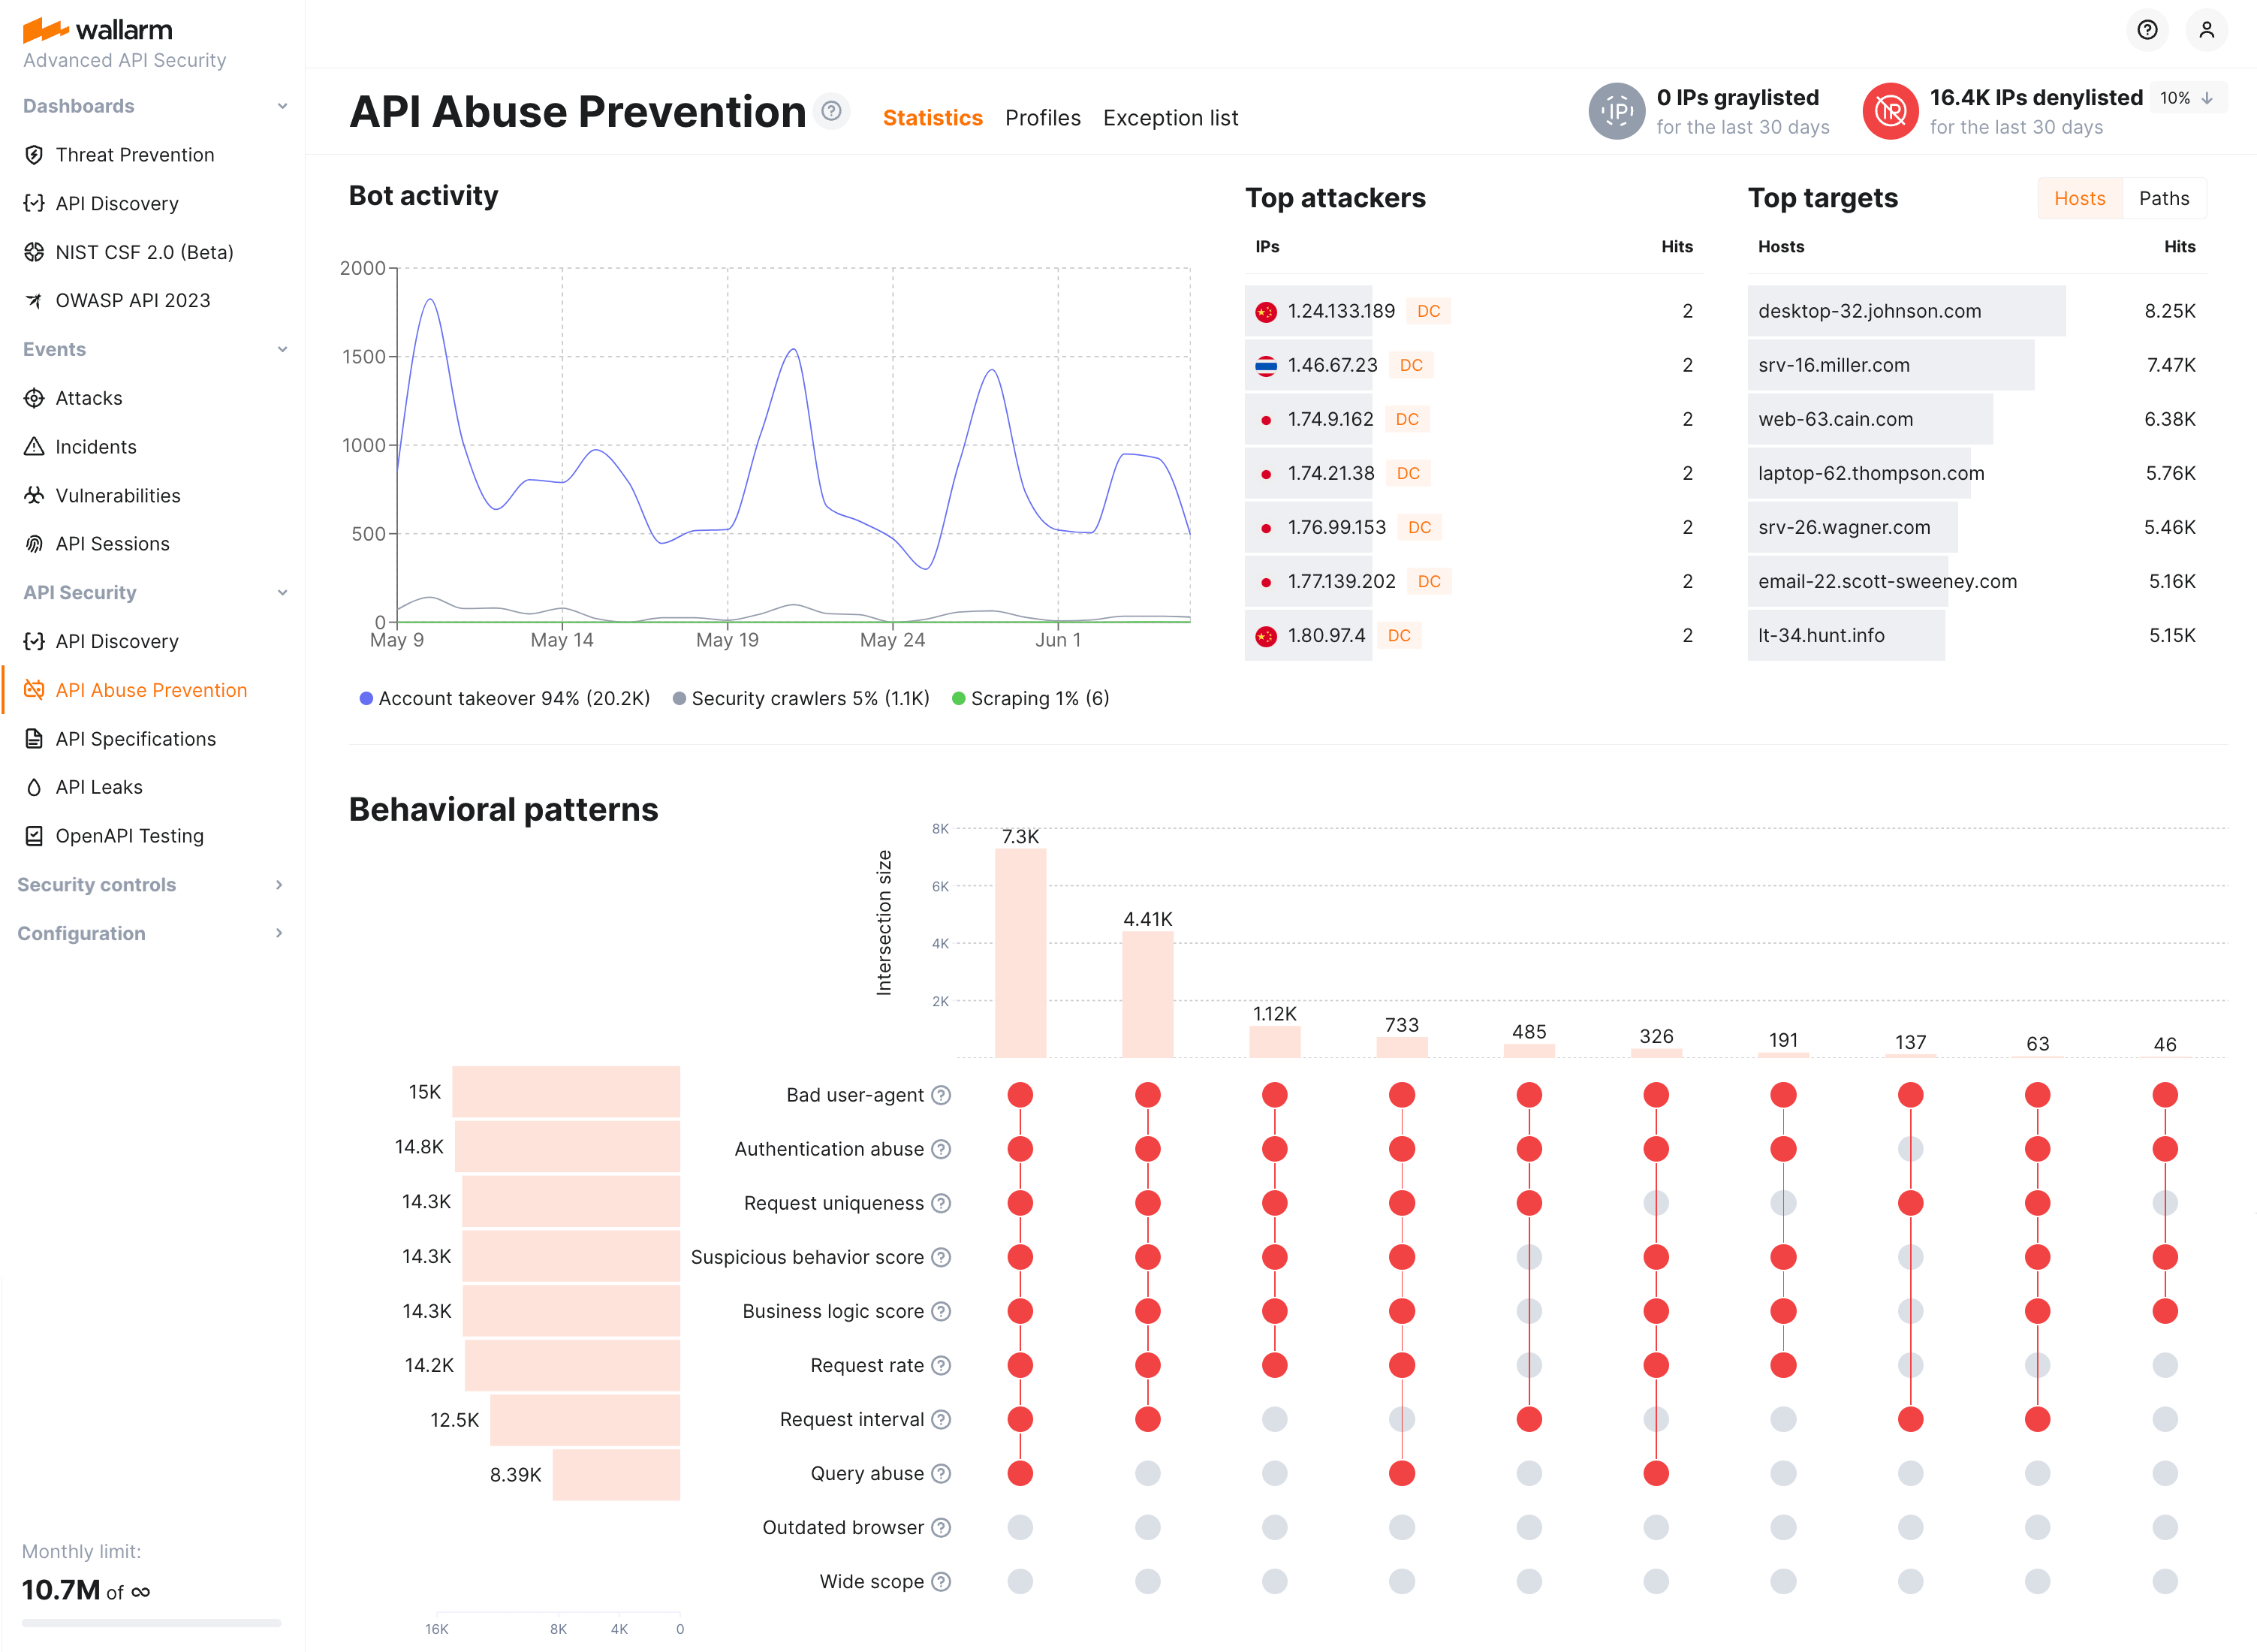
API Abuse Prevention conveniently visualizes the data on bot activities for the last 30 days at the API Abuse Prevention section → Statistics tab. Using the timeline diagram, you can easily identify spikes in bot activity. The additional Top Attackers and Top Targets widgets allow you to determine the most active bots and the most attacked APIs and applications. You can drill down to investigate these bot activities at the Attacks tab in one click on the dashboard element.
You can also analyze bot behaviors at the Behavioral patterns at the bottom. Get detailed information on each detector and how they acted together to determine bot actions. This widget and the counters of deny- or graylisted IPs at the top right will link you to the IP Lists history where you can check when and for what period of time the bot's IP was placed on the blocking list.
If no bot activities were detected, the Legitimate traffic state is displayed:
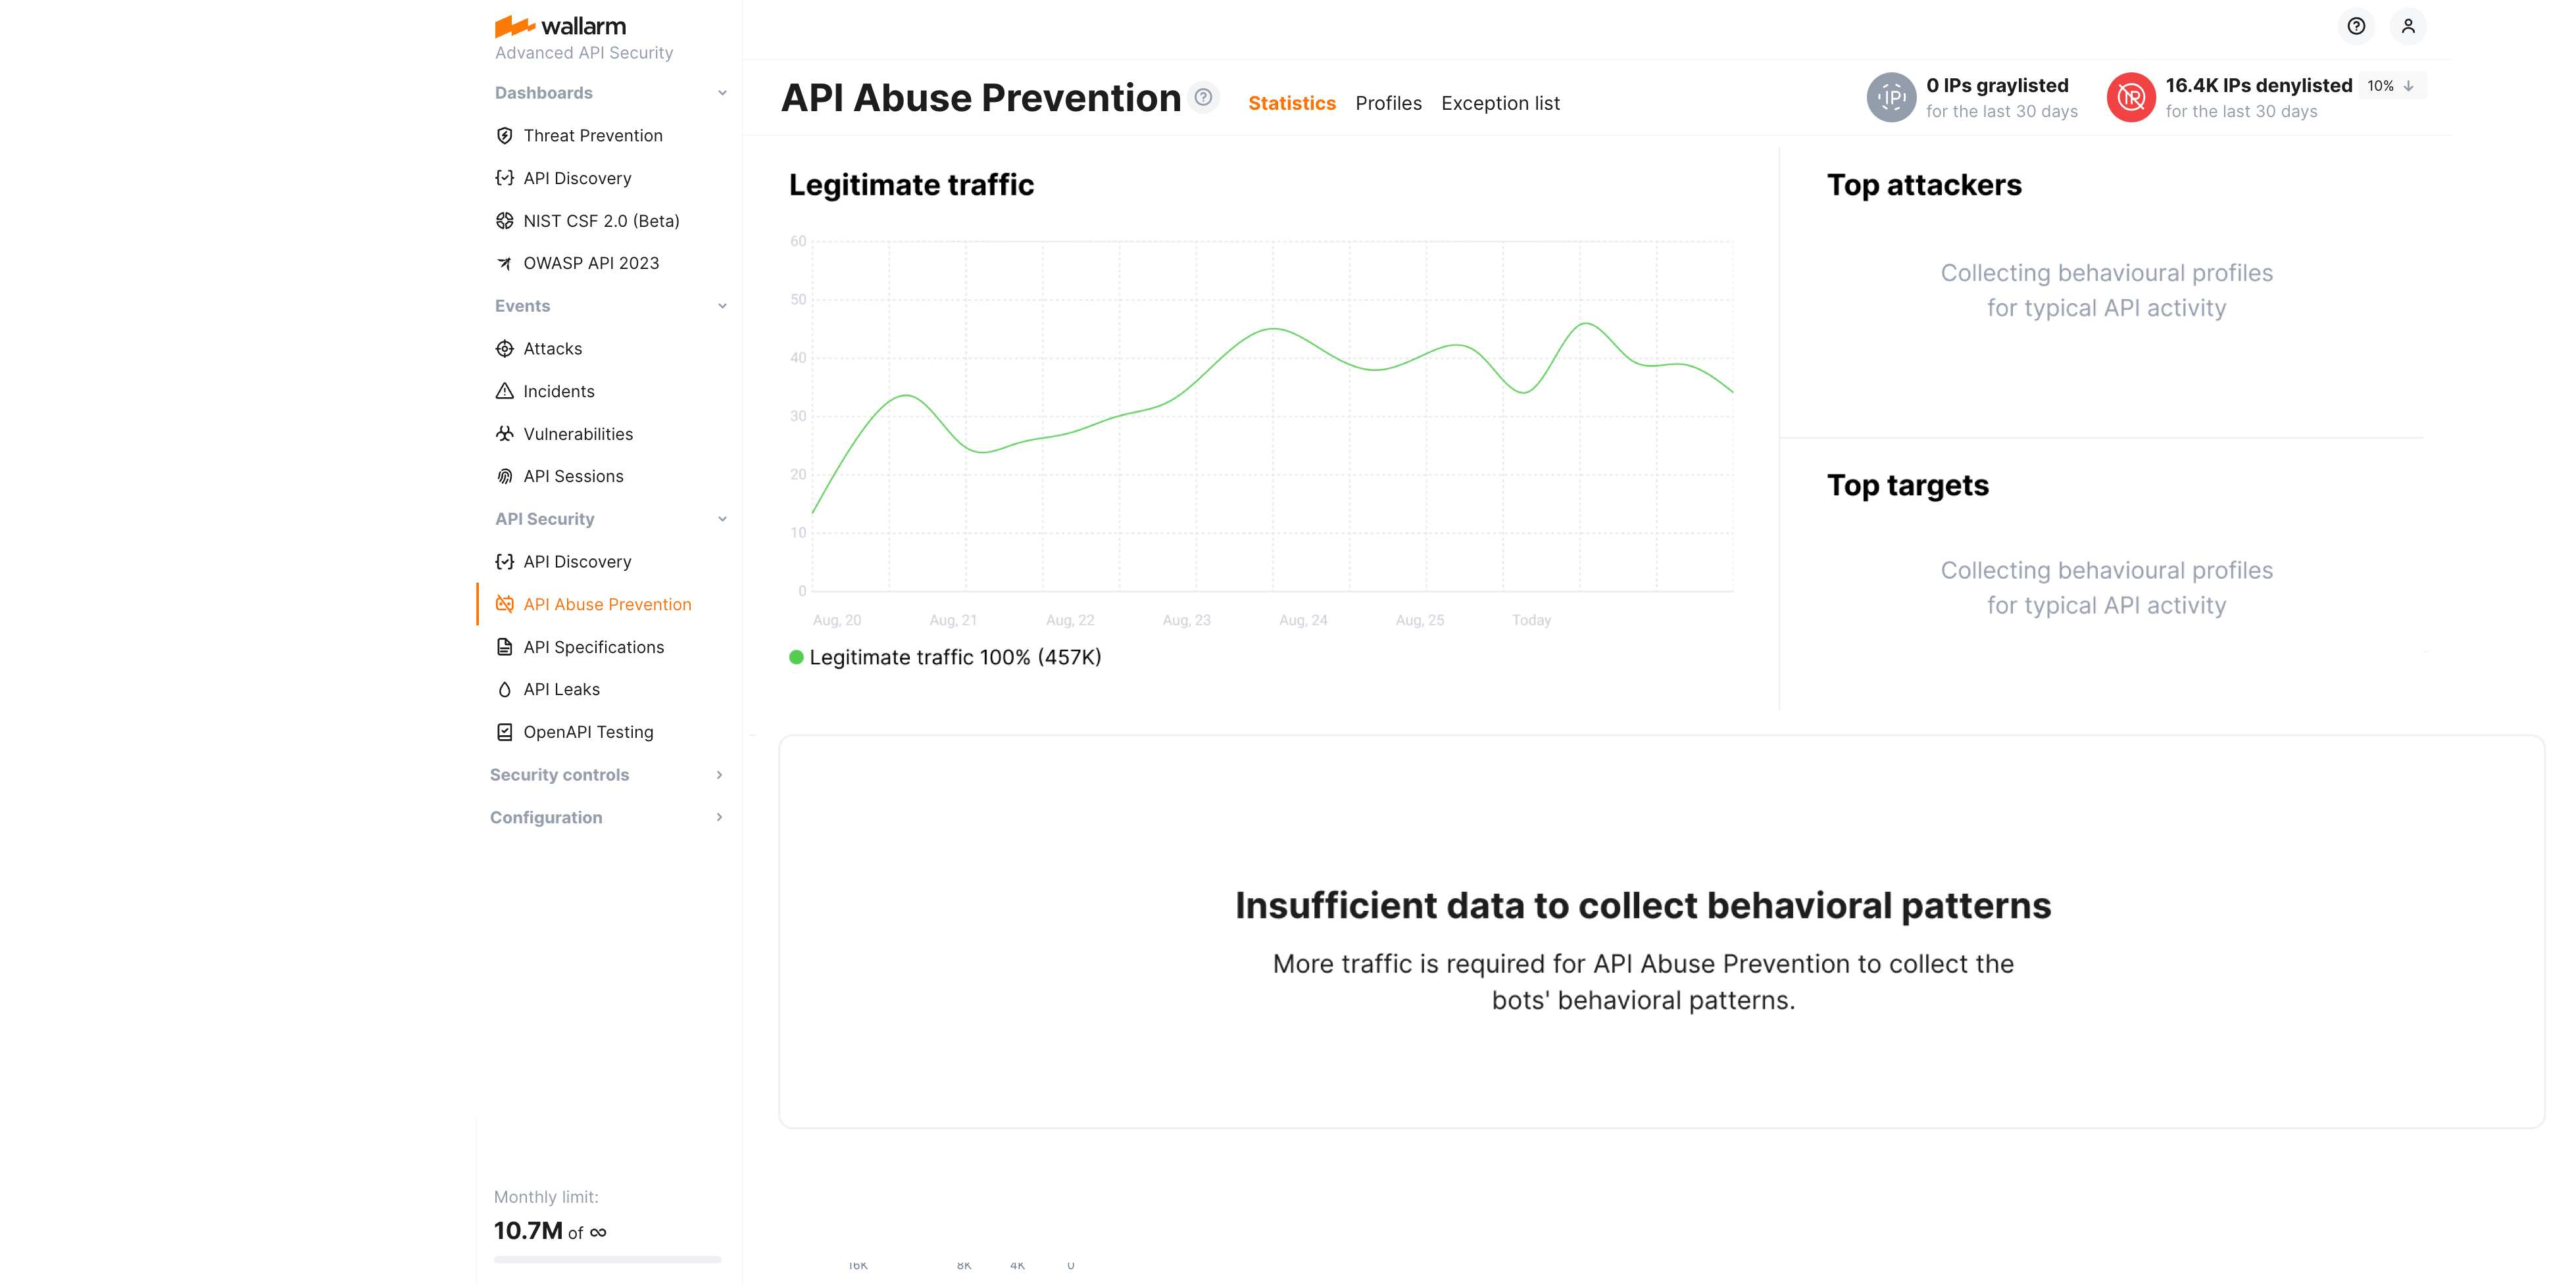
Note that bot detection relies on the traffic - if there is not a sufficient amount of it, API Abuse Prevention notifies about that with the Insufficient data to build statistics message. You can check the per-profile traffic on the Profiles tab.
Attacks
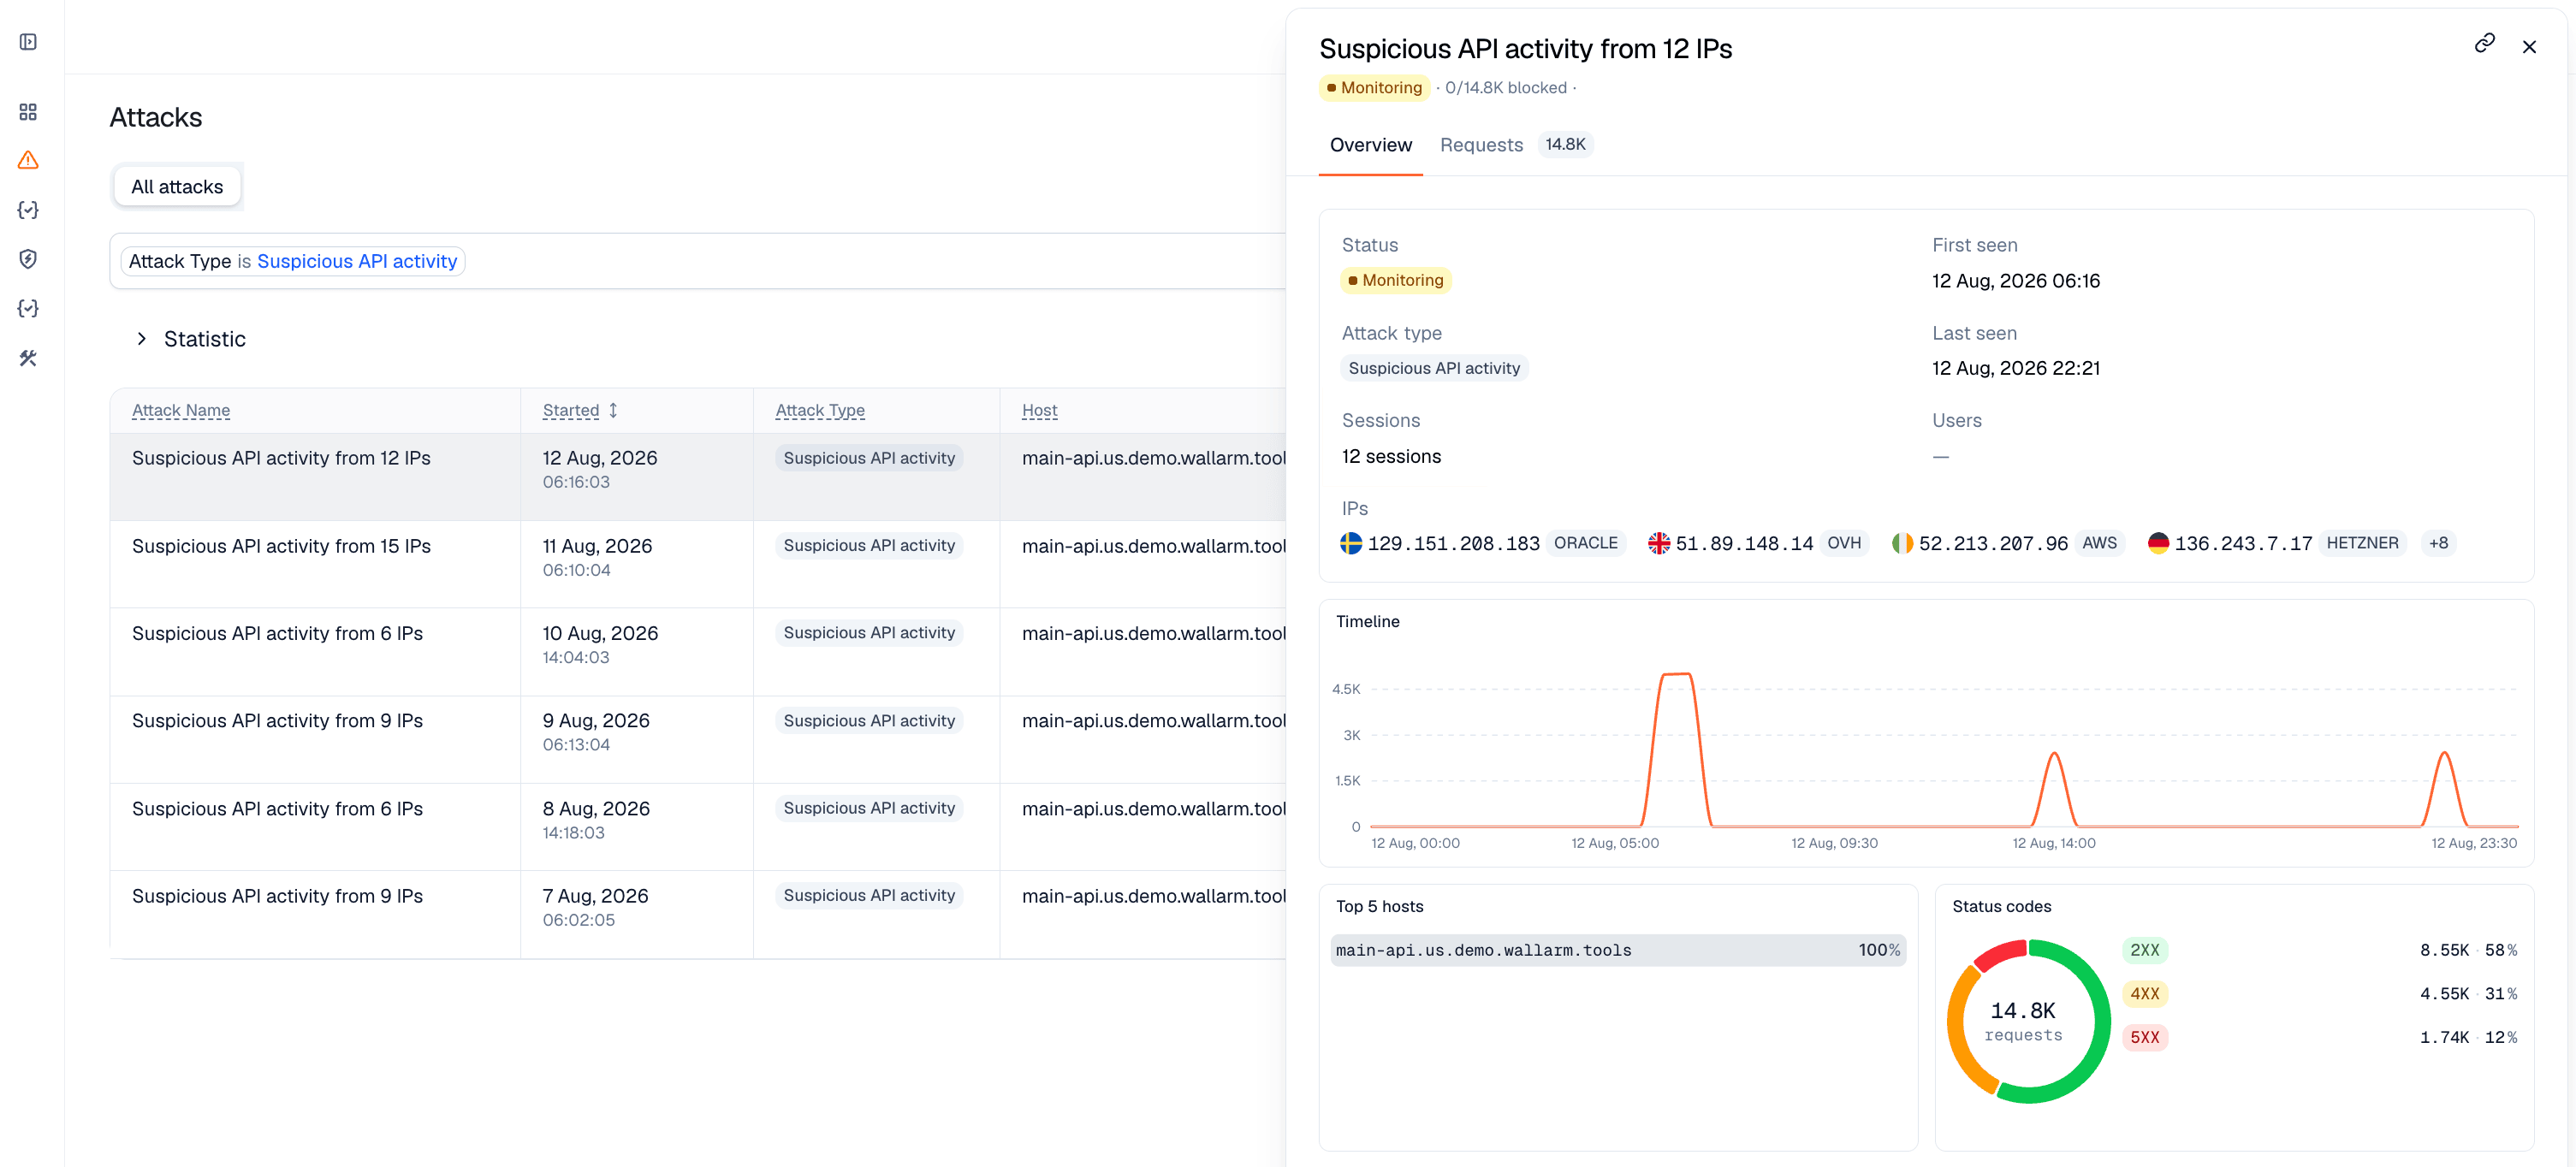
You can explore attacks performed by bots in Wallarm Console → Attacks section. Set the Attack Type filter to Suspicious API activity, Account takeover, Scraping, or Security crawlers.
Note that:
-
Even if the bot IP is placed into the denylist by API Abuse Prevention, by default, Wallarm collects and displays statistics regarding blocked requests originating from it.
-
The detailed information on the bot attack is stored for 31 days: while the attack itself may remain in the Attacks section for a longer time, after 31 days, when you open it, no detector values will be presented -
Not enough datamessage will be displayed instead.
Detector values
Pay attention to the list of triggered detectors and their values, which show how far the source's behavior deviates from the norm for particular anomalies. Each detector row shows the detector name, its measured value, its normal baseline, and how many times the value deviates from that baseline — above or below it, depending on the detector.
The larger this multiplier, the stronger the evidence that the source is a bot.
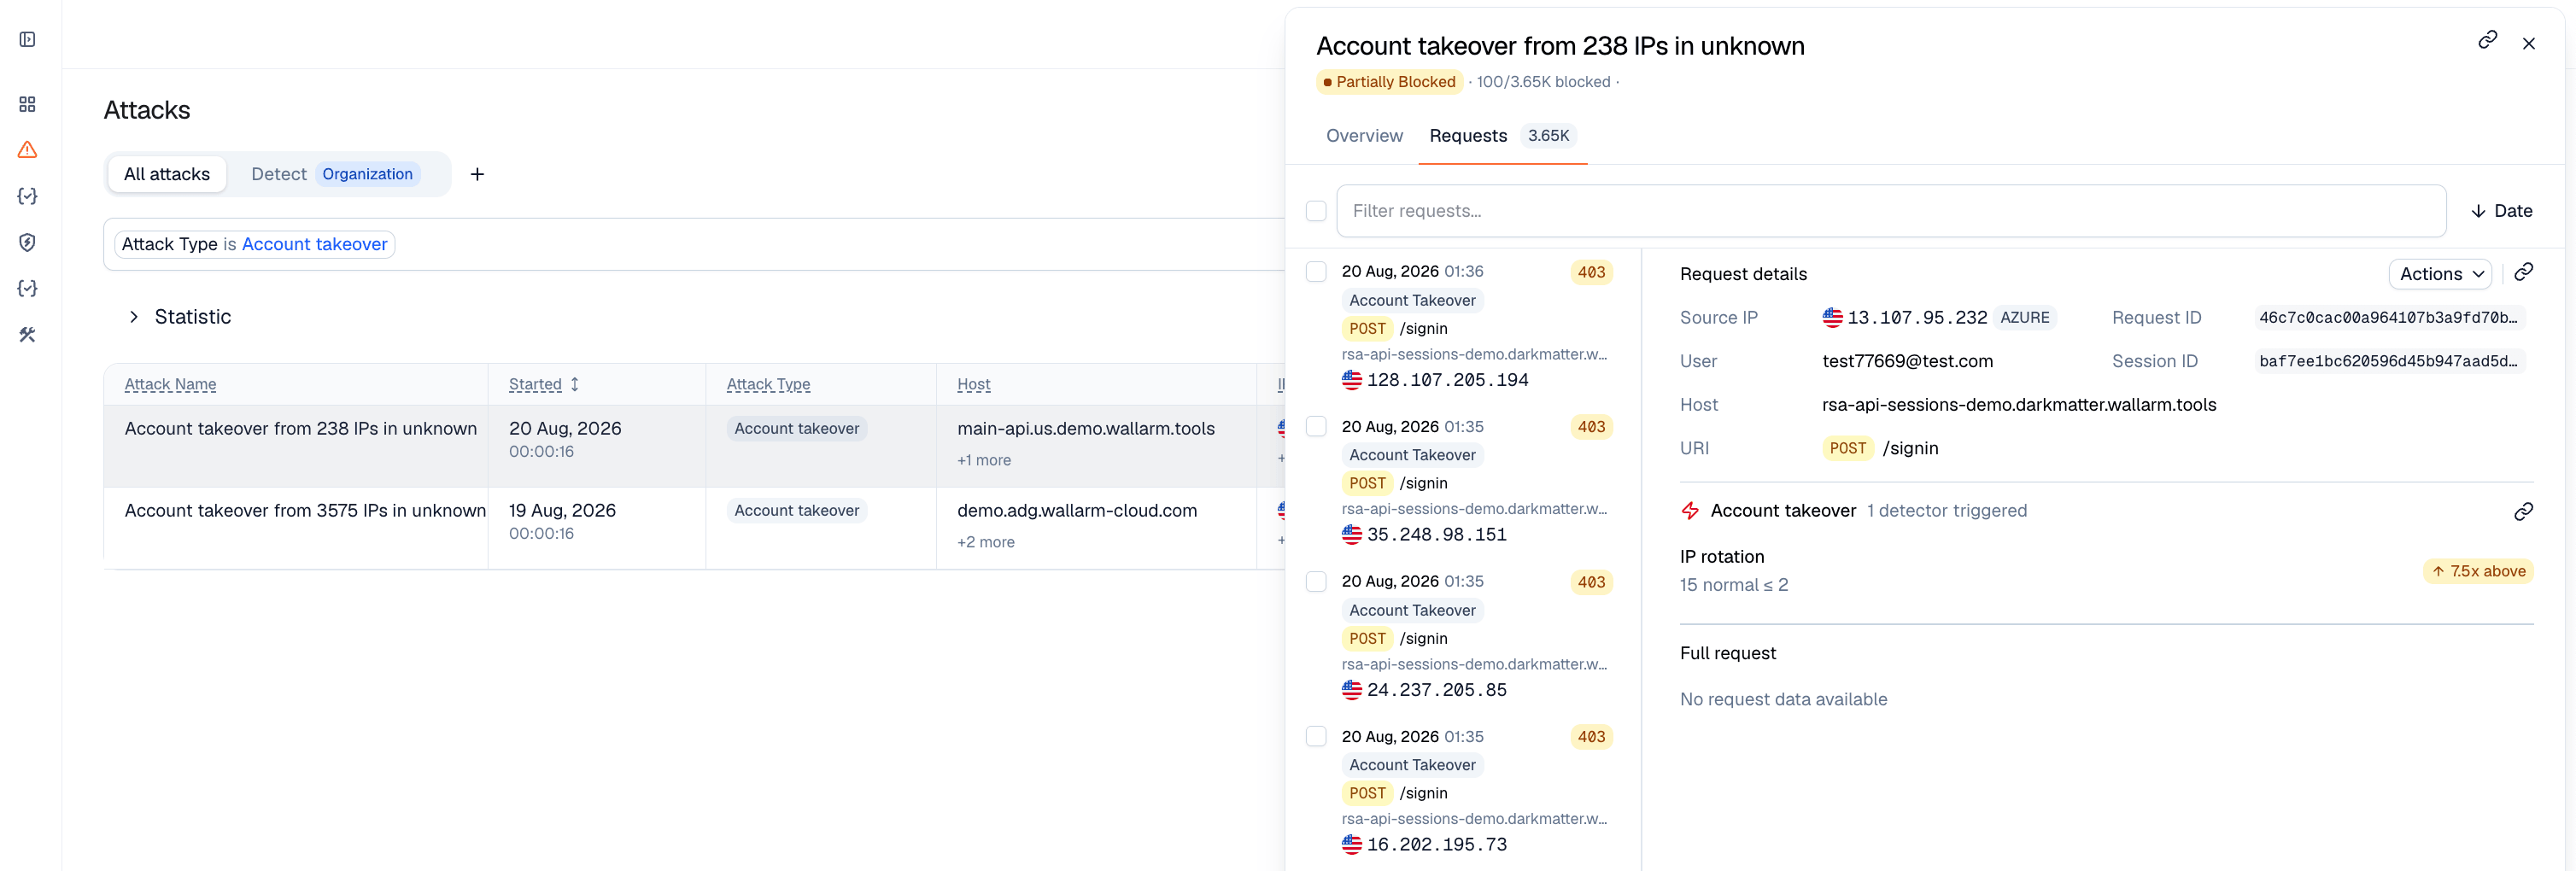
For example, IP rotation with the value 15 when normal is ≤ 2 is 7.5x above the baseline (as on the figure above); Query abuse with 326 when normal is < 10 is over 30x above; and Request interval with 0.05 when normal is > 1 is about 20x below, since for this detector a lower value is the anomaly.
Verifying API abuse detection accuracy with API Sessions
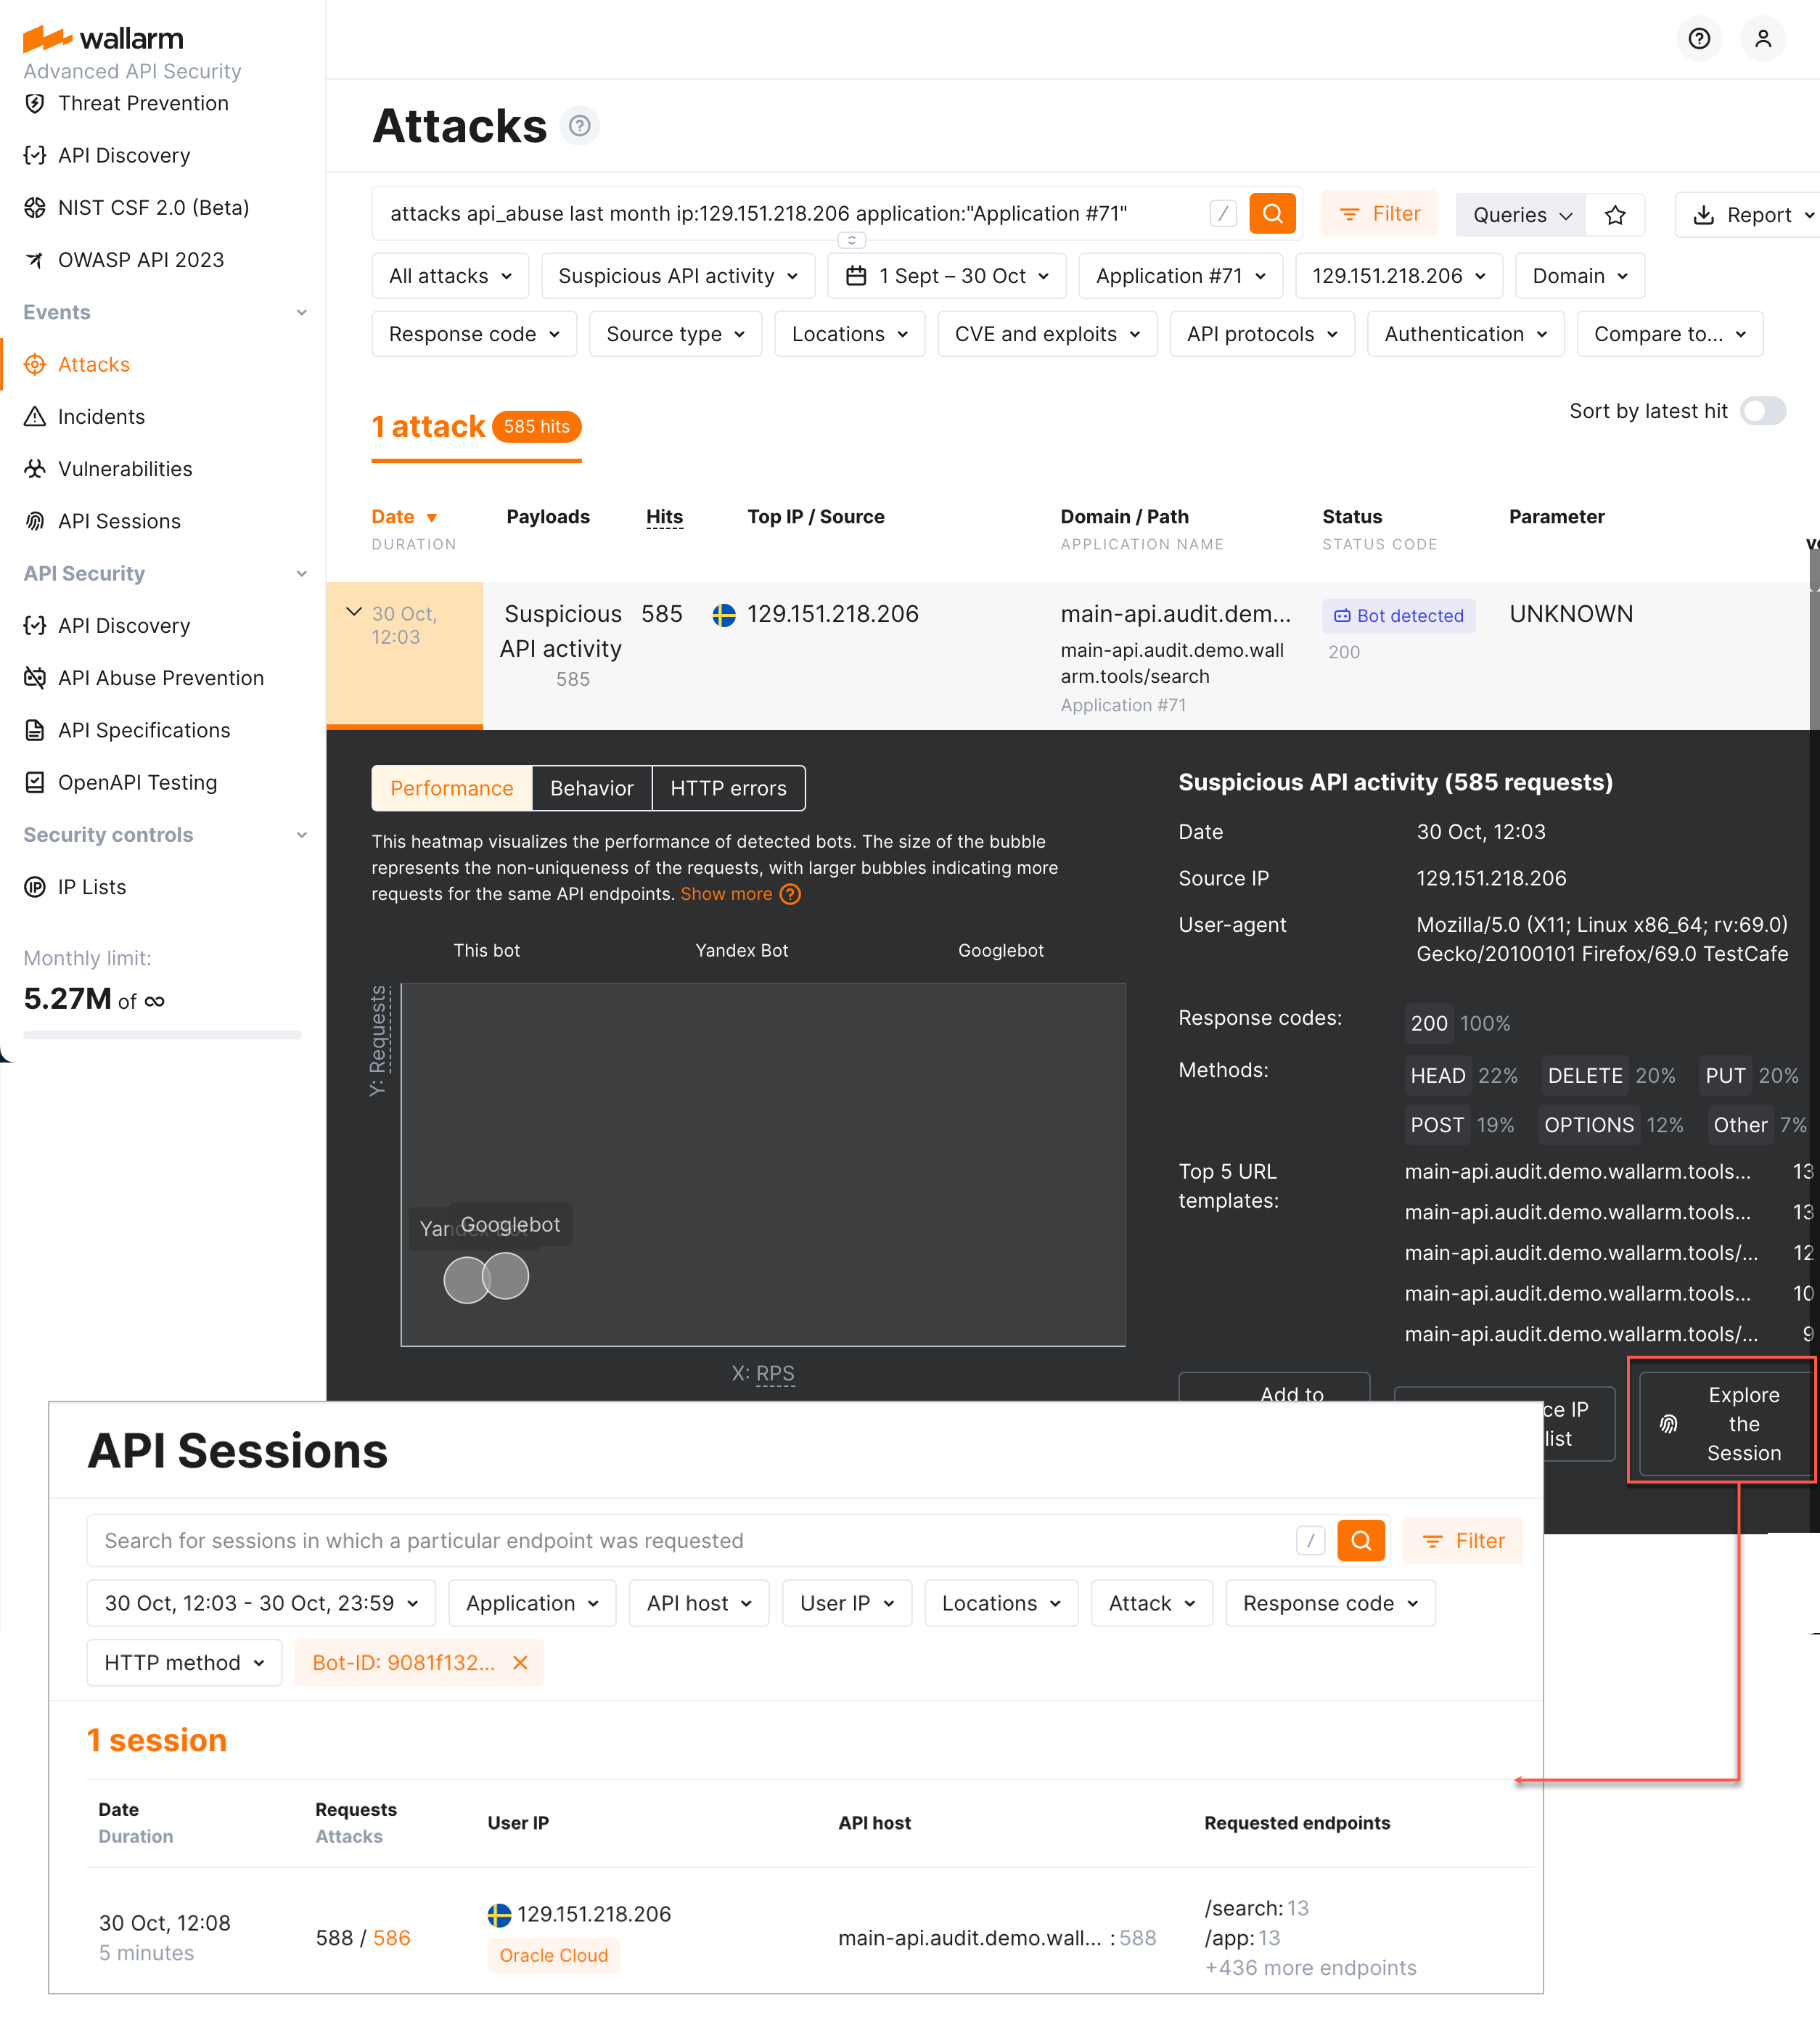
Once the malicious bot activity is detected by Wallarm's API Abuse Prevention and displayed in the Attacks section, you can see the full context of this attack's requests: which user sessions they belong to and what the full sequence of requests in each session is. This helps you investigate the actor's activity and verify whether marking it as a malicious bot was correct.
A single bot attack often spans several user sessions: the requests grouped into it come from different sessions, and the attack overview shows how many sessions are involved.
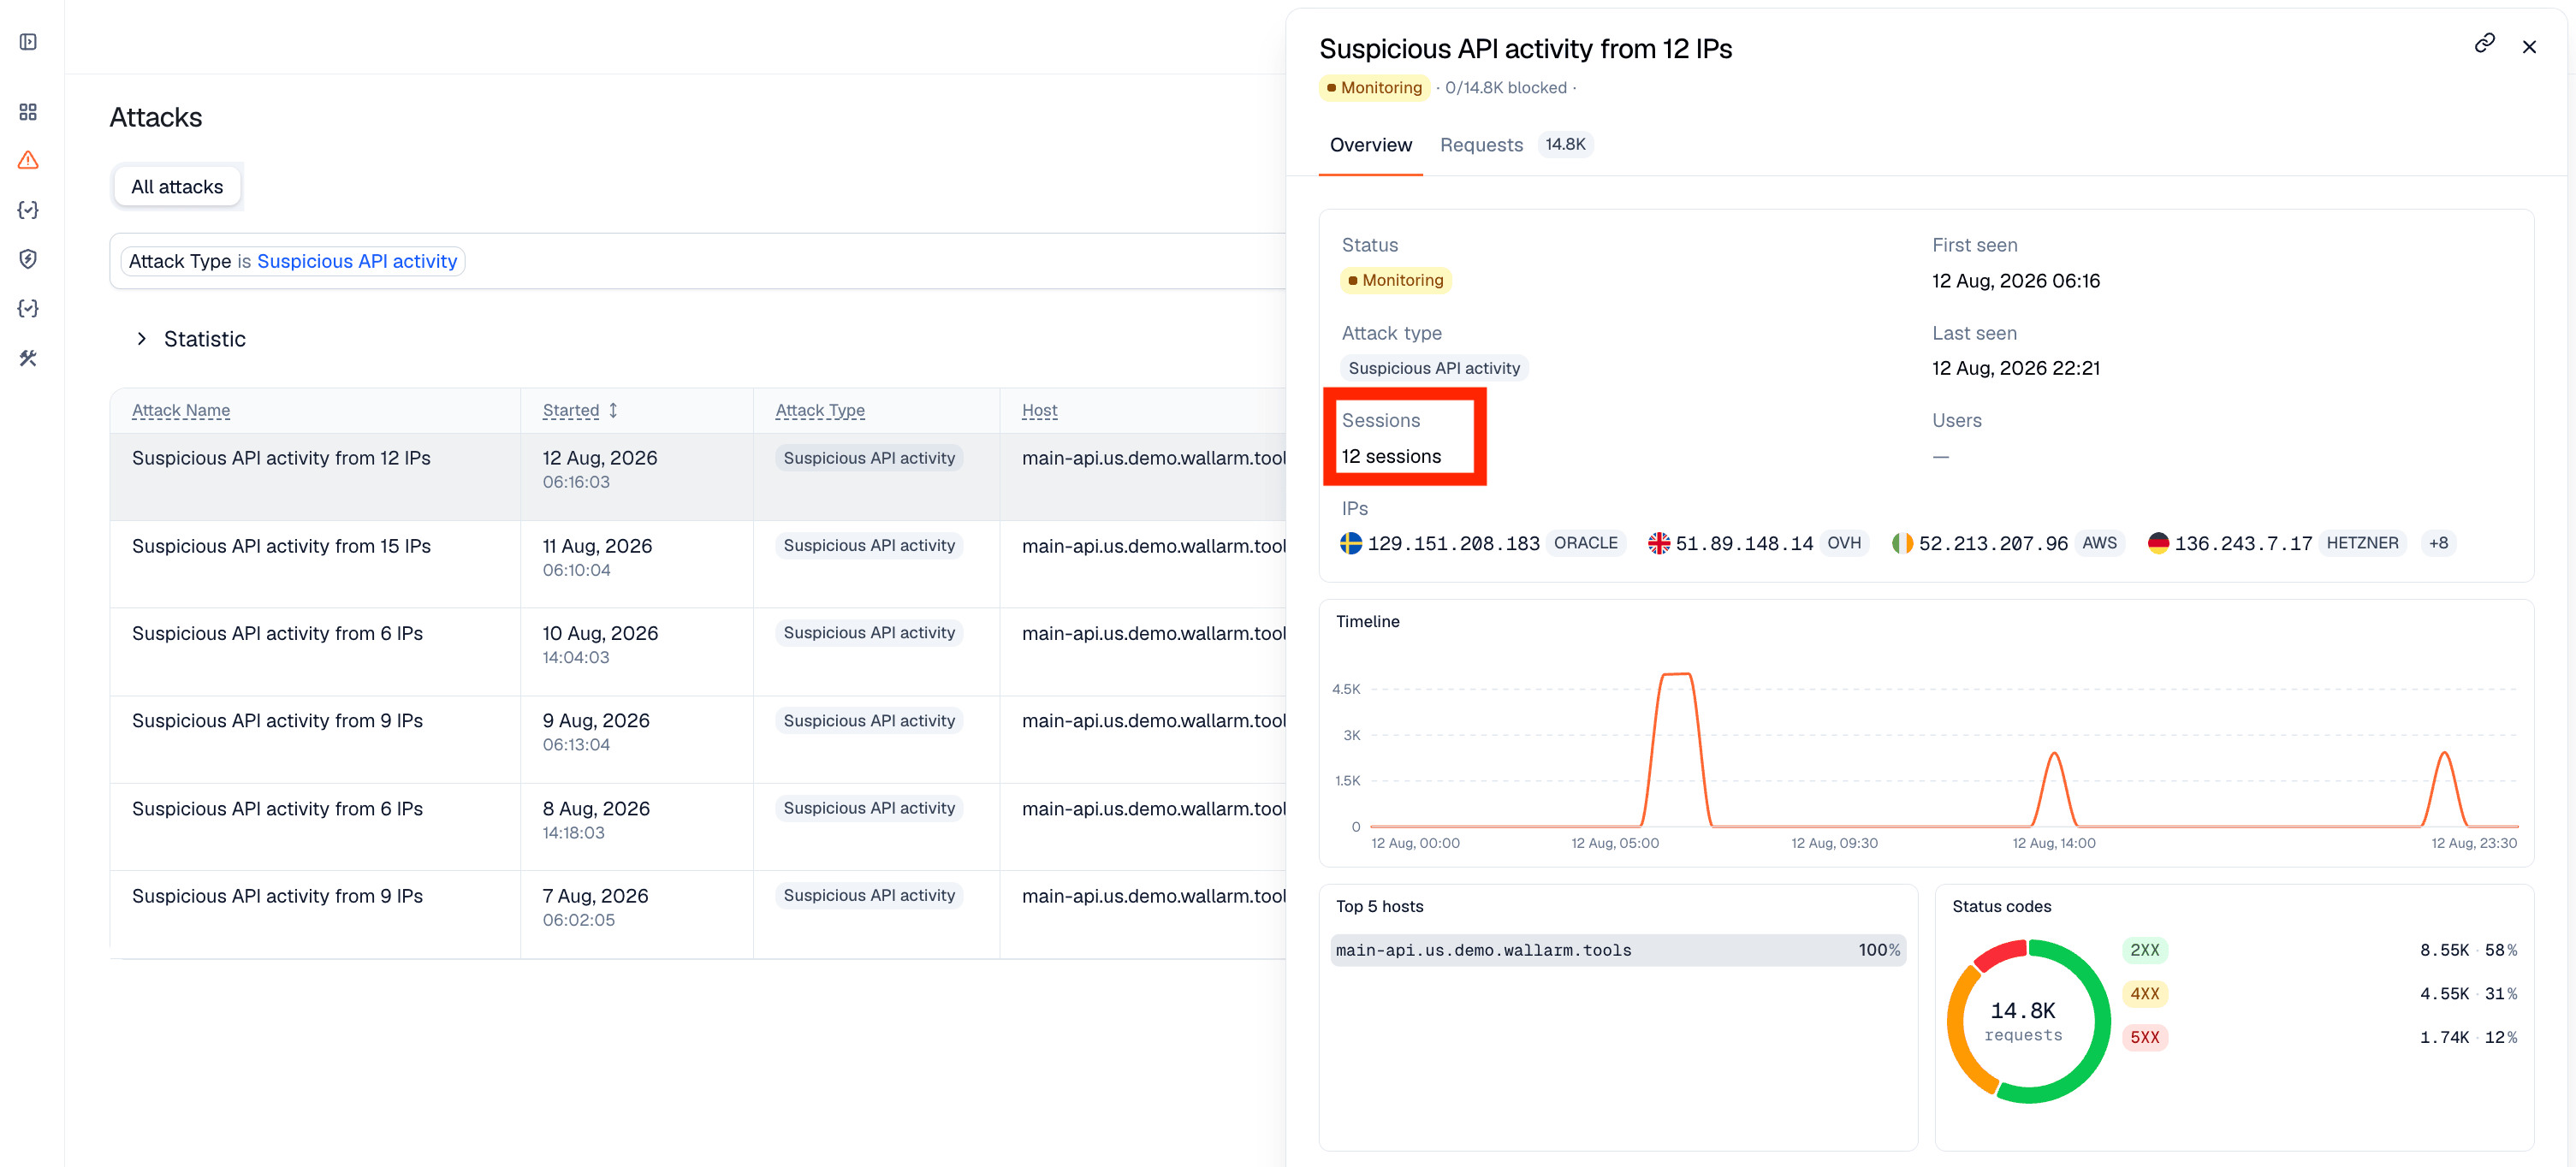
To dig into these sessions, in Wallarm Console → Attacks, open the bot attack and switch to the Requests tab. Here you can filter the requests by Session ID to review one session at a time. To open a session in full, select a request, open the Session ID field menu, and select Investigate this attack in API Sessions: Wallarm opens the API Sessions section filtered to the session related to these bot activities.