Azure Monitor Logs / Microsoft Sentinel
You can set up Wallarm to send security events to a Log Analytics Workspace in Microsoft Azure via the Azure Monitor Logs Ingestion API.
On top of that, you can optionally enable:
-
Microsoft Sentinel — for analytics rules, threat hunting, and workbooks
-
Microsoft Defender portal — for unified security operations across the Defender suite
What this setup creates
-
One custom table in a Log Analytics Workspace
-
One Data Collection Rule (DCR) with the Wallarm event schema
-
One Microsoft Entra app registration with a client secret
-
One role assignment:
Monitoring Metrics Publisheron the DCR
Prerequisites
-
Optionally, enable Microsoft Sentinel on it for threat hunting and analytics features.
-
For CLI steps: Azure CLI installed locally or Azure Cloud Shell
Each step below provides both Azure portal and CLI instructions.
-
An Azure account with the following permissions:
- Contributor on the resource group — to create DCE, DCR, and custom tables
- Log Analytics Contributor on the Log Analytics Workspace — to manage tables
- Owner or User Access Administrator on the DCR — to assign the Monitoring Metrics Publisher role
- Permission to create app registrations in Microsoft Entra ID (typically the Application Developer role)
Wallarm event schema
Wallarm sends events with the following columns:
| Column | Type | Description |
|---|---|---|
TimeGenerated |
datetime |
Event timestamp. |
Vendor |
string |
Always Wallarm. |
EventType |
string |
Event type (e.g., new_hits, create_user). |
Severity |
string |
Risk level: high, medium, low, or info. |
ClientName |
string |
Wallarm account name. |
Summary |
string |
Short event summary. |
Description |
string |
Detailed event description. |
RequestId |
string |
Related request ID (for hits). |
RemoteAddr |
string |
Source IP address (for hits). |
Url |
string |
Related URL (for hits and vulnerabilities). |
RawData |
string |
Full event payload as JSON. |
Step 1: Configure Azure resources
Set variables (CLI)
If using Azure CLI, set these variables first. Replace the placeholders with your values:
-
<RESOURCE_GROUP>— the resource group containing your Log Analytics Workspace (find in Log Analytics workspaces → your workspace → Overview → Resource group) -
<LOCATION>— the Azure region of your workspace (e.g.,eastus,westeurope; find in the same Overview page) -
<WORKSPACE_NAME>— the name of your Log Analytics Workspace
RESOURCE_GROUP="<RESOURCE_GROUP>"
LOCATION="<LOCATION>"
WORKSPACE_NAME="<WORKSPACE_NAME>"

# Names for Azure resources to be created — change if needed
TABLE_NAME="WallarmSentinel_CL"
DCE_NAME="wallarm-sentinel-dce"
DCR_NAME="wallarm-sentinel-dcr"
STREAM_NAME="Custom-WallarmSentinel_CL"
APP_NAME="wallarm-sentinel-ingestion"

SUBSCRIPTION_ID=$(az account show --query id -o tsv)
TENANT_ID=$(az account show --query tenantId -o tsv)

WORKSPACE_ID=$(az monitor log-analytics workspace show \
  --resource-group "$RESOURCE_GROUP" \
  --workspace-name "$WORKSPACE_NAME" \
  --query id -o tsv)
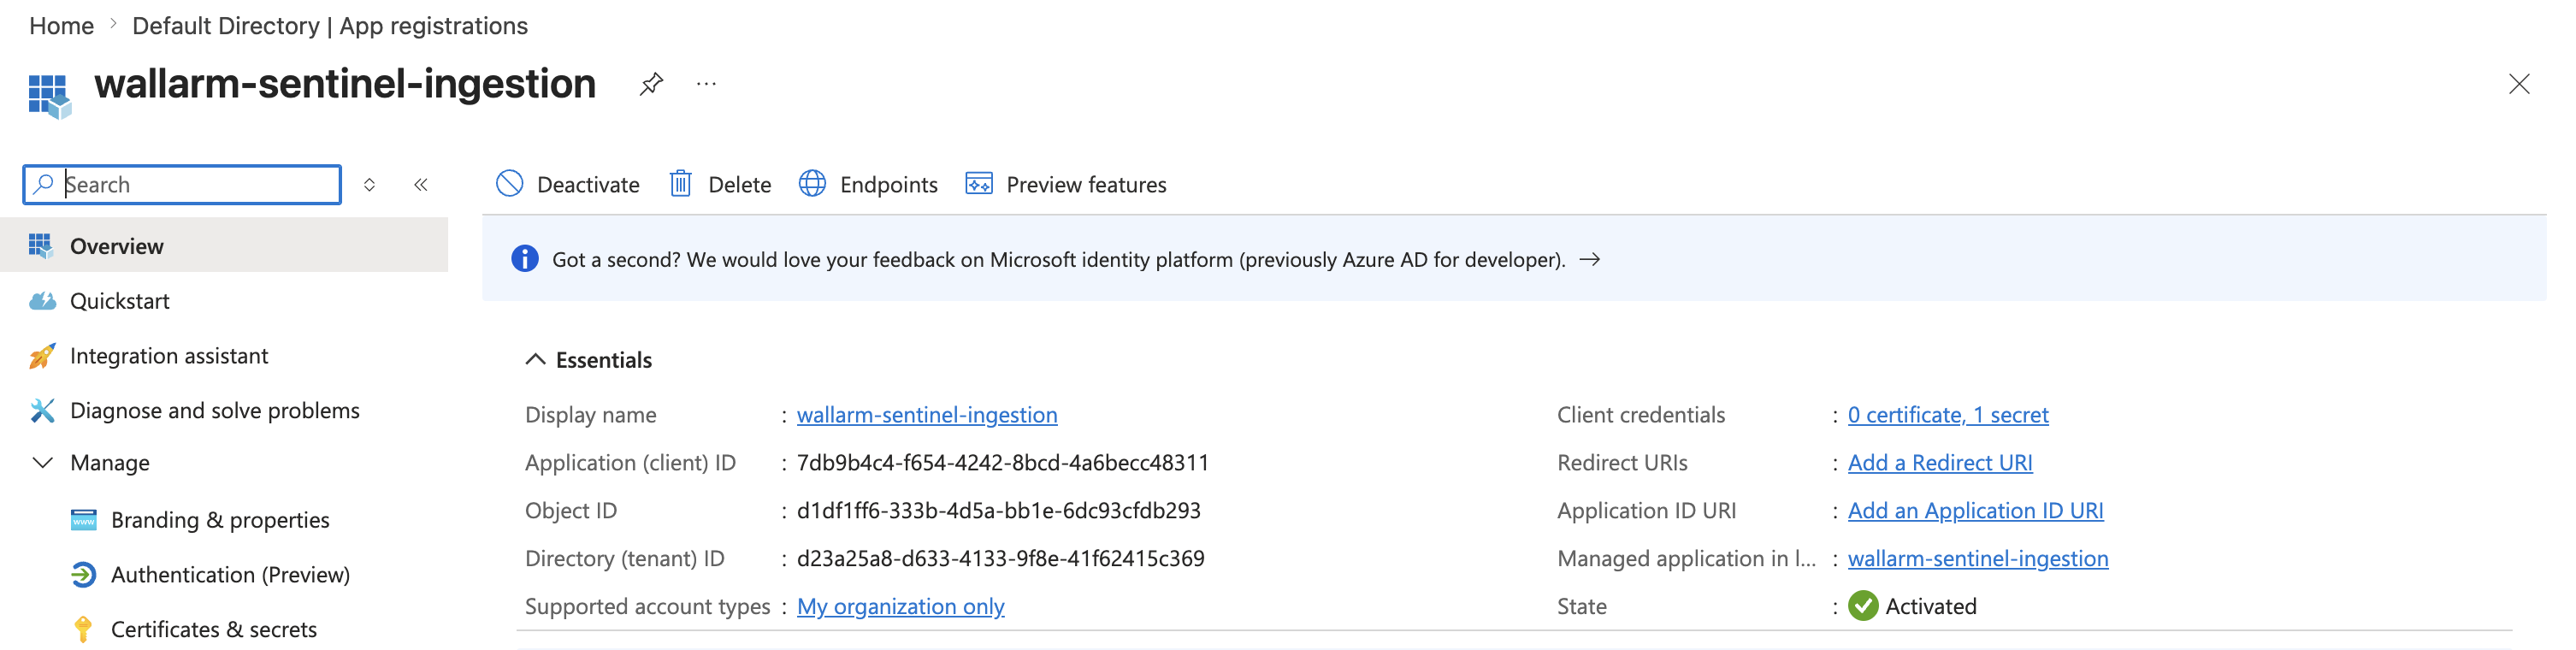
1. Register an application in Microsoft Entra ID
Wallarm uses app registration credentials to authenticate with the Azure Monitor Logs Ingestion API.
Register the application in your organization's Microsoft Entra ID directory (the same one that contains your Azure subscription and Log Analytics Workspace):
- Go to Microsoft Entra ID → App registrations → New registration.
- Enter an application name (e.g.,
wallarm-sentinel-ingestion) and click Register. -
On the application Overview page, copy:
- Application (client) ID — this is the Client ID for Wallarm.
- Directory (tenant) ID — this is the Tenant ID for Wallarm.
-
Go to Manage → Certificates & secrets → New client secret, add a description (e.g.,
wallarm-integration), choose an expiration period, and click Add. - Copy the secret Value immediately — it will not be shown again. This is the Client secret for Wallarm.
CLIENT_ID=$(az ad app create \
  --display-name "$APP_NAME" \
  --sign-in-audience AzureADMyOrg \
  --query appId -o tsv)

az ad sp create --id "$CLIENT_ID" >/dev/null

CLIENT_SECRET=$(az ad app credential reset \
  --id "$CLIENT_ID" \
  --query password -o tsv)

SP_OBJECT_ID=$(az ad sp show \
  --id "$CLIENT_ID" \
  --query id -o tsv)

echo "Client ID:     $CLIENT_ID"
echo "Client Secret: $CLIENT_SECRET"
Save the printed values — you will need them for Wallarm configuration. The client secret cannot be retrieved again later.
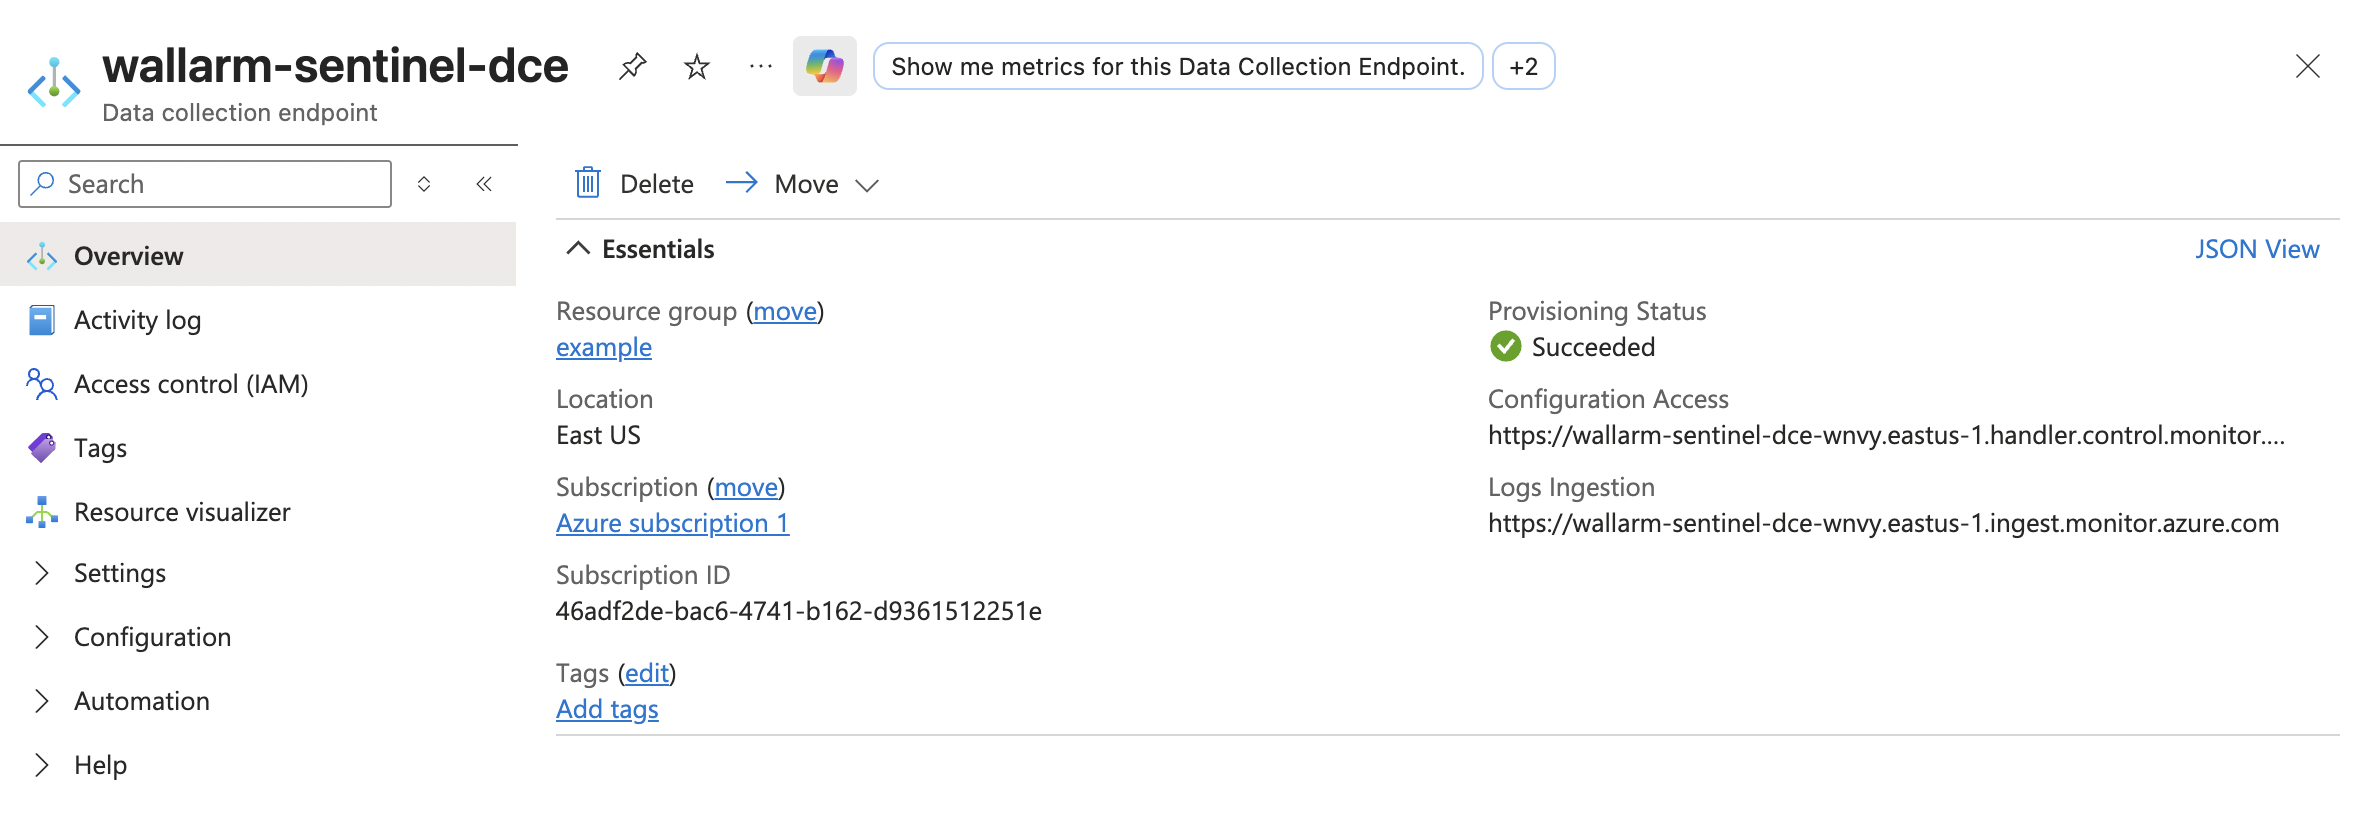
2. Create a Data Collection Endpoint (DCE)
A DCE provides the ingestion endpoint URL that Wallarm sends events to.
- Go to Monitor → Data Collection Endpoints → Create.
- Enter a name (e.g.,
wallarm-sentinel-dce), select the same region as your Log Analytics Workspace, and click Create. - Open the created DCE and copy the Logs Ingestion URI — this is the Logs Ingestion endpoint for Wallarm.
az monitor data-collection endpoint create \
  --name "$DCE_NAME" \
  --resource-group "$RESOURCE_GROUP" \
  --location "$LOCATION" \
  --public-network-access Enabled

DCE_ID=$(az monitor data-collection endpoint show \
  --name "$DCE_NAME" \
  --resource-group "$RESOURCE_GROUP" \
  --query id -o tsv)

ENDPOINT=$(az monitor data-collection endpoint show \
  --name "$DCE_NAME" \
  --resource-group "$RESOURCE_GROUP" \
  --query logsIngestion.endpoint -o tsv)
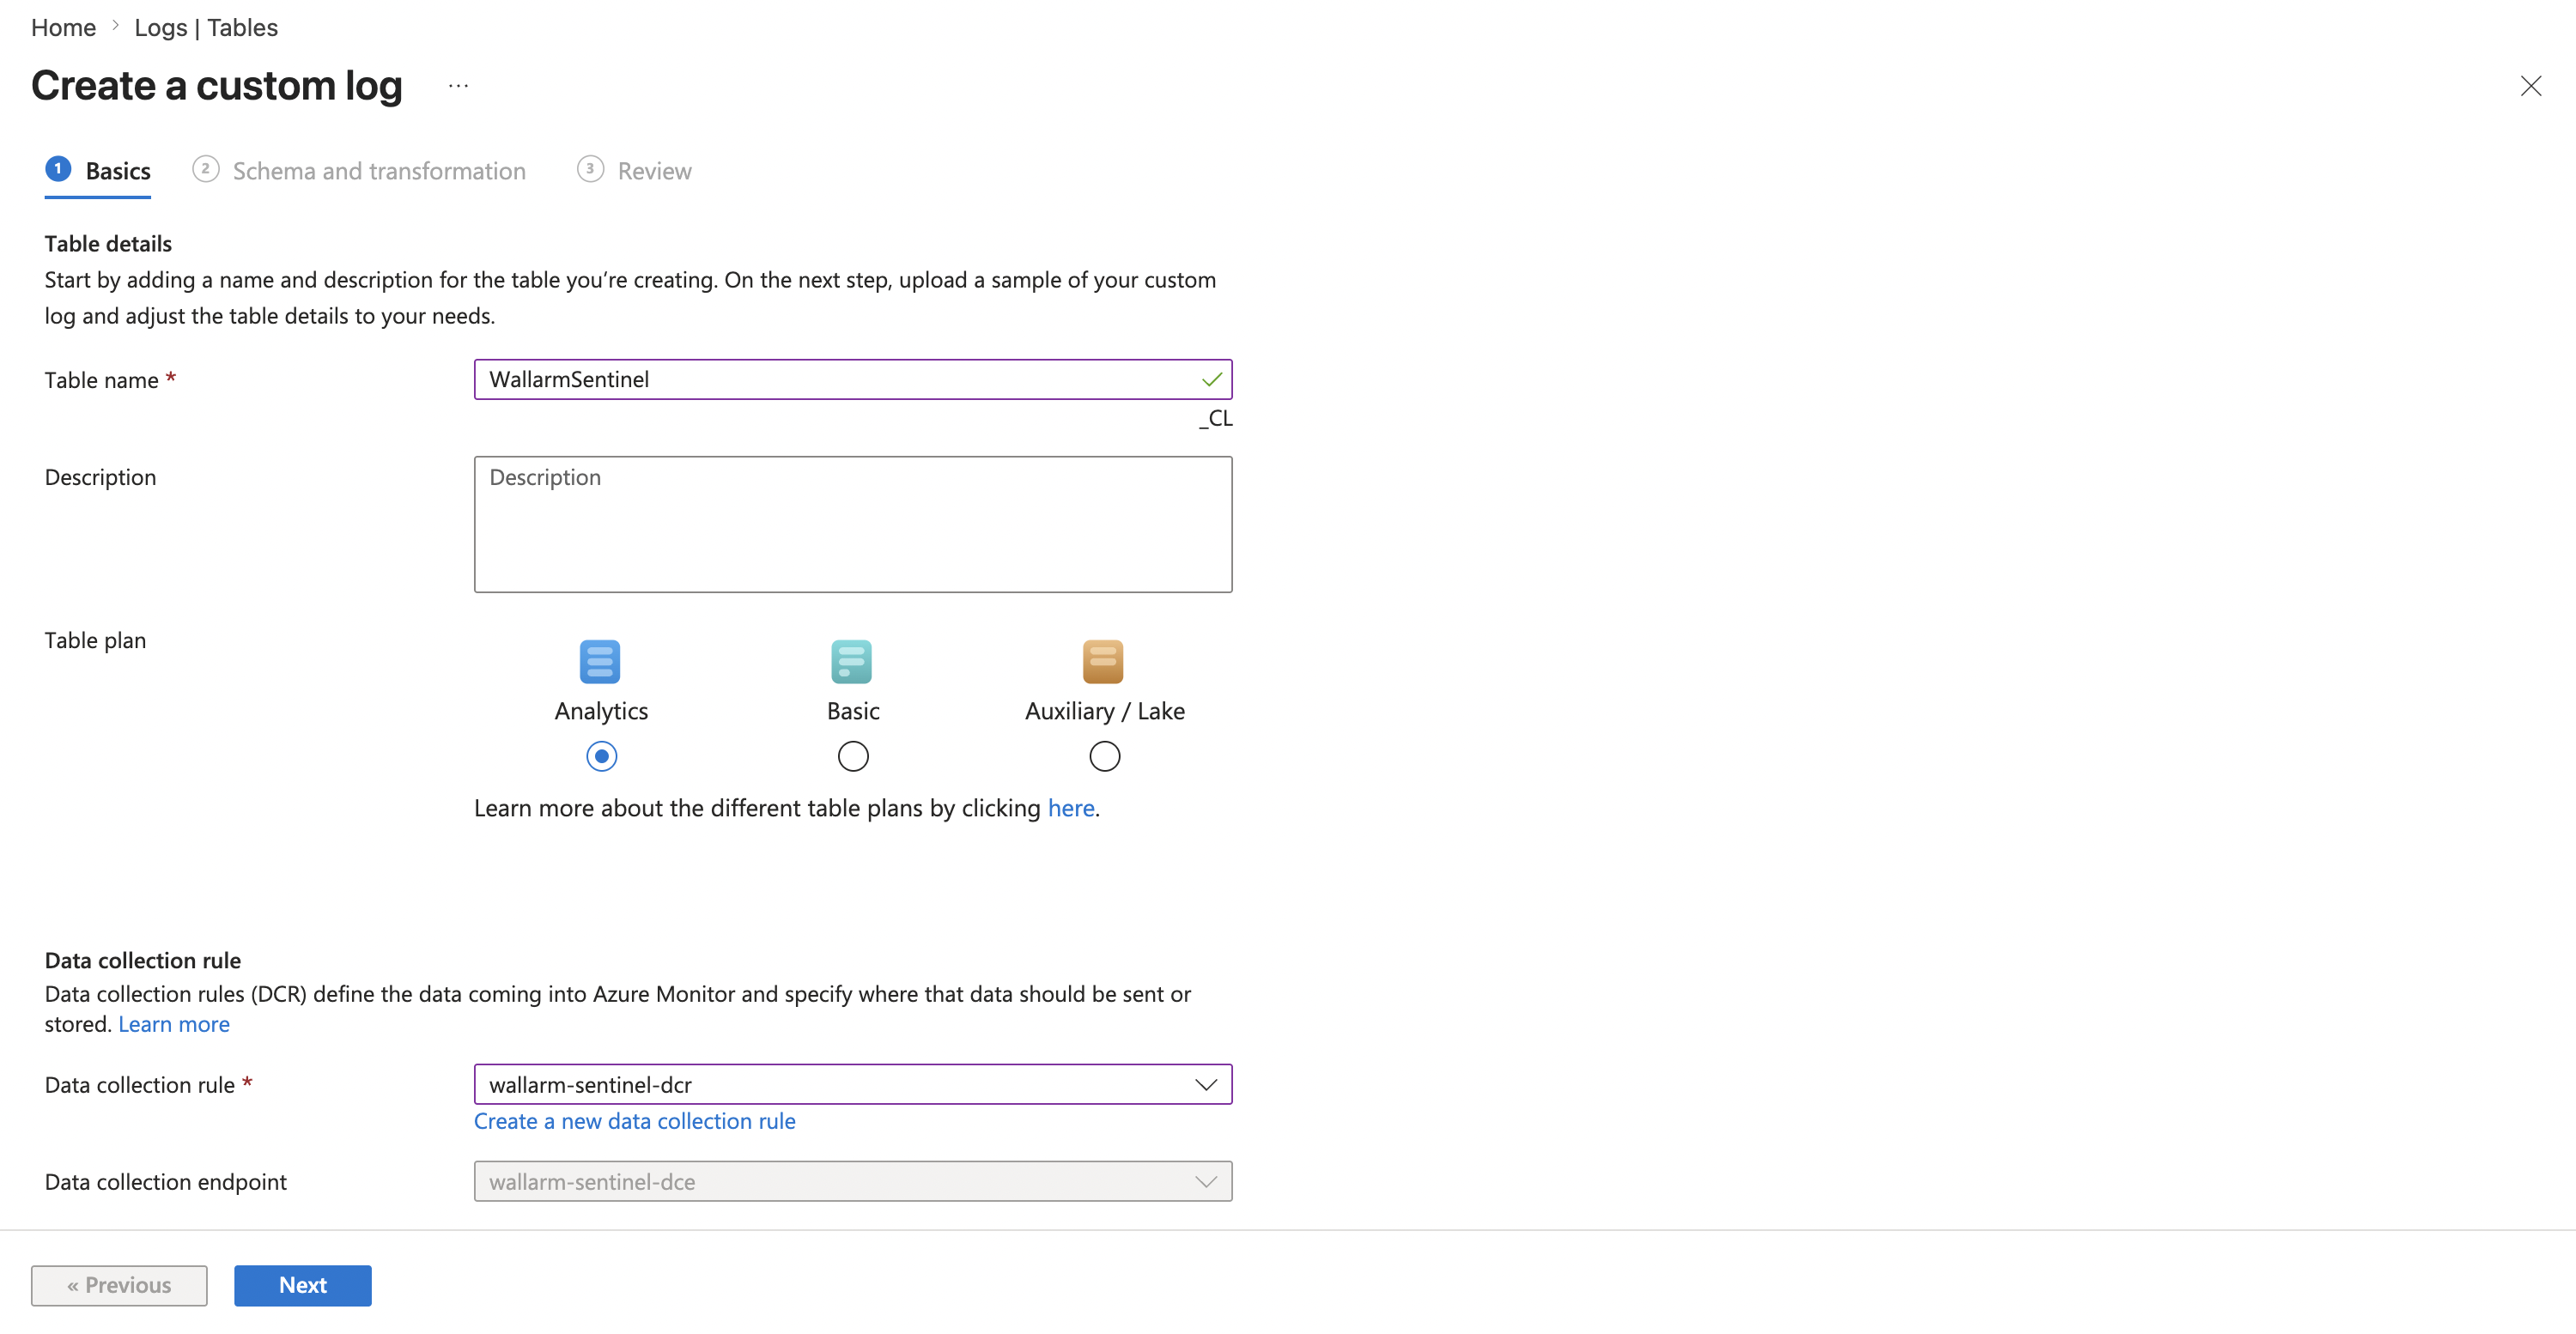
3. Create a custom table
Create a custom table in your Log Analytics Workspace to store Wallarm events.
- Go to Log Analytics workspaces → select your workspace → Tables → Create.
- Enter a table name, e.g.,
WallarmSentinel(the_CLsuffix is added automatically). - Under Table plan, select Analytics.
- Select Create a new data collection rule. Specify the subscription, resource group, and name (e.g.,
wallarm-sentinel-dcr). - Select the DCE created in the previous step, then click Next.
-
Click Browse for files and upload a JSON file with sample Wallarm event data. Save the following content as a
.jsonfile (e.g.,wallarm-sample.json) and upload it:[ { "TimeGenerated": "2026-01-01T00:00:00Z", "Vendor": "Wallarm", "EventType": "new_hits", "Severity": "high", "ClientName": "Sample Company", "Summary": "New hit detected", "Description": "A new hit was detected on your application.", "RequestId": "sample-request-id", "RemoteAddr": "1.2.3.4", "Url": "https://example.com/api/v1/users", "RawData": "{}" } ] -
Optionally configure a transformation, then click Next.
- Review the schema and click Create.
az monitor log-analytics workspace table create \
  --resource-group "$RESOURCE_GROUP" \
  --workspace-name "$WORKSPACE_NAME" \
  --name "$TABLE_NAME" \
  --columns \
    TimeGenerated=datetime \
    Vendor=string \
    EventType=string \
    Severity=string \
    ClientName=string \
    Summary=string \
    Description=string \
    RequestId=string \
    RemoteAddr=string \
    Url=string \
    RawData=string
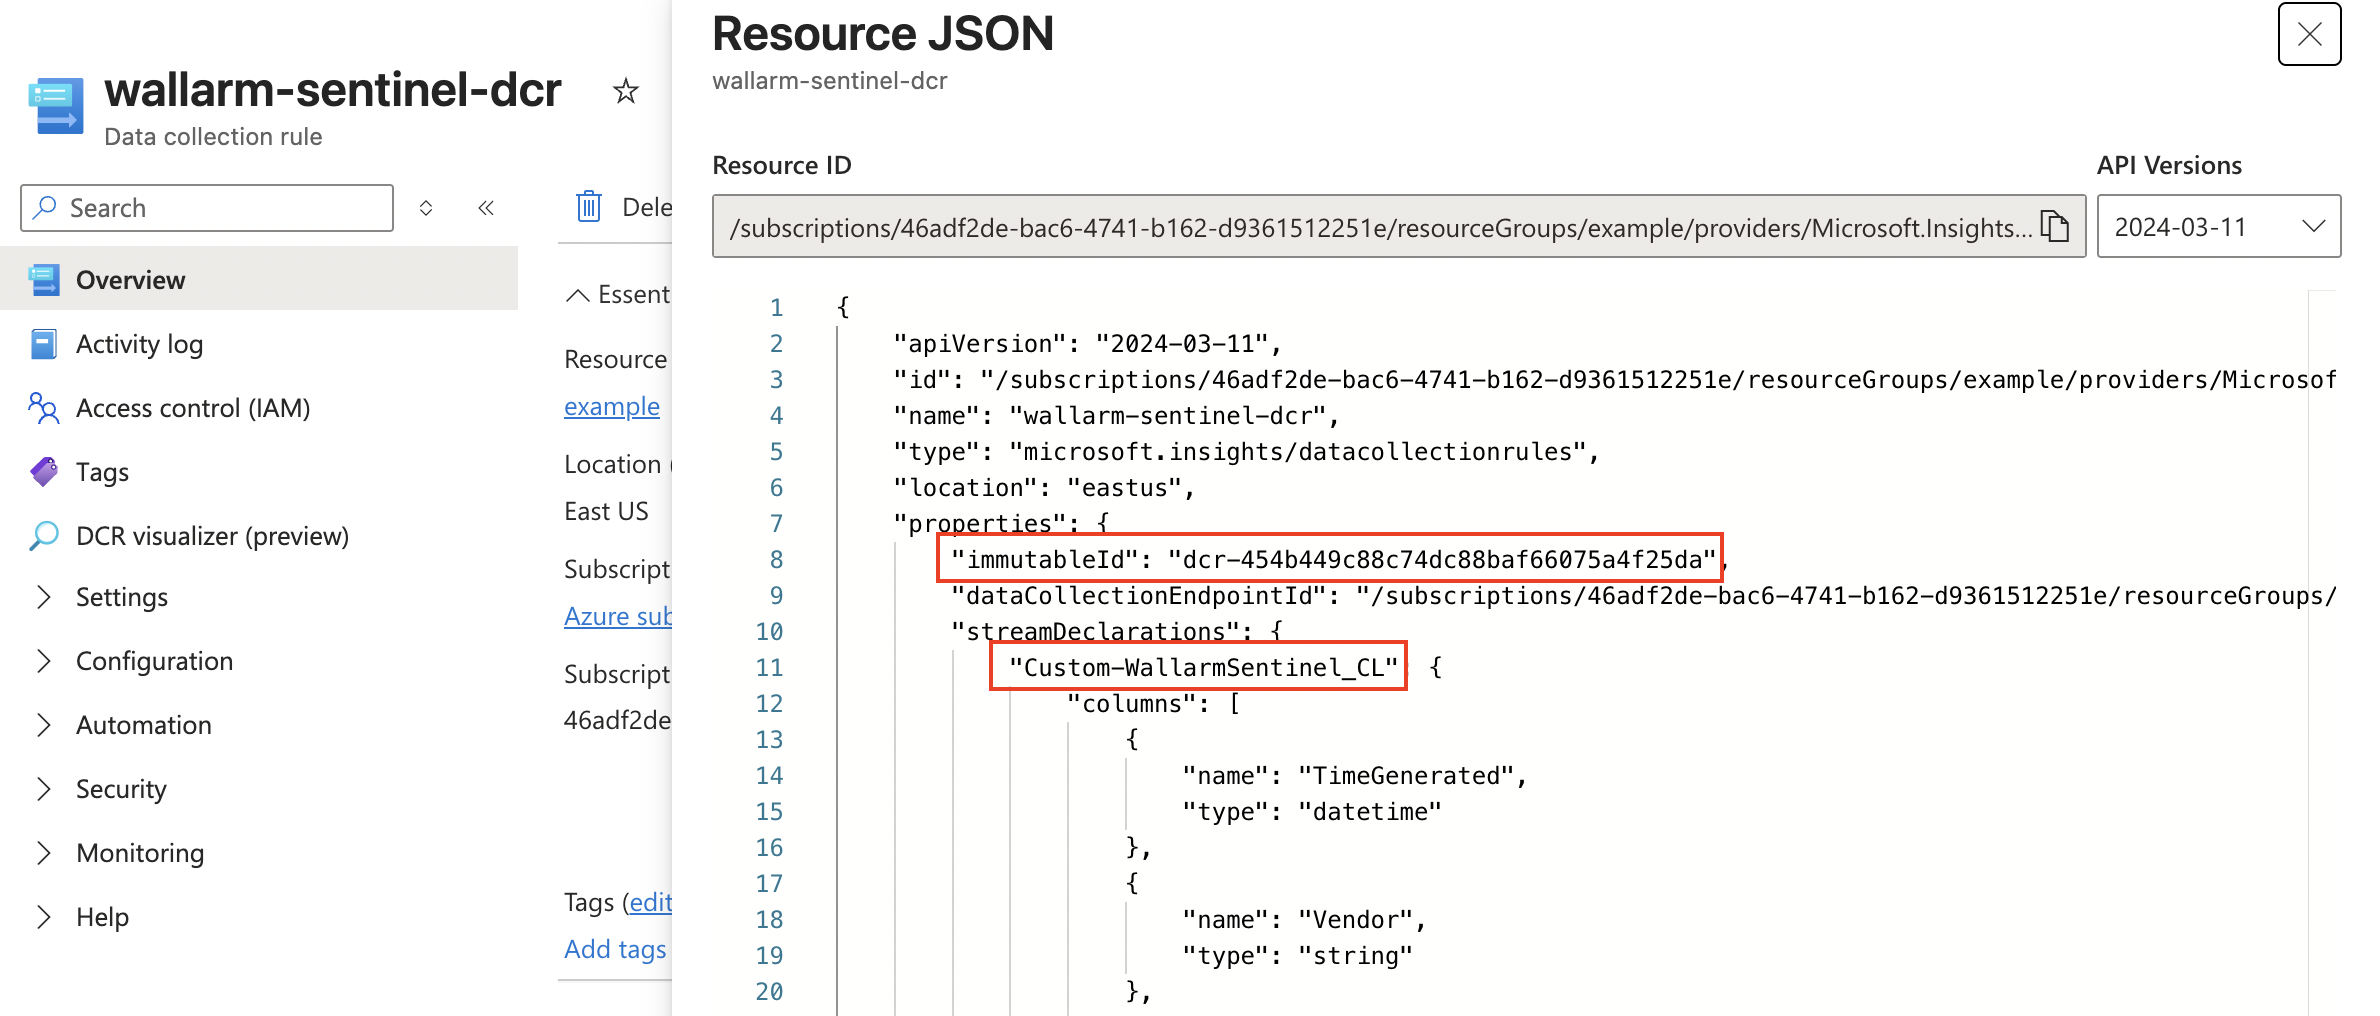
4. Create a Data Collection Rule (DCR)
A DCR tells Azure Monitor how to route incoming data to the correct table.
When using the Azure portal, a DCR is created automatically as part of custom table creation in step 3 — skip to collecting the values below:
- Go to Monitor → Data Collection Rules → select the DCR that was created with your table.
- Open JSON View and copy the immutableId value (starts with
dcr-) — this is the DCR immutable ID for Wallarm. - In the same JSON, find
streamDeclarations— the key name (e.g.,Custom-WallarmSentinel_CL) is the Stream name for Wallarm.
When using CLI, the DCR must be created manually:
-
Create a DCR definition file:
cat > /tmp/wallarm-sentinel-dcr.json <<EOF { "location": "${LOCATION}", "kind": "Direct", "properties": { "dataCollectionEndpointId": "${DCE_ID}", "streamDeclarations": { "${STREAM_NAME}": { "columns": [ { "name": "TimeGenerated", "type": "datetime" }, { "name": "Vendor", "type": "string" }, { "name": "EventType", "type": "string" }, { "name": "Severity", "type": "string" }, { "name": "ClientName", "type": "string" }, { "name": "Summary", "type": "string" }, { "name": "Description", "type": "string" }, { "name": "RequestId", "type": "string" }, { "name": "RemoteAddr", "type": "string" }, { "name": "Url", "type": "string" }, { "name": "RawData", "type": "string" } ] } }, "destinations": { "logAnalytics": [ { "workspaceResourceId": "${WORKSPACE_ID}", "name": "wallarmDestination" } ] }, "dataFlows": [ { "streams": ["${STREAM_NAME}"], "destinations": ["wallarmDestination"], "transformKql": "source", "outputStream": "Custom-${TABLE_NAME}" } ] } } EOF -
Create the DCR:
az monitor data-collection rule create \
  --name "$DCR_NAME" \
  --resource-group "$RESOURCE_GROUP" \
  --location "$LOCATION" \
  --rule-file /tmp/wallarm-sentinel-dcr.json

DCR_ID=$(az monitor data-collection rule show \
  --name "$DCR_NAME" \
  --resource-group "$RESOURCE_GROUP" \
  --query id -o tsv)

DCR_IMMUTABLE_ID=$(az monitor data-collection rule show \
  --name "$DCR_NAME" \
  --resource-group "$RESOURCE_GROUP" \
  --query immutableId -o tsv)
If DCR_IMMUTABLE_ID comes back empty, print the full DCR and copy immutableId from the JSON:
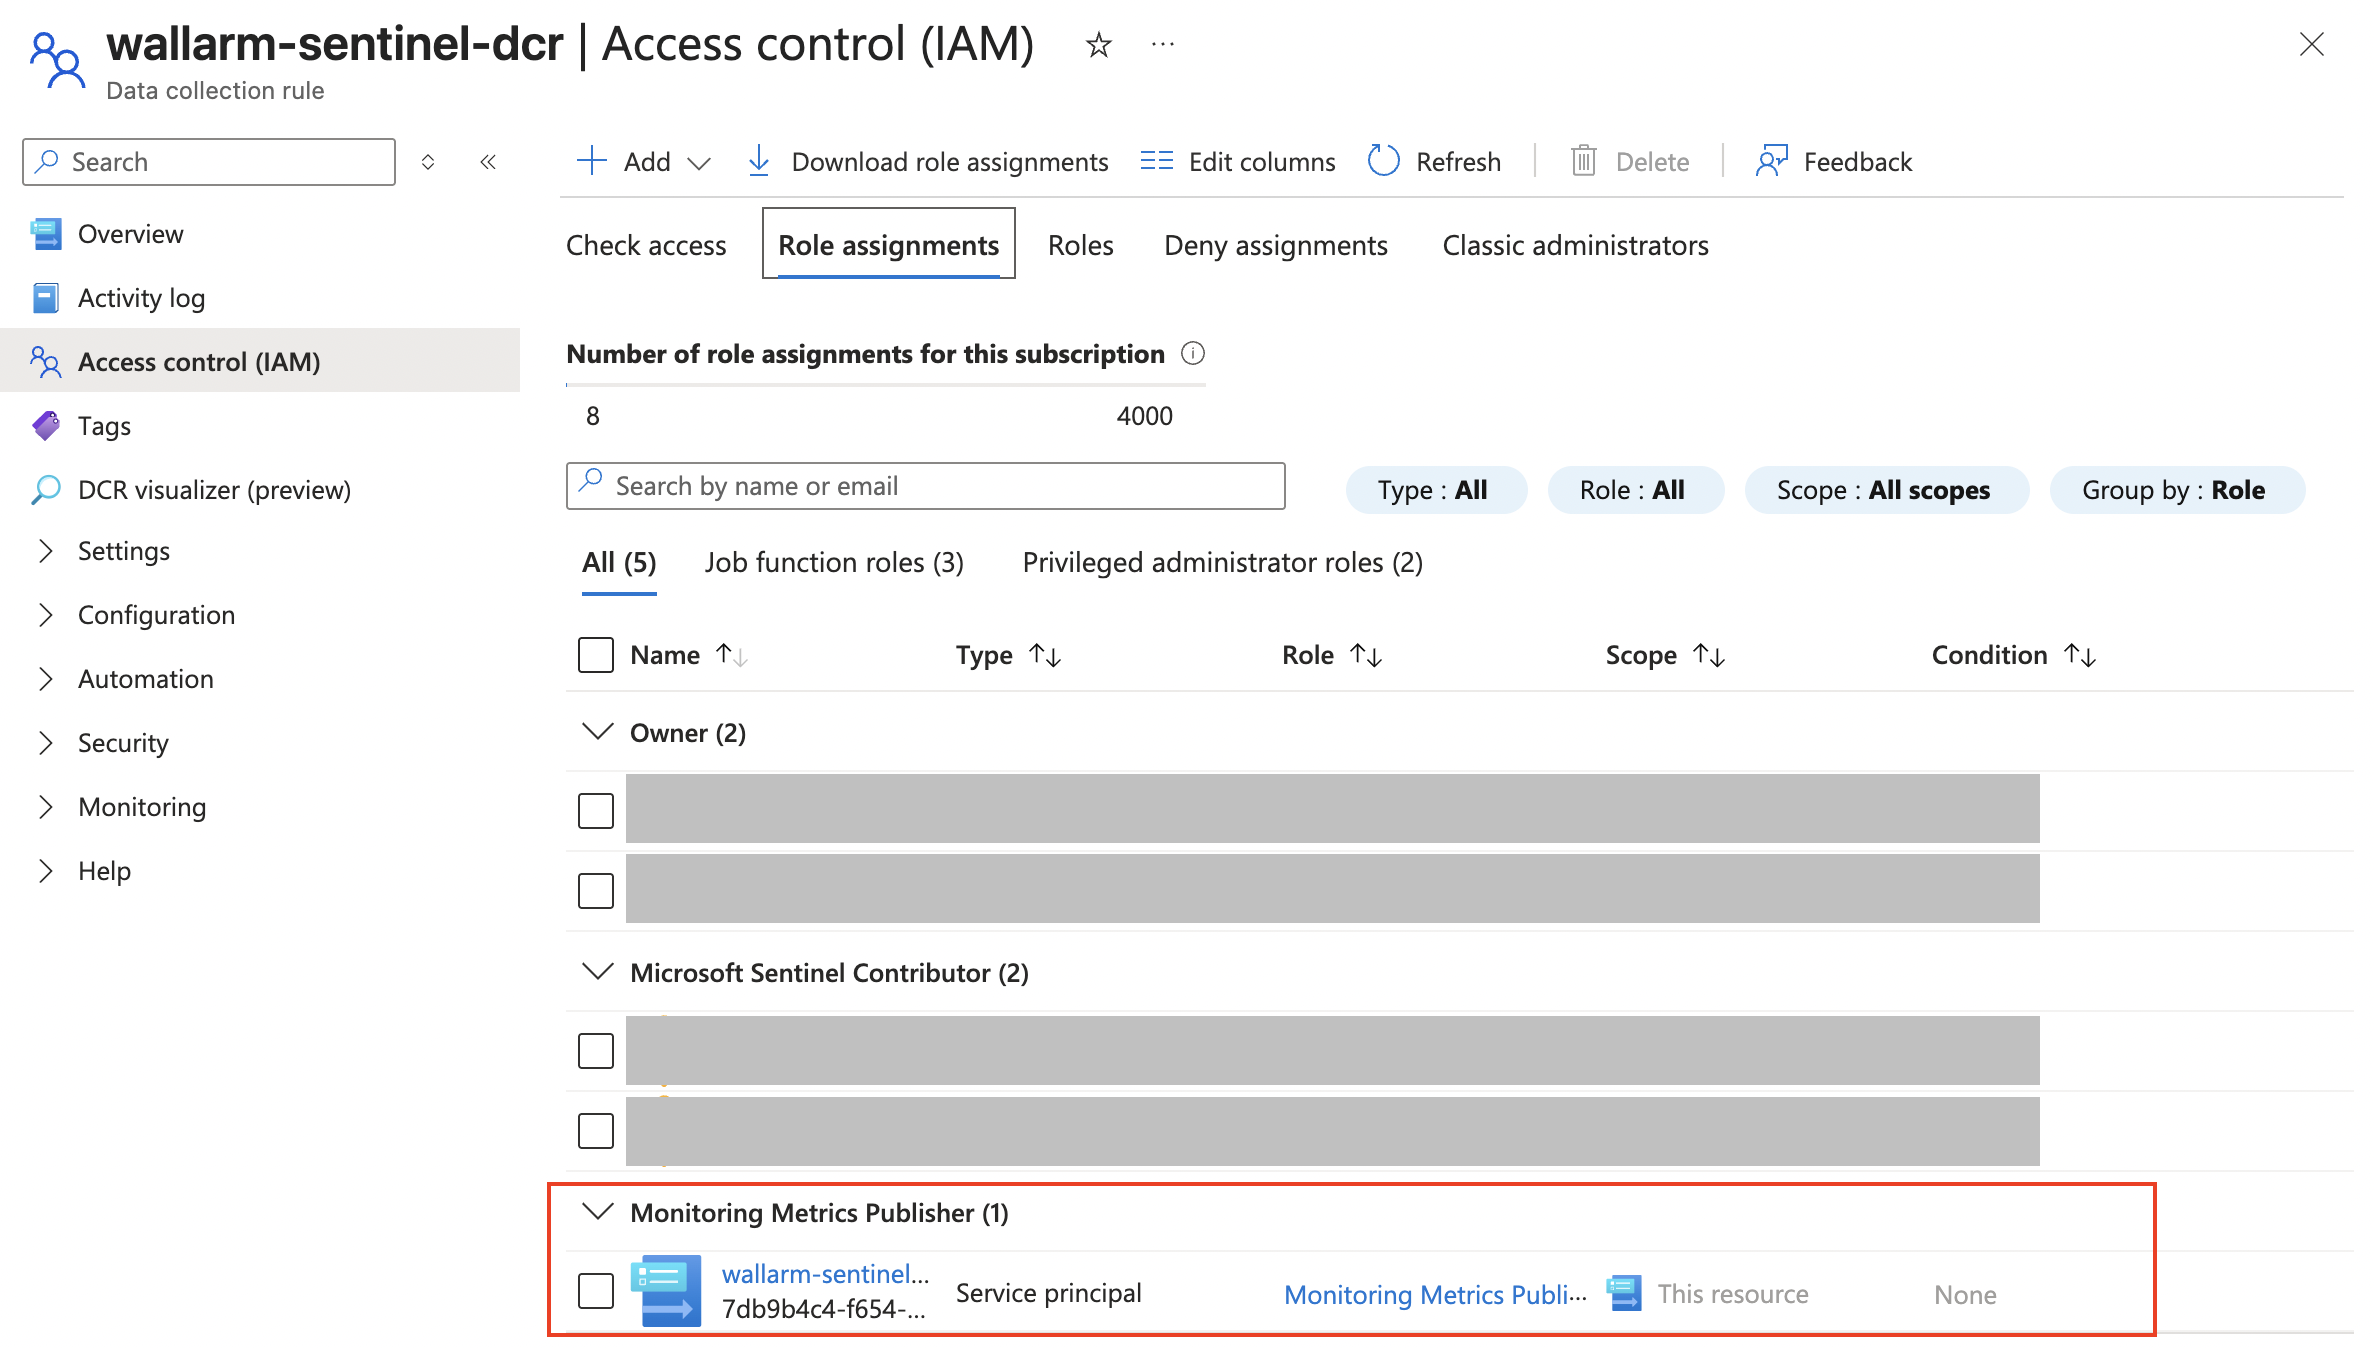
5. Grant permissions
Assign the Monitoring Metrics Publisher role to your app registration on the DCR so Wallarm can send data.
Role assignment propagation delay
Azure RBAC changes can take up to 10 minutes to propagate. If you get an access error right after assigning the role, wait a few minutes and try again.
- Go to Monitor → Data Collection Rules → select your DCR → Access Control (IAM) → Add role assignment.
- On the Role tab, switch to Job function roles and search for Monitoring Metrics Publisher. Select it and click Next.
- On the Members tab, select User, group, or service principal, then click + Select members and search for your app registration by name.
- Click Review + assign.
6. Collect values for Wallarm
After completing all steps, you should have the following values:
| Value | Where to find |
|---|---|
| Tenant ID | App registrations → wallarm-sentinel-ingestion → Overview → Directory (tenant) ID. |
| Client ID | App registrations → wallarm-sentinel-ingestion → Overview → Application (client) ID. |
| Client secret | Saved when creating the client secret. |
| Logs Ingestion endpoint | Data Collection Endpoints → wallarm-sentinel-dce → Overview → Logs Ingestion URI. |
| DCR immutable ID | Data Collection Rules → wallarm-sentinel-dcr → JSON View → immutableId. |
| Stream name | Data Collection Rules → wallarm-sentinel-dcr → JSON View → key in streamDeclarations (e.g., Custom-WallarmSentinel_CL). |
With CLI, you can print all values at once:
cat <<EOF
tenant_id:        $TENANT_ID
client_id:        $CLIENT_ID
client_secret:    $CLIENT_SECRET
endpoint:         $ENDPOINT
dcr_immutable_id: $DCR_IMMUTABLE_ID
stream_name:      $STREAM_NAME
EOF
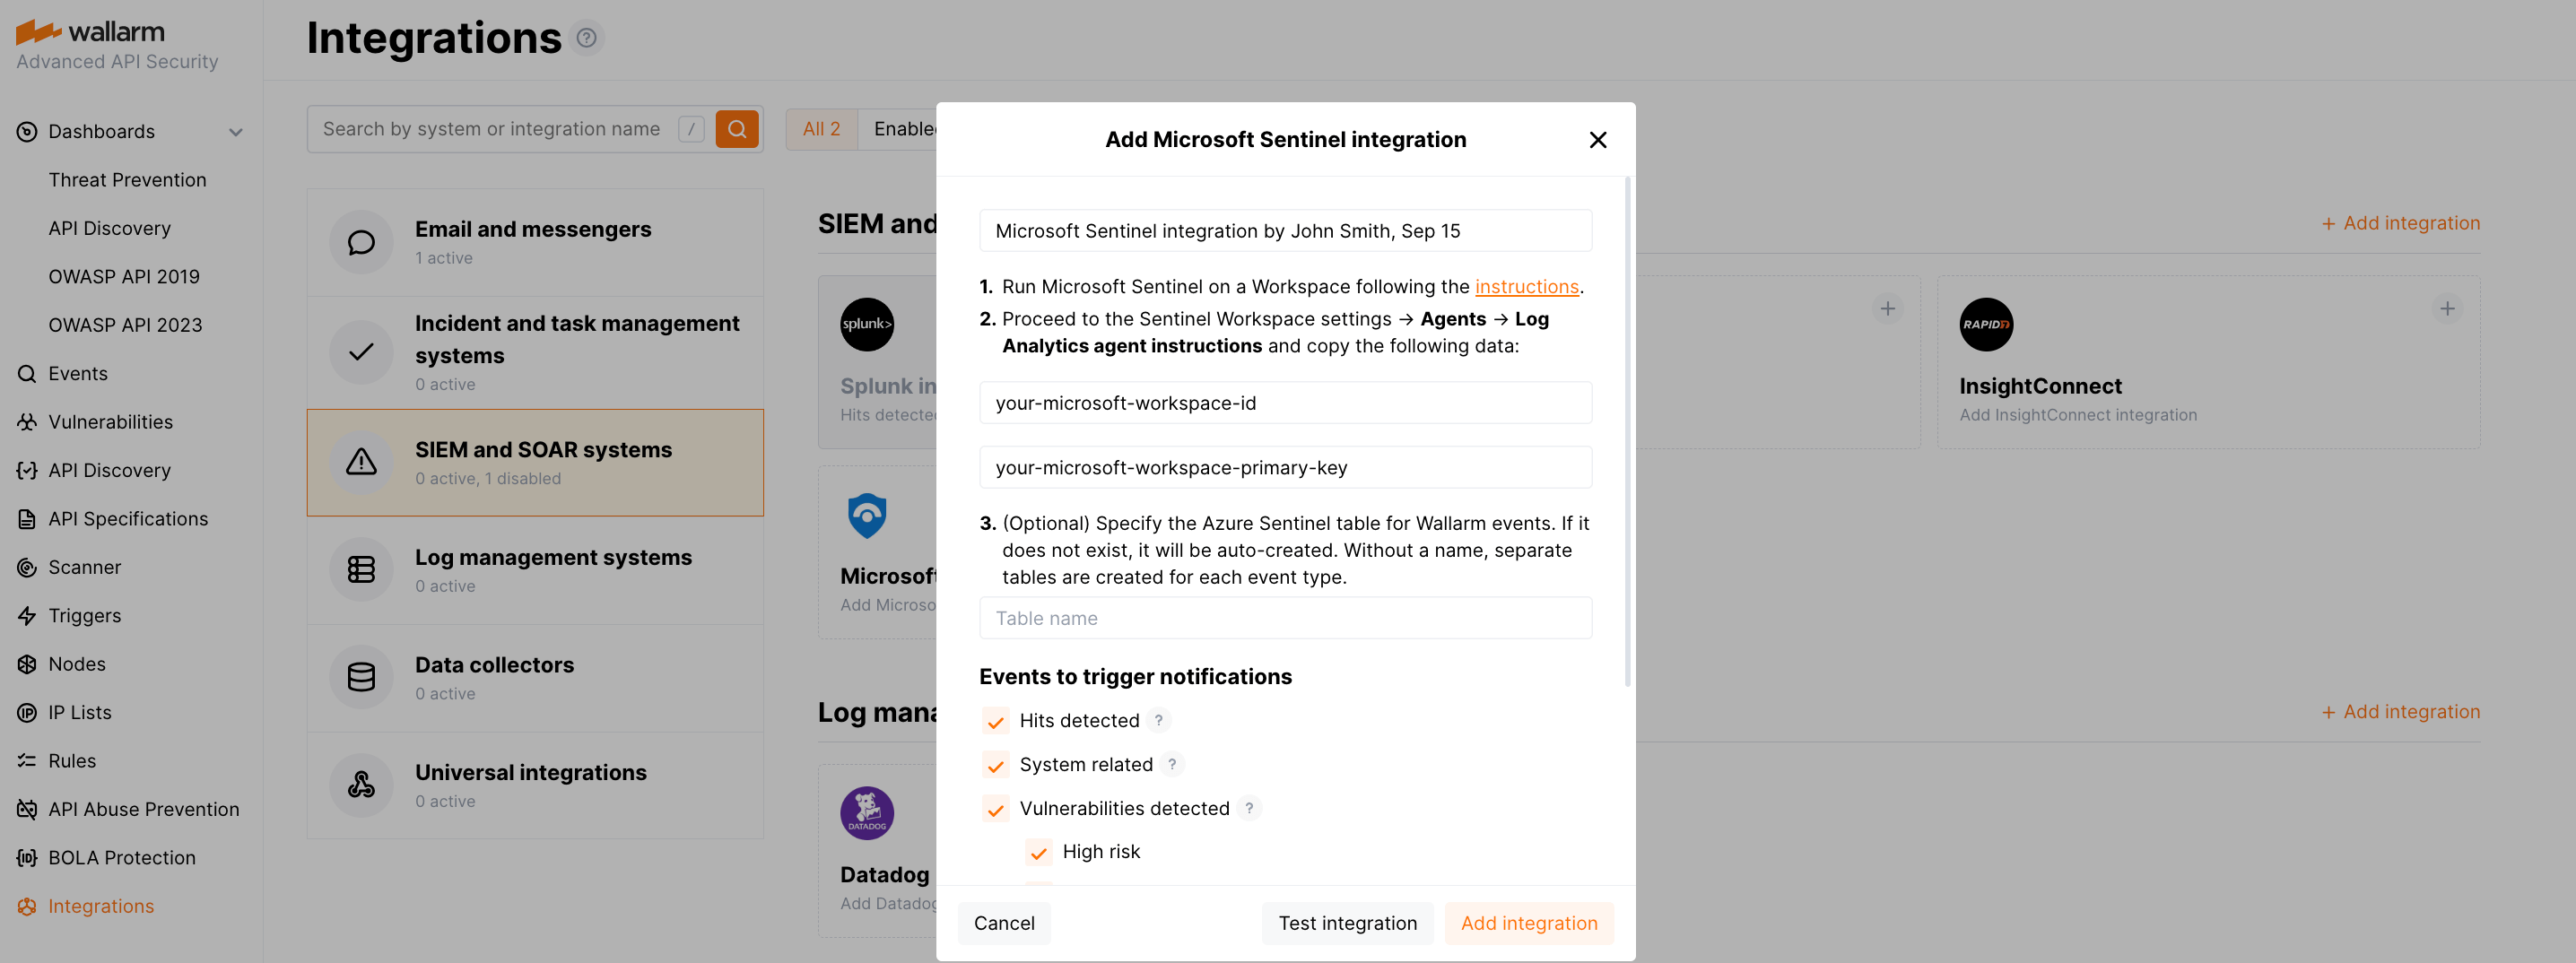
Step 2: Configure Wallarm integration
-
Open the Integrations section in Wallarm Console.
-
Click the Microsoft Sentinel block or click the Add integration button and choose Microsoft Sentinel.
-
Enter an integration name.
-
Fill in the values collected from Azure: Tenant ID, Client ID, Client secret, Logs Ingestion endpoint, DCR immutable ID, and Stream name.
-
Choose event types to trigger notifications.
Details on available events:
-
Hits detected except for:
- Experimental hits detected based on the custom regular expression. Non-experimental hits trigger notifications.
- Hits not saved in the sample.
Optionally include the
headersobject with hit headers in hit logs. If disabled, headers are not included in the logs. -
System related:
- User changes (newly created, deleted, role change)
- Integration changes (disabled, deleted)
- Application changes (newly created, deleted, name change)
- Errors during regular update of specifications used for rogue API detection or API specification enforcement
- Rules and triggers changed (creating, updating, or deleting the rule or trigger)
- Security issues detected by all methods, all or only for the selected risk levels:
- Critical risk
- High risk
- Medium risk
- Low risk
- Info risk
- On an hourly basis, you can get a notification with the number of requests processed during the previous hour
-
-
Click Test integration to check configuration correctness, availability of the target system, and the notification format.
-
Click Add integration.
Wallarm Cloud IP addresses
To provide Wallarm Cloud access to your system, you may need a list of its public IP addresses:
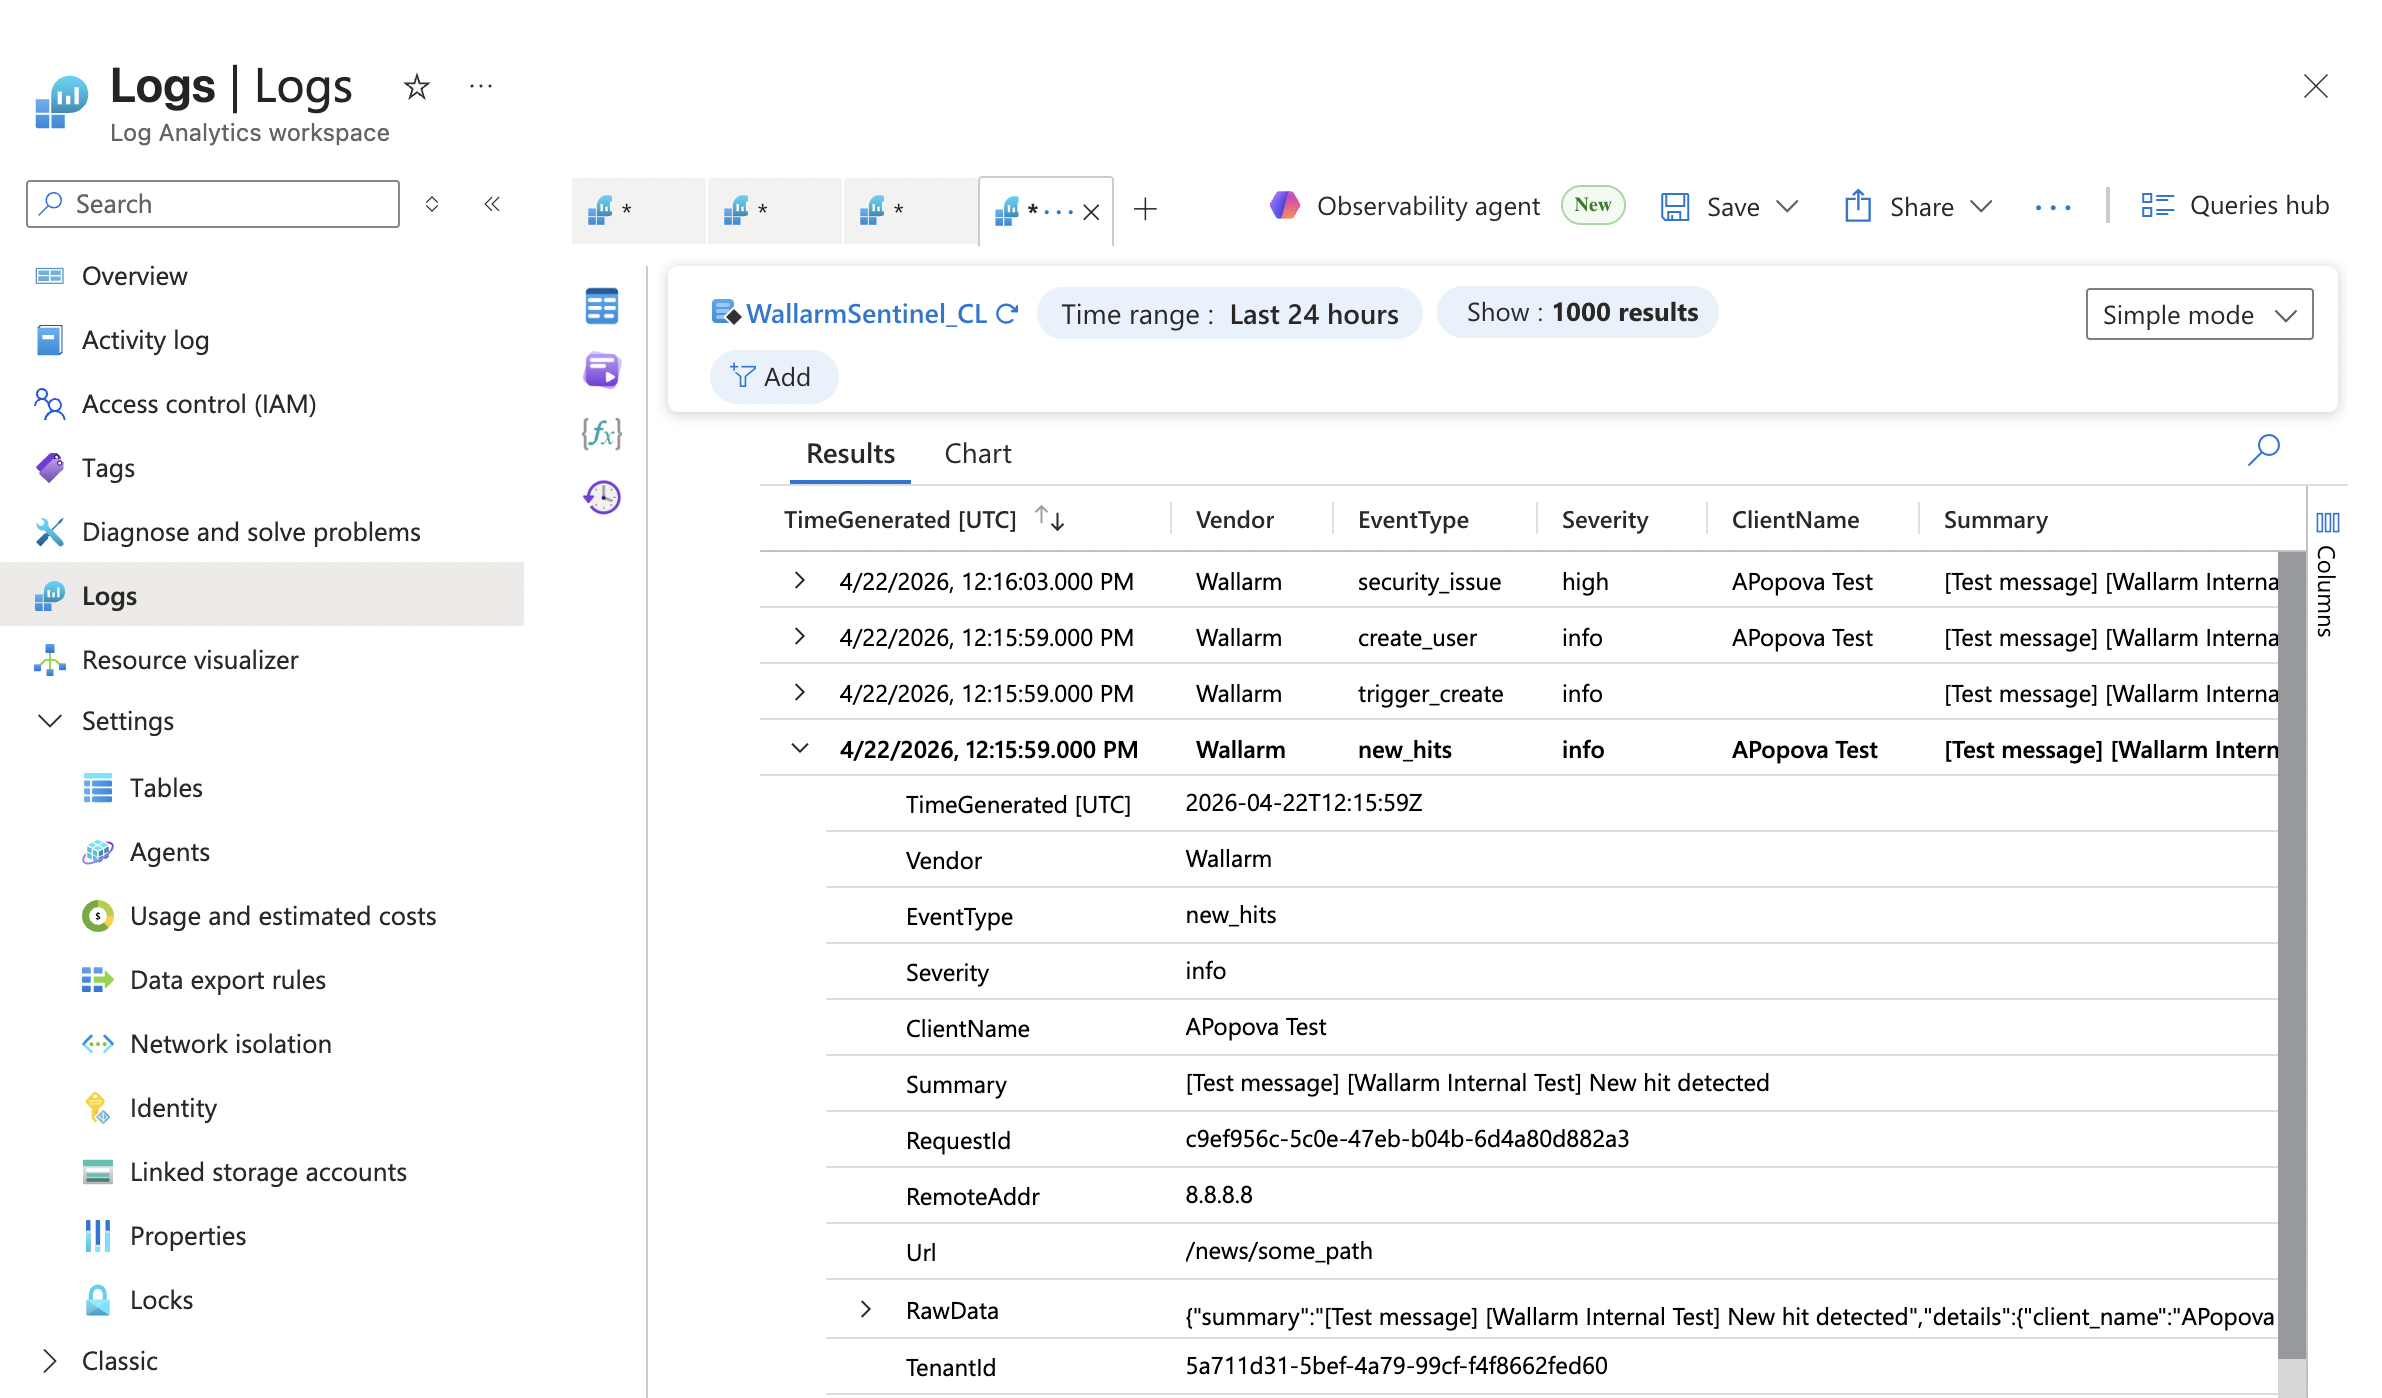
Viewing Wallarm logs in Microsoft Azure
After the integration is set up, you can query Wallarm events in several places:
Log Analytics Workspace → Logs
In the Azure portal, go to Log Analytics workspaces → select your workspace → Logs:
Microsoft Sentinel → Logs
If Microsoft Sentinel is enabled on the workspace, go to Microsoft Sentinel → select your workspace → Logs.
Microsoft Defender portal
If your Sentinel workspace is connected to the Defender portal, open security.microsoft.com → Investigation & response → Hunting → Advanced hunting.
Useful KQL queries
To see all hits grouped by source IP:
WallarmSentinel_CL
| where EventType == "new_hits"
| summarize HitCount = count() by RemoteAddr
| sort by HitCount desc
To see high-severity events in the last 7 days:
WallarmSentinel_CL
| where TimeGenerated > ago(7d)
| where Severity == "high"
| project TimeGenerated, EventType, Summary, Url, RemoteAddr
| sort by TimeGenerated desc
Wallarm event types
All events are sent to a single custom table (e.g., WallarmSentinel_CL). The EventType column distinguishes between event types:
| Event | EventType value |
|---|---|
| New hit | new_hits |
| New user in a company account | create_user |
| Deletion of a user from a company account | delete_user |
| User role update | update_user |
| Deletion of an integration | delete_integration |
| Disabling an integration | disable_integration or integration_broken if it was disabled due to incorrect settings |
| New application | create_application |
| Deletion of an application | delete_application |
| Application name update | update_application |
| New vulnerability of a high risk | vuln_high |
| New vulnerability of a medium risk | vuln_medium |
| New vulnerability of a low risk | vuln_low |
| New rule | rule_create |
| Deletion of a rule | rule_delete |
| Changes of an existing rule | rule_update |
| New trigger | trigger_create |
| Deletion of a trigger | trigger_delete |
| Changes of an existing trigger | trigger_update |
| Changes in API inventory (if the corresponding trigger is active) | api_structure_changed |
| Amount of attacks exceeds the threshold (if the corresponding trigger is active) | attacks_exceeded |
| New denylisted IP (if the corresponding trigger is active) | ip_blocked |
Migration from legacy integration
The previous version of the Microsoft Sentinel integration used the Azure Log Analytics Data Collector API with Workspace ID and Primary key for authentication. This API will be deprecated by Microsoft on July 1, 2026.
If you already have an active legacy integration, it remains visible in the Wallarm Console with a Legacy suffix and continues to work until the Microsoft deprecation date. For new setups, only the new integration is available.
Legacy integration setup reference
The legacy integration required only two values from Azure:
-
Go to the Sentinel Workspace settings → Agents → Log Analytics agent instructions and copy:
- Workspace ID
- Primary key
These values were then pasted into the Wallarm integration form along with an optional table name.
Migration path
-
Keep the old (Legacy) integration untouched while preparing the new setup.
-
Create the Azure resources described in Step 1 above.
-
Create a new Microsoft Sentinel integration in Wallarm with the new fields.
-
Test the new integration and verify data appears in the table.
-
Optionally run both integrations in parallel for a short validation period.
-
Disable or remove the legacy integration after cutover.
Disabling and deleting an integration
You can delete or temporarily disable the integration. While deleting stops sending notifications and completely deletes all configuration, disabling just stops sending notifications which you can at any moment re-enable with the same settings.
If for the integration the System related events are selected to trigger notifications, Wallarm will notify about both of these actions.
System unavailability and incorrect integration parameters
Notifications to the system are sent via requests. If the system is unavailable or integration parameters are configured incorrectly, the error code is returned in the response to the request.
If the system responds to Wallarm request with any code other than 2xx, Wallarm resends the request with the interval until the 2xx code is received:
-
The first cycle intervals: 1, 3, 5, 10, 10 seconds
-
The second cycle intervals: 0, 1, 3, 5, 30 seconds
-
The third cycle intervals: 1, 1, 3, 5, 10, 30 minutes
If the percentage of unsuccessful requests reaches 60% in 12 hours, the integration is automatically disabled. If you receive system notifications, you will get a message about automatically disabled integration.