# Attack Analysis
This article describes how you can analyze attacks detected by the Wallarm node and take actions regarding them.
!!! info "Attacks or API Sessions"
Note that while usually attacks are displayed both in **Attacks** and **API Sessions**, so far [some of the attacks](#attacks-displayed-exclusively-in-api-sessions) can be found only in **API Sessions**.
### Attack analysis
The [attacks](https://docs.wallarm.com/about-wallarm/protecting-against-attacks.md#what-is-attack-and-what-are-attack-components) detected by the Wallarm platform are displayed in the **Attacks** or **API Sessions** section of the Wallarm Console. You can [filter](https://docs.wallarm.com/user-guides/search-and-filters/use-search.md) the list by attack date, type and other criteria, expand any attack and its included requests for detailed analysis.
If a detected attack turns out to be a [false positive](#false-positives), you can immediately mark it as one to prevent alike false positives in future. Also, on the basis of the detected attacks, you can create rules and perform other Wallarm configurations to mitigate further alike threats.
In Wallarm:
* **Attack** is a [group](https://docs.wallarm.com/user-guides/events/grouping-sampling.md#grouping-of-hits) of hits
* **Hit** is a malicious request plus metadata added by node
* **Malicious payload** is a part of request with attack sign
Read details [here](https://docs.wallarm.com/about-wallarm/protecting-against-attacks.md#what-is-attack-and-what-are-attack-components).
Each attack details contain all necessary information for analysis, such as attack's hits and malicious payload summary. To simplify analysis, only unique hits are stored in the attack details. Repeated malicious requests are dropped from uploading to the Wallarm Cloud and not displayed. This process is called [hit sampling](https://docs.wallarm.com/user-guides/events/grouping-sampling.md#sampling-of-hits).
Hit sampling does not affect the quality of attack detection and Wallarm node continues protect your applications and APIs even with hit sampling enabled.
## Full context of threat actor activities
Once the malicious request is detected by Wallarm and displayed in the [**Attacks**](https://docs.wallarm.com/user-guides/events/check-attack.md) or [**Incidents**](https://docs.wallarm.com/user-guides/events/check-incident.md) section as the part of some attack, you have an ability to know the full context of this request: to which user session it belongs and what the full sequence of requests in this session is. This allows investigating all activity of the threat actor to understand attack vectors and what resources can be compromised.
To perform this analysis, in Wallarm Console → **Attacks** or **Incidents**, access the attack, and then specific request details. In request details, click **Explore in API Sessions**. Wallarm will open the [**API Session**](https://docs.wallarm.com/api-sessions/overview.md) section filtered: the session, the initial request belongs to is displayed, only the initial request is displayed within this session.
Remove the filter by request ID to see all other requests in the session: now you have the full picture of what was going on within the session the malicious request belongs to.
## Attacks displayed exclusively in API Sessions
Some of Wallarm's [mitigation controls](https://docs.wallarm.com/about-wallarm/mitigation-controls-overview.md) base their traffic analysis and corresponding actions entirely on API sessions which significantly improve their work: if previously you had several nodes and, for example, a brute force [rule](https://docs.wallarm.com/user-guides/rules/rules.md), your network load balancer could separate attack requests into different nodes and for each node the brute force counter worked separately. This could lead to missing some brute force attacks. The improved approach of mitigation control in this example is that it relies on session, no matter which node the traffic went through.
Because of that, the attacks found by such mitigation controls are displayed exclusively in [**API Sessions**](https://docs.wallarm.com/api-sessions/overview.md) (and not displayed in **Attacks**):
* [Enumeration attack protection](https://docs.wallarm.com/api-protection/enumeration-attack-protection.md) (by mitigation control)
* [Brute force protection](https://docs.wallarm.com/api-protection/enumeration-attack-protection.md) (by mitigation control)
* [BOLA protection](https://docs.wallarm.com/api-protection/enumeration-attack-protection.md) (by mitigation control)
* [Forced browsing protection](https://docs.wallarm.com/api-protection/enumeration-attack-protection.md) (by mitigation control)
* [DoS protection](https://docs.wallarm.com/api-protection/dos-protection.md) (by mitigation control)
Attacks of the same types found by old tools like [rules](https://docs.wallarm.com/user-guides/rules/rules.md), can be found both in **Attacks** and **API Sessions**
## False positives
False positive occurs when [attack signs](https://docs.wallarm.com/about-wallarm/protecting-against-attacks.md#basic-set-of-detectors) are detected in the legitimate request.
To prevent the filtering node from recognizing such requests as attacks in future, **you can mark all or specific requests of the attack as false positives**. This automatically creates a rule to skip similar attack sign detection in similar requests, though it does not appear in the Wallarm Console.
You can undo a false positive mark only within a few seconds after the mark was applied. If you decided to undo it later, this can be done only by sending a request to [Wallarm technical support](mailto: support@wallarm.com).
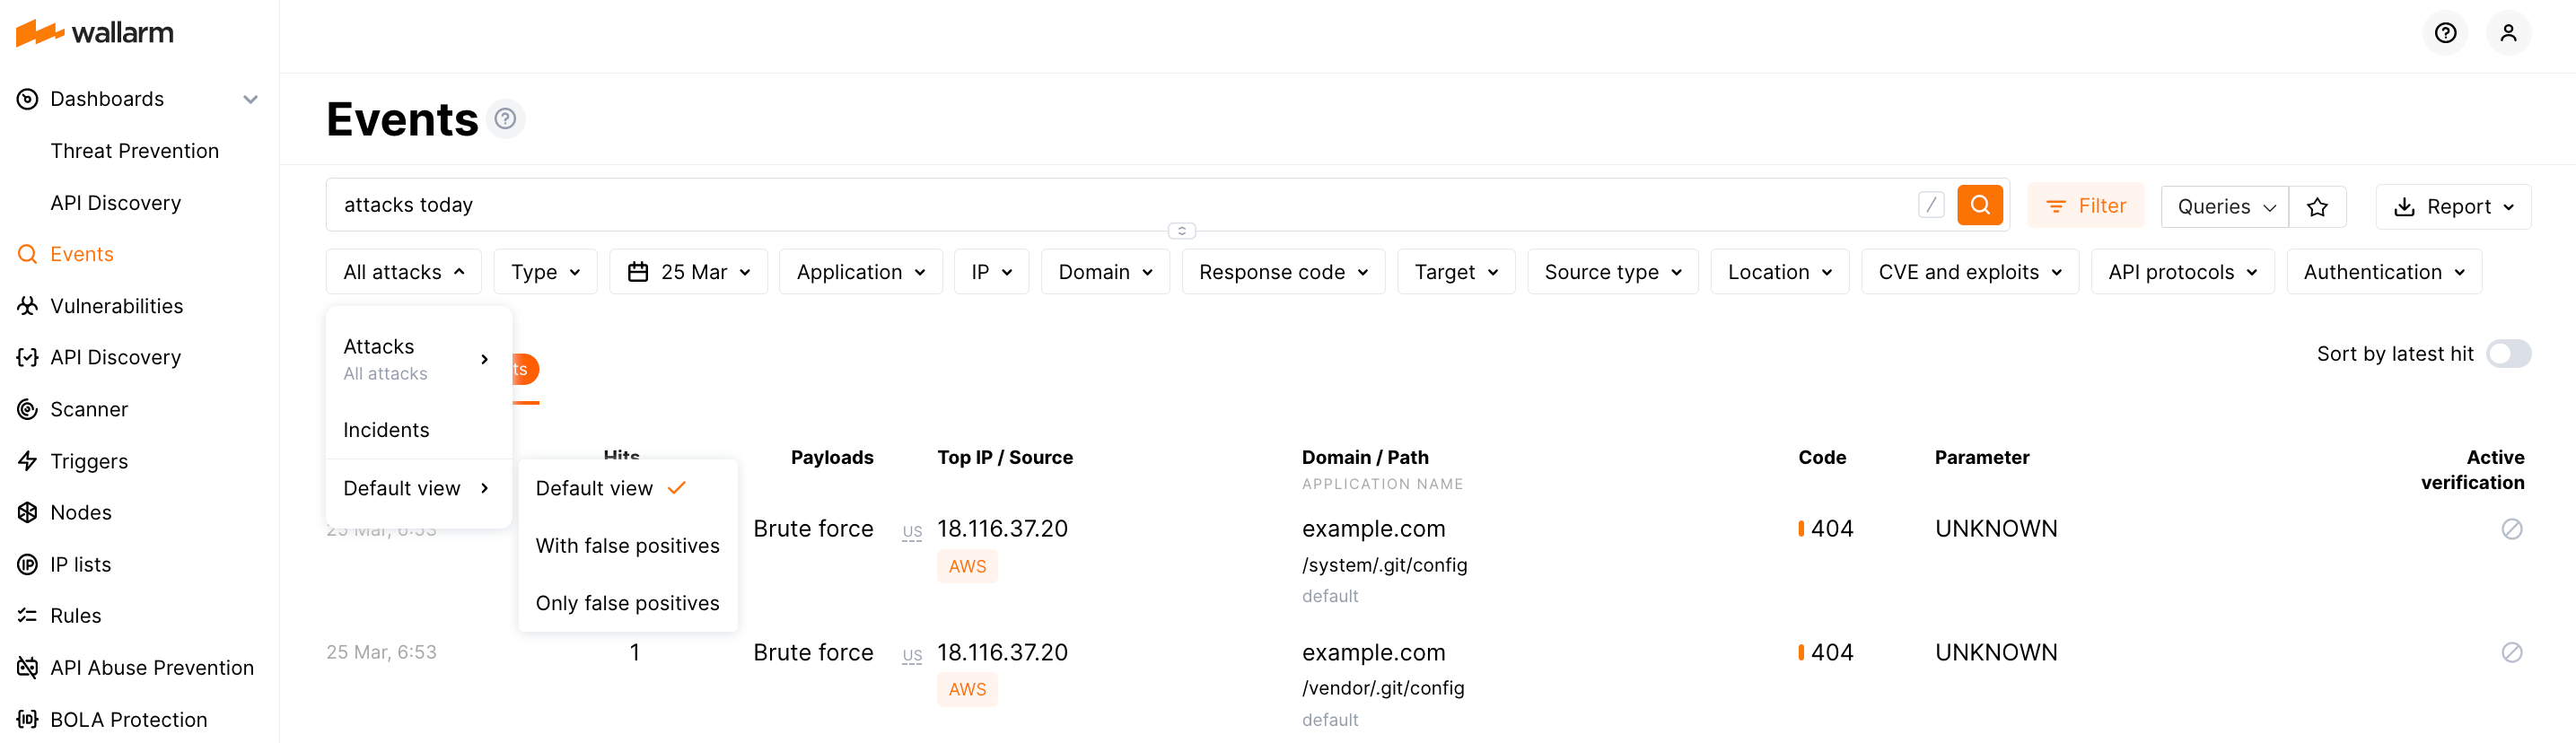
The default view of the attack list presents only actual attacks (without false positives) - to change that, under **All attacks** switch from **Default view** to **With false positives** or **Only false positives**.
See details on false positives [here](https://docs.wallarm.com/about-wallarm/protecting-against-attacks.md#false-positives).
## Responding to attacks
Is is important to understand if your applications and APIs are properly protected from the attacks to have the possibility to adjust the protection measures if necessary. You can use information from the **Attacks** section to get this understanding and respond correspondingly.
When dealing with this task, you will need to identify what type of attack took place, this will give you an understanding of what Wallarm's mechanisms provided protection and then adjust these mechanisms if necessary:
1. **Identify** - in the **Payload** field context menu, select **Show only**, then pay attention to the **Type** filter and search field content.
1. Check what was done for protection - note the **Status** column:
* `Blocked` - all hits of the attack were blocked by the filtering node.
* `Partially blocked` - some hits of the attack were blocked and others were only registered.
* `Monitoring` - all hits of the attack were registered but not blocked.
* `Bot detected` - this is bot, check action within the attack.
1. Optionally (recommended), [investigate the full context](#full-context-of-threat-actor-activities) of the attack's malicious requests: to which [user session](https://docs.wallarm.com/api-sessions/overview.md) they belong and what the full sequence of requests in this session is.
This allows seeing all activity and logic of the threat actor and understanding attack vectors and what resources can be compromised.
1. If you think it was not an actual attack, mark it [false positive](#false-positives).
1. **Understand** - become aware of the Wallarm mechanism that detected and reacted to attack.
1. **Adjust** - tune the Wallarm's behavior ("how" depends on mechanism).
| Identify | Understand | Adjust |
| -- | -- | -- |
| `sqli`, `xss`, `rce`, `ptrav`, `crlf`, `nosqli`, `ssi` [etc.](https://docs.wallarm.com/user-guides/search-and-filters/use-search.md#search-by-attack-type) | [Standard tools for attack detection](https://docs.wallarm.com/about-wallarm/protecting-against-attacks.md#tools-for-attack-detection) (libproton, libdetection and rules) | Expand an attack and explore [CVEs](https://docs.wallarm.com/demo-videos/events-inspection.md) summary for the attack and CVEs for separate requests. Pay your attention to the node mode (`final_wallarm_mode` tag), visit **Rules** ([US](https://us1.my.wallarm.com/rules) or [EU](https://my.wallarm.com/rules)), analyze them by application name from the attack. If necessary, adjust the rules or [filtration mode](https://docs.wallarm.com/admin-en/configure-wallarm-mode.md#available-filtration-modes) for applications or their specific hosts or endpoints. |
| [`custom_rule`](https://docs.wallarm.com/user-guides/search-and-filters/use-search.md#search-by-regexp-based-customer-rule) | [Custom attack detector](https://docs.wallarm.com/user-guides/rules/regex-rule.md) | Expand an attack and follow the **Detected by custom rules** link(s) - if necessary, [modify](https://docs.wallarm.com/user-guides/rules/regex-rule.md) the rule(s) including [partial disabling](https://docs.wallarm.com/user-guides/rules/regex-rule.md#partial-disabling) it for particular branches. |
| `vpatch` | [Virtual patch](https://docs.wallarm.com/user-guides/rules/vpatch-rule.md) | Visit the **Rules** section ([US](https://us1.my.wallarm.com/rules) or [EU](https://my.wallarm.com/rules)), search for "Create virtual patch" rules, if necessary, adjust the rule related to your attack. Have in mind that virtual patches work regardless of the filtration mode. |
| `brute`,
`dirbust`,
`bola`,
`multiple_payloads` | [Trigger](https://docs.wallarm.com/user-guides/triggers/triggers.md) and IP lists: [requests from denylisted IPs](https://docs.wallarm.com/user-guides/ip-lists/overview.md#requests-from-denylisted-ips) | Expand an attack and after analyzing the requests, click the displayed trigger name (if presented) and modify its parameters. Also note trigger tags, then go to **Triggers** ([US](https://us1.my.wallarm.com/triggers) or [EU](https://my.wallarm.com/triggers)) and find trigger by name, if necessary - adjust it.
If action is [`Blocked`](https://docs.wallarm.com/user-guides/ip-lists/overview.md#requests-from-denylisted-ips), this is done via denylist - go to **IP Lists** ([US](https://us1.my.wallarm.com/ip-lists) or [EU](https://my.wallarm.com/ip-lists)) and search by IP: if necessary, adjust time period for IP staying in denylist. |
| `blocked_source` | IP lists: [requests from denylisted IPs](https://docs.wallarm.com/user-guides/ip-lists/overview.md#requests-from-denylisted-ips) | Expand an attack and analyze requests from denylisted IP; after that, click the displayed trigger name and - if necessary - modify trigger settings. For manually denylisted IPs (`blocked_source`), go to **IP Lists** ([US](https://us1.my.wallarm.com/ip-lists) or [EU](https://my.wallarm.com/ip-lists)) and search by IP: if necessary, adjust time period for IP staying in denylist. |
| **Specific module or function:** |
| `api_abuse`, `account_takeover`, `security_crawlers`, `scraping`, `resource_consumption` ([details](https://docs.wallarm.com/attacks-vulns-list.md#api-abuse))
- note the **Bot detected** status for all | [API Abuse Prevention](https://docs.wallarm.com/api-abuse-prevention/overview.md) and IP lists: [requests from denylisted IPs](https://docs.wallarm.com/user-guides/ip-lists/overview.md#requests-from-denylisted-ips) | Expand an attack and analyze the [heatmaps](https://docs.wallarm.com/api-abuse-prevention/exploring-bots.md#attacks) proving the [confidence](https://docs.wallarm.com/api-abuse-prevention/overview.md#how-api-abuse-prevention-works) that it is a bot, note the date of the attack and source IP.
If action is [`Blocked`](https://docs.wallarm.com/user-guides/ip-lists/overview.md#requests-from-denylisted-ips), this is done via denylist - go to **IP lists**, filter by date and IP, click **Reason** column to see IP address details, explore these details, click **Triggered profile**, explore it and [change](https://docs.wallarm.com/api-abuse-prevention/setup.md#creating-profiles) if necessary.
**Also, you can**:
- [Add source IP to exception list](https://docs.wallarm.com/api-abuse-prevention/exceptions.md) for this IP never to be blocked. Also, you can remove IP from exception list (navigate to **API Abuse Prevention** → **Exception list**)
- Add source IP to denylist, even if API abuse configuration is not supposed to do it automatically.
**Additionally you can**: In **IP Lists**, click the IP address itself to go back to **Events** and see all related attacks.|
| `bola` | [BOLA protection by either the trigger or mitigation control](https://docs.wallarm.com/admin-en/configuration-guides/protecting-against-bola-trigger.md) | Expand an attack and after analyzing the requests, click the displayed trigger name (if presented) and modify its parameters. Also note trigger tags, then go to **Triggers** ([US](https://us1.my.wallarm.com/triggers) or [EU](https://my.wallarm.com/triggers)) and find trigger by name, if necessary - adjust it.
If action is [`Blocked`](https://docs.wallarm.com/user-guides/ip-lists/overview.md#requests-from-denylisted-ips), this is done via denylist - go to **IP Lists** ([US](https://us1.my.wallarm.com/ip-lists) or [EU](https://my.wallarm.com/ip-lists)) and search by IP: if necessary, adjust time period for IP staying in denylist. |
| `undefined_endpoint`, `undefined_parameter`, `invalid_parameter_value`, `missing_parameter`, `missing_auth`, `invalid_request` (`api_specification` to search for all of them, [details](https://docs.wallarm.com/attacks-vulns-list.md#api-specification)) | [API Specification Enforcement](https://docs.wallarm.com/api-specification-enforcement/overview.md) | Expand an attack and follow the link to the violated specification. At the specification dialog, use the **API specification enforcement** tab to adjust settings, consider uploading the latest version of specification via the **Specification upload** tab. |
| `gql_doc_size`, `gql_value_size`, `gql_depth`, `gql_aliases`, `gql_docs_per_batch`, `gql_introspection`, `gql_debug` (`graphql_attacks` to search for all of them, [details](https://docs.wallarm.com/attacks-vulns-list.md#graphql-attacks)) | [GraphQL API Protection](https://docs.wallarm.com/api-protection/graphql-rule.md) | Expand an attack and follow the **GraphQL security policies** link - if necessary, modify existing **Detect GraphQL attacks** rule(s) or create additional ones for particular branches. |
| `credential_stuffing` | [Credential Stuffing Detection](https://docs.wallarm.com/about-wallarm/credential-stuffing.md) | Expand an attack and check the list of compromised credentials that were tried to be used, navigate to the Credential Stuffing ([US](https://us1.my.wallarm.com/credential-stuffing), [EU](https://my.wallarm.com/credential-stuffing), or [ME](https://me1.my.wallarm.com/credential-stuffing) Cloud) section and check [configuration](https://docs.wallarm.com/about-wallarm/credential-stuffing.md#configuring), specifically, the list of monitored authentication endpoints and recommendations for that list, and configured notifications about compromised credentials. |
## Dashboards
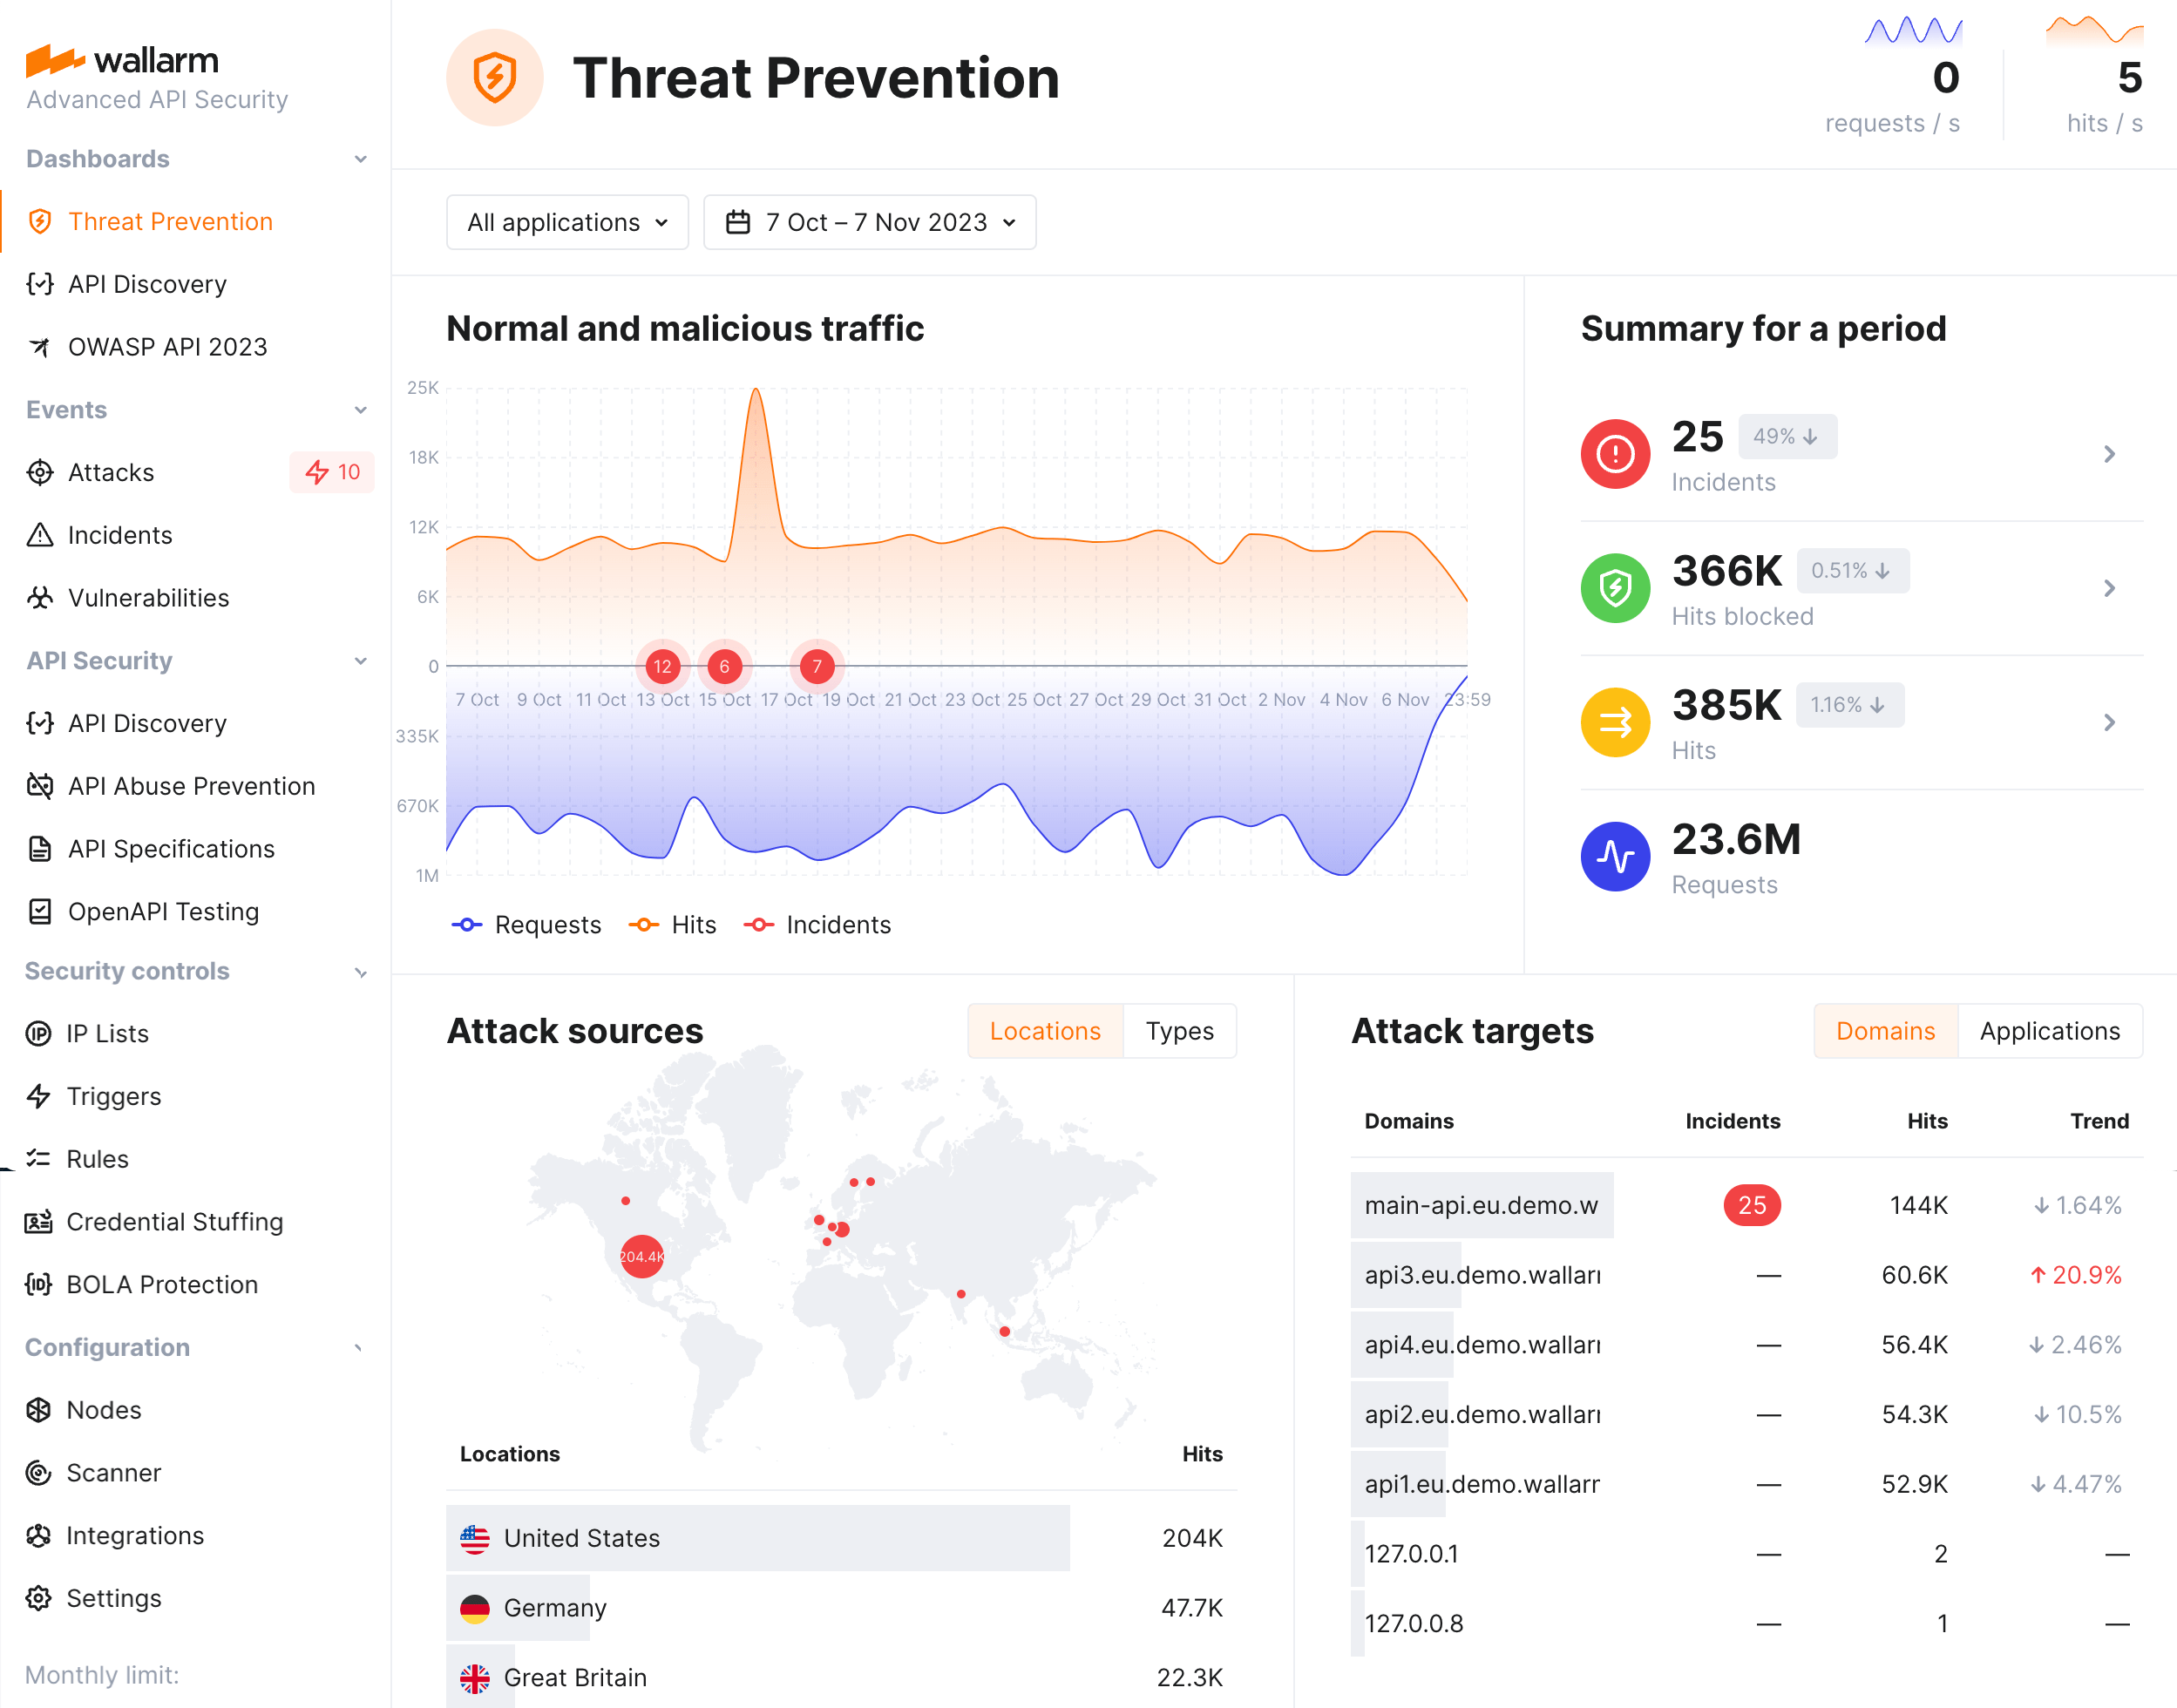
Wallarm provides comprehensive dashboards to help you analyze detected attacks.
Wallarm's [Threat Prevention](https://docs.wallarm.com/user-guides/dashboards/threat-prevention.md) dashboard provides general metrics on your system's security posture, including multi-aspect information about attacks: their sources, targets, types and protocols.
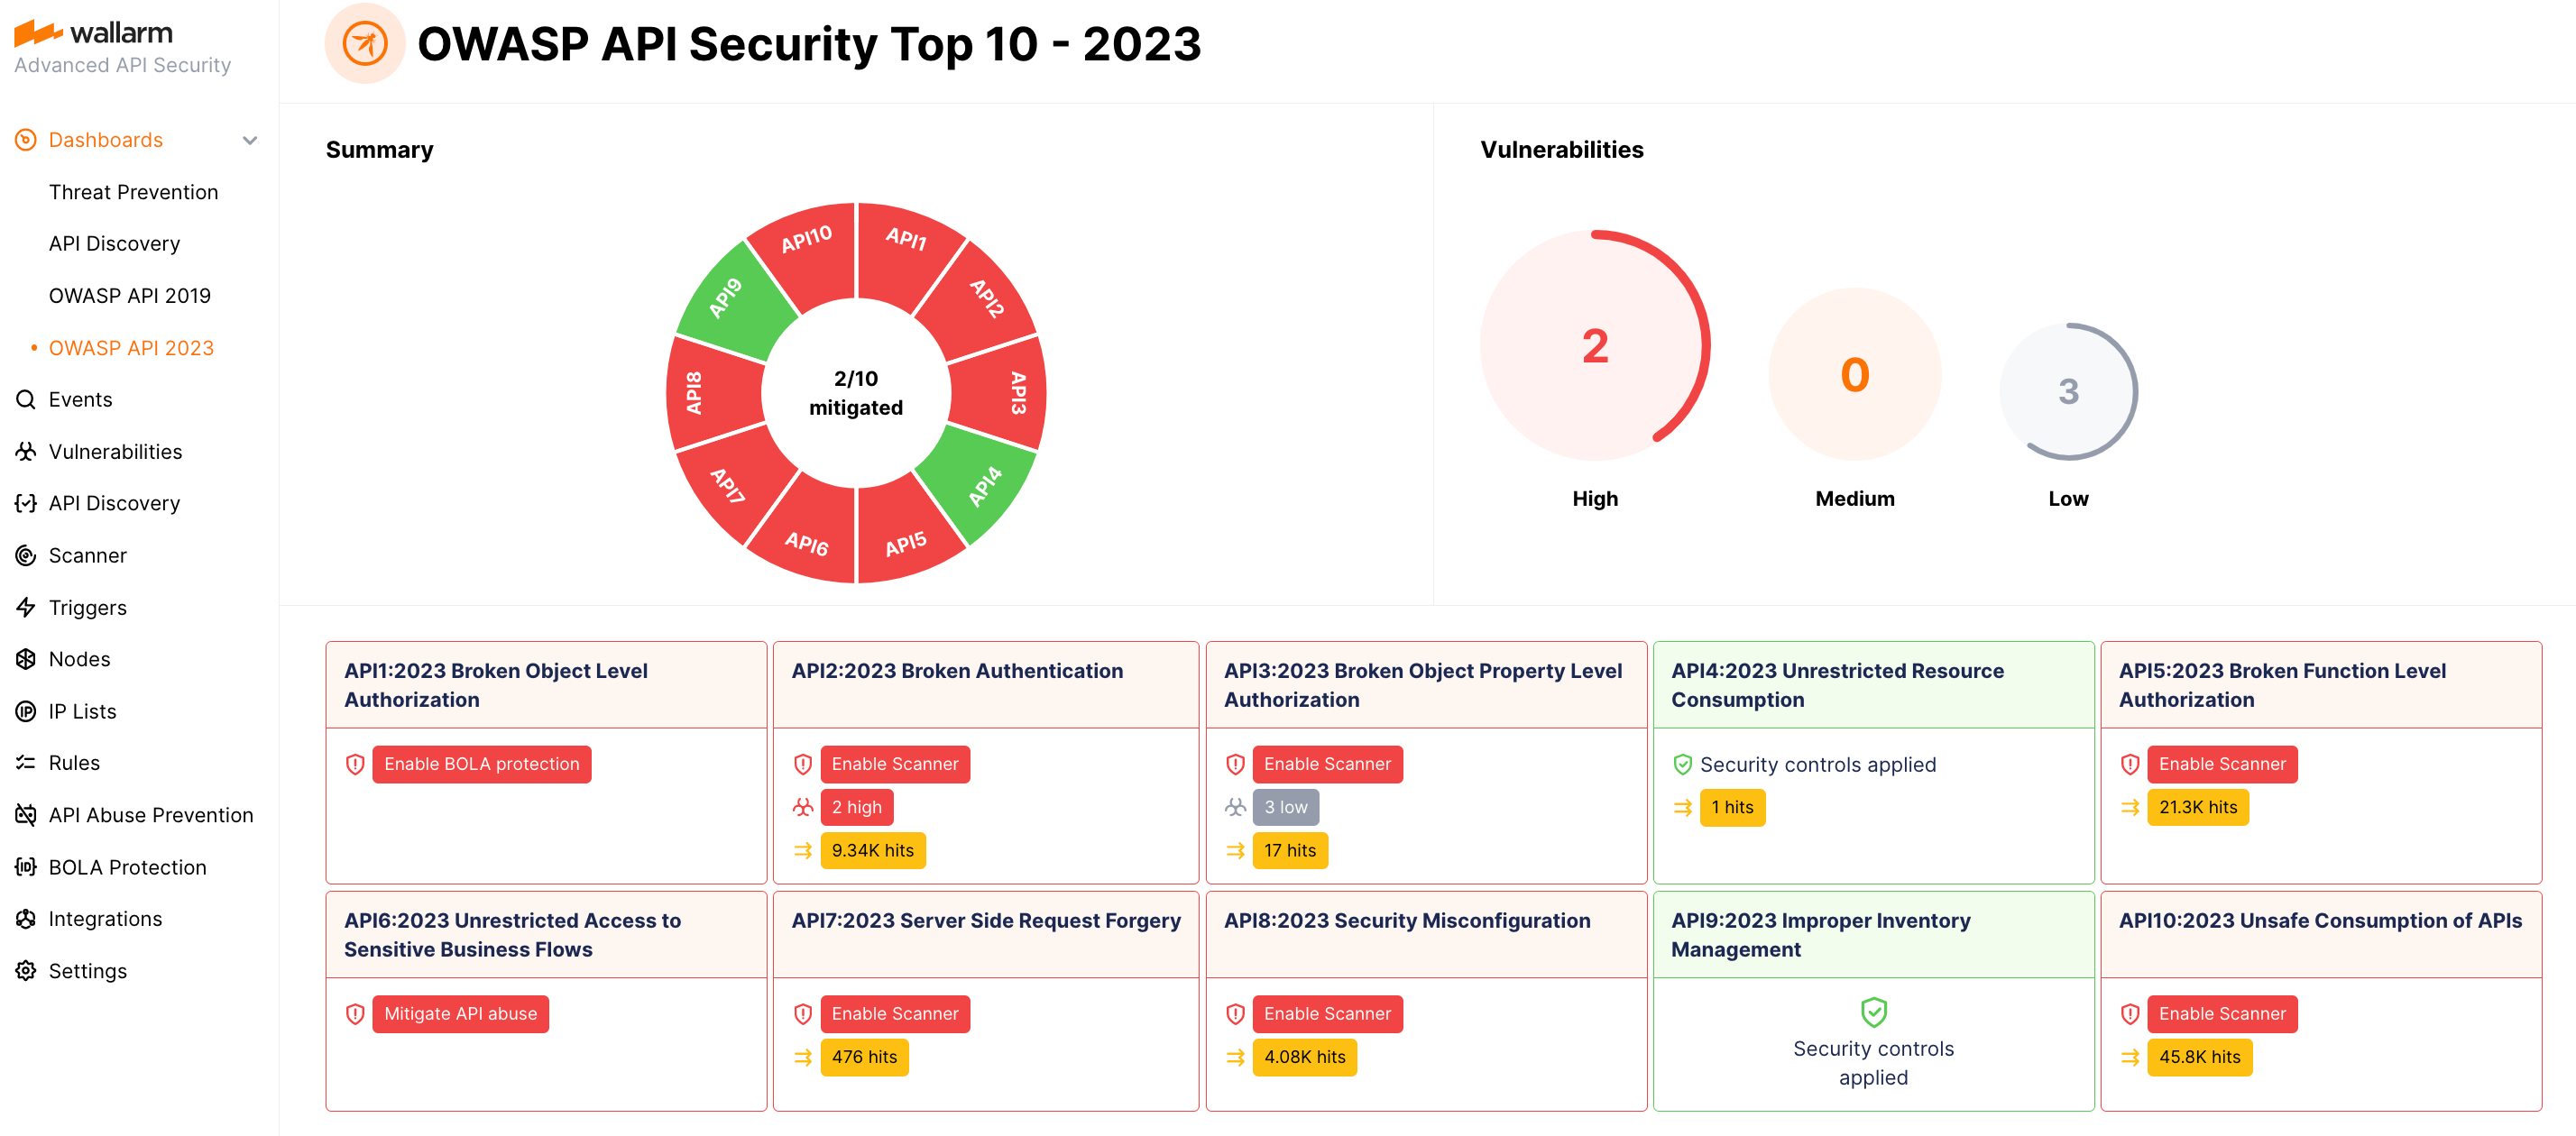
The [OWASP API Security Top 10](https://docs.wallarm.com/user-guides/dashboards/owasp-api-top-ten.md) dashboard provides detailed visibility into your system's security posture against the OWASP API Top 10 threats, including attack information.
## Notifications
Wallarm can send you notifications on detected attacks, hits and malicious payloads. It allows you to be aware of attempts to attack your system and analyze detected malicious traffic promptly. Analyzing malicious traffic includes reporting false positives, allowlisting IPs originating legitimate requests and denylisting IPs of attack sources.
To configure notifications:
1. Configure [native integrations](https://docs.wallarm.com/user-guides/settings/integrations/integrations-intro.md) with the systems to send notifications (e.g. PagerDuty, Opsgenie, Splunk, Slack, Telegram).
2. Set the conditions for sending notifications:
* To get notifications on each detected hit, select the appropriate option in the integration settings.
??? info "See the example of the notification about detected hit in the JSON format"
```json
[
{
"summary": "[Wallarm] New hit detected",
"details": {
"client_name": "TestCompany",
"cloud": "EU",
"notification_type": "new_hits",
"hit": {
"domain": "www.example.com",
"heur_distance": 0.01111,
"method": "POST",
"parameter": "SOME_value",
"path": "/news/some_path",
"payloads": [
"say ni"
],
"point": [
"post"
],
"probability": 0.01,
"remote_country": "PL",
"remote_port": 0,
"remote_addr4": "8.8.8.8",
"remote_addr6": "",
"tor": "none",
"request_time": 1603834606,
"create_time": 1603834608,
"response_len": 14,
"response_status": 200,
"response_time": 5,
"stamps": [
1111
],
"regex": [],
"stamps_hash": -22222,
"regex_hash": -33333,
"type": "sqli",
"block_status": "monitored",
"id": [
"hits_production_999_202010_v_1",
"c2dd33831a13be0d_AC9"
],
"object_type": "hit",
"anomaly": 0
}
}
}
]
```
* To set the threshold of attack, hit or malicious payload number and get notifications when the threshold is exceeded, configure appropriate [triggers](https://docs.wallarm.com/user-guides/triggers/triggers.md).
## API calls
To get the attack details, you can [call the Wallarm API directly](https://docs.wallarm.com/api/overview.md) besides using the Wallarm Console UI. Below is the example of the API call for **getting the first 50 attacks detected in the last 24 hours**.
Please replacing `TIMESTAMP` with the date 24 hours ago converted to the [Unix Timestamp](https://www.unixtimestamp.com/) format.
**US cloud:**
```{.bash .wrapped-code}
curl -v -X POST "https://us1.api.wallarm.com/v1/objects/attack" -H "X-WallarmApi-Token: " -H "accept: application/json" -H "Content-Type: application/json" -d "{ \"filter\": { \"clientid\": [YOUR_CLIENT_ID], \"time\": [[TIMESTAMP, null]] }, \"offset\": 0, \"limit\": 50, \"order_by\": \"last_time\", \"order_desc\": true}"
```
**EU cloud:**
```{.bash .wrapped-code}
curl -v -X POST "https://api.wallarm.com/v1/objects/attack" -H "X-WallarmApi-Token: " -H "accept: application/json" -H "Content-Type: application/json" -d "{ \"filter\": { \"clientid\": [YOUR_CLIENT_ID], \"time\": [[TIMESTAMP, null]] }, \"offset\": 0, \"limit\": 50, \"order_by\": \"last_time\", \"order_desc\": true}"
```
**ME Cloud:**
```{.bash .wrapped-code}
curl -v -X POST "https://me1.api.wallarm.com/v1/objects/attack" -H "X-WallarmApi-Token: " -H "accept: application/json" -H "Content-Type: application/json" -d "{ \"filter\": { \"clientid\": [YOUR_CLIENT_ID], \"time\": [[TIMESTAMP, null]] }, \"offset\": 0, \"limit\": 50, \"order_by\": \"last_time\", \"order_desc\": true}"
```
!!! warning "Getting 100 or more attacks"
For attack and hit sets containing 100 or more records, it is best to retrieve them in smaller pieces rather than fetching large datasets all at once, in order to optimize performance. [Explore the corresponding request example](https://docs.wallarm.com/api/request-examples.md#get-a-large-number-of-attacks-100-and-more)