Exploring API Inventory and MCP Servers  
As soon as the API Discovery module has built the catalog of your API endpoints and MCP servers, you can explore it in the API Discovery section of Wallarm Console. The section has two tabs: APIs for REST, GraphQL, SOAP, and gRPC endpoints, and MCP Servers for discovered MCP servers and their primitives. Learn from this article how to go through the discovered data.
API endpoints
Explore your discovered API endpoints using the APIs tab of the API Discovery section in the US or EU Cloud.
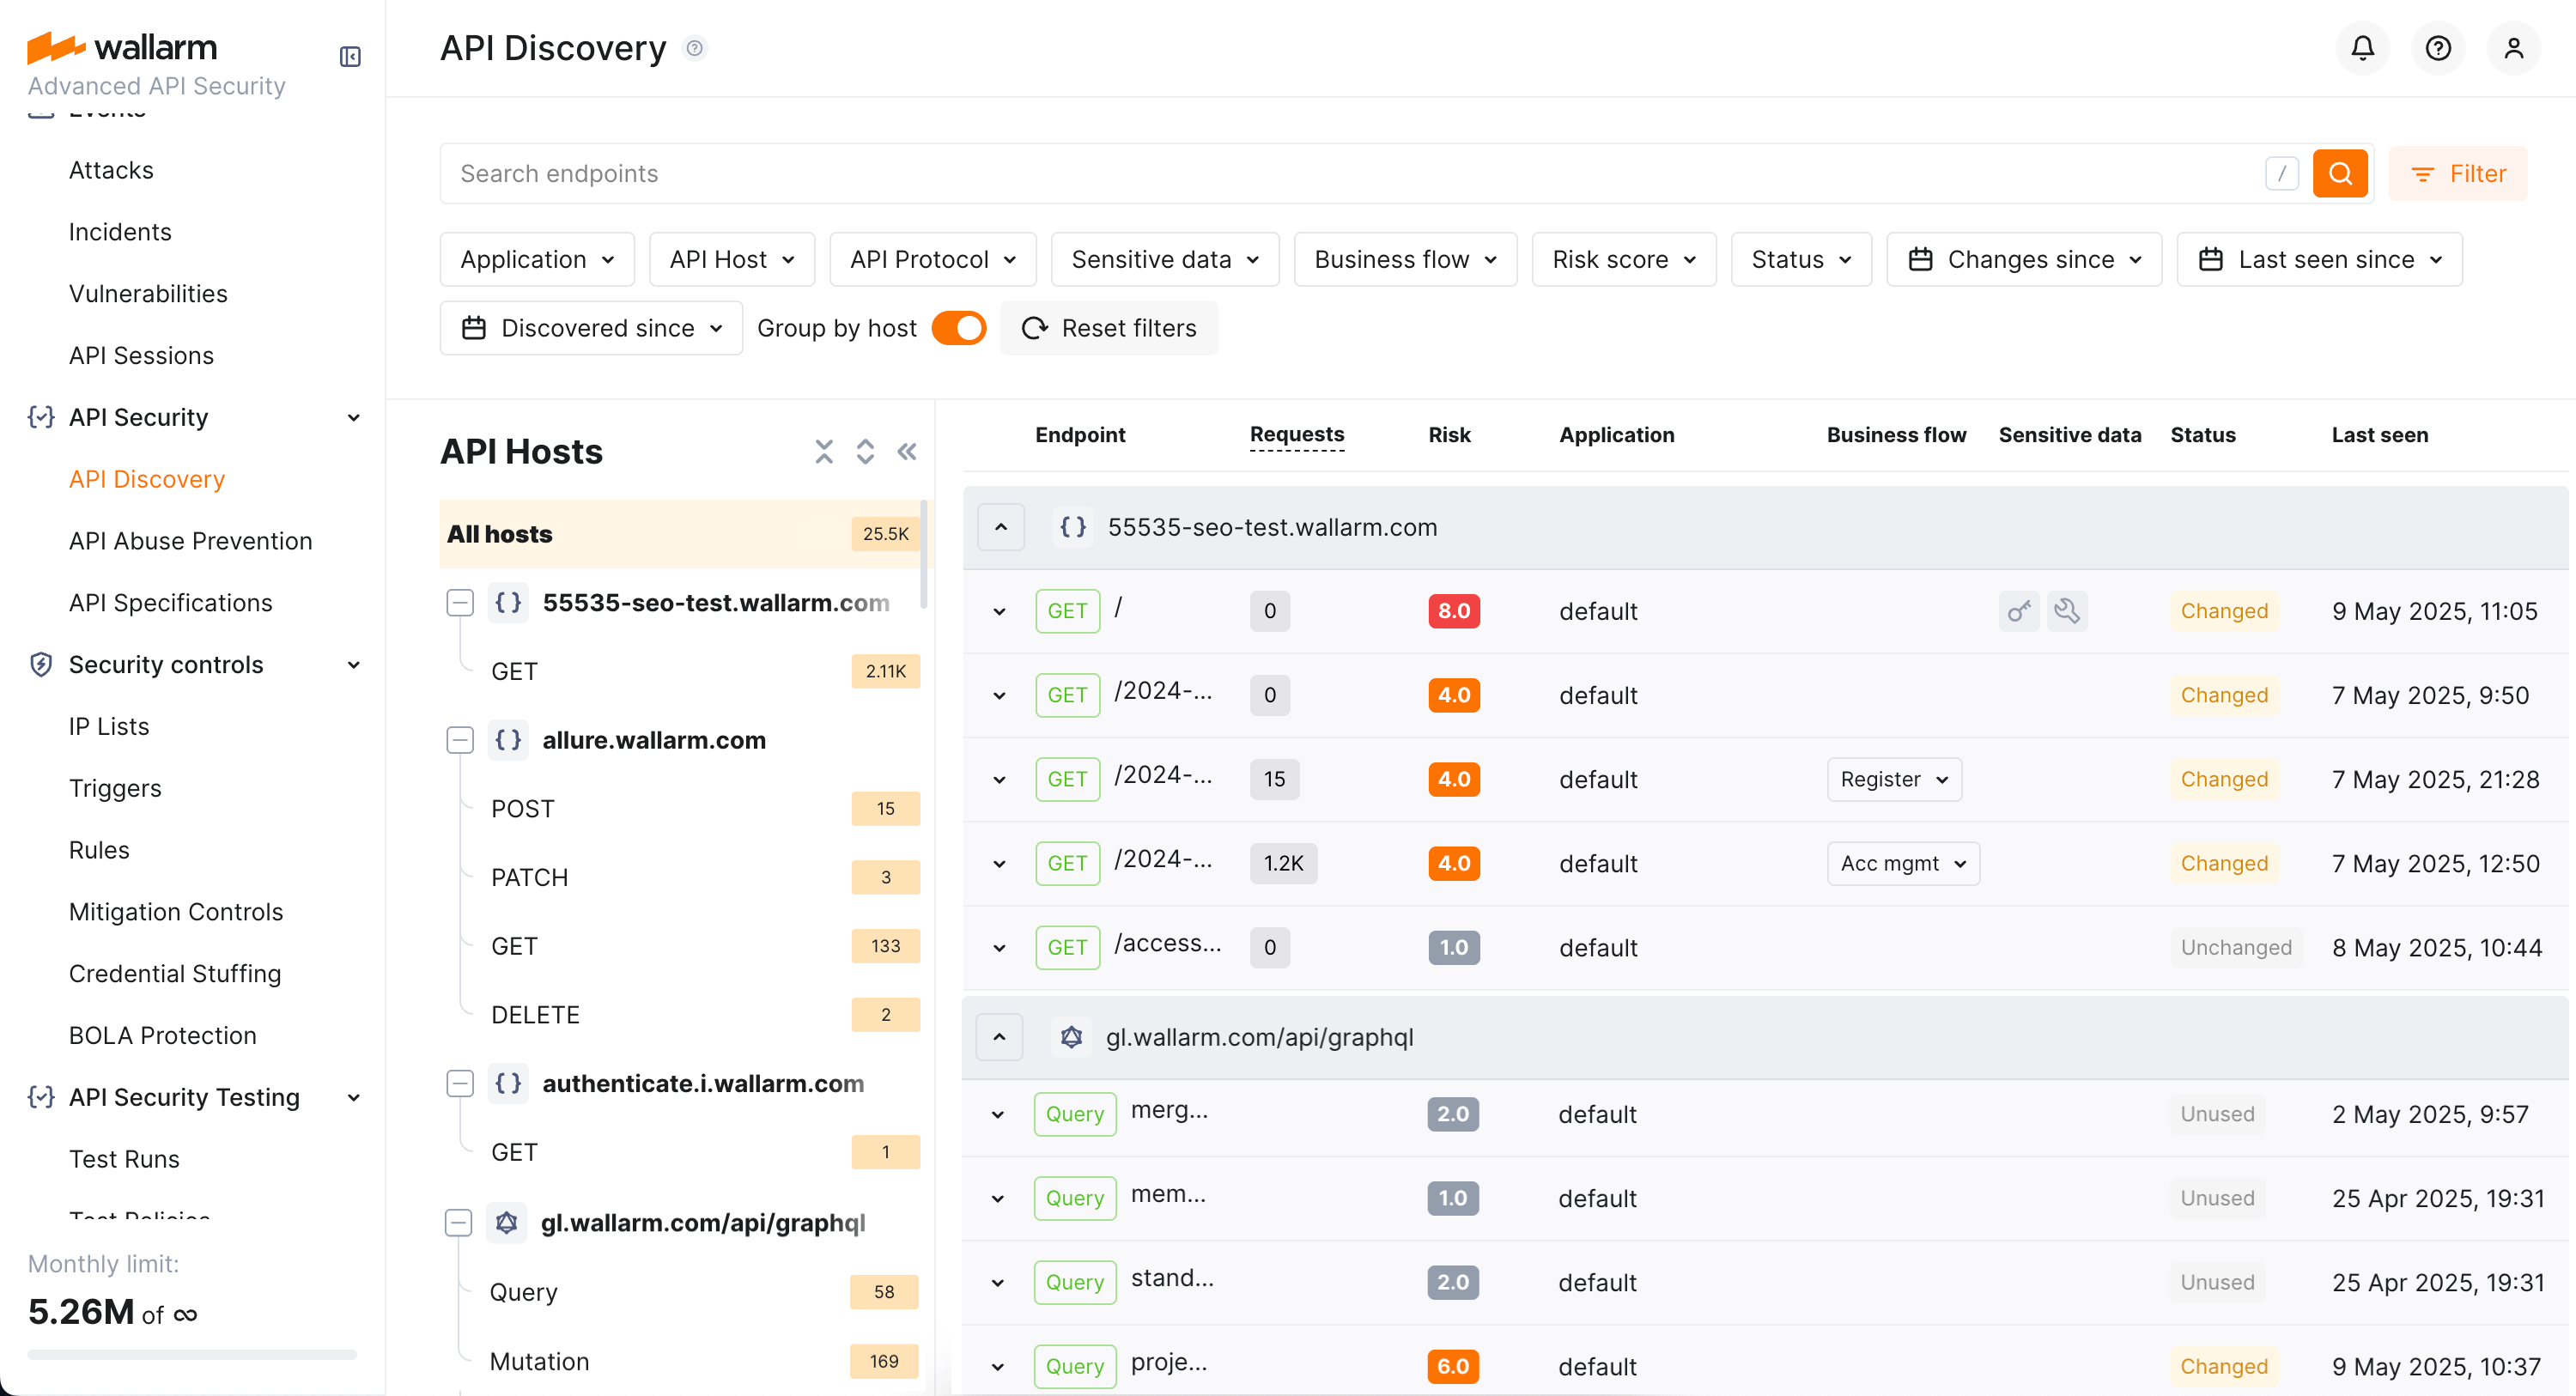
By default, endpoints and operations are sorted by host/endpoint or operation name. Also, Group by host is on. With grouping by host disabled, you can sort endpoints by risk.
Filtering
Among a wide range of API endpoint filters, you can choose the ones corresponding to your analysis purpose, e.g.:
-
Find the endpoints characterized with the highest risk level to analyze and mitigate the risks.
-
Find the endpoints that have security issues (vulnerabilities) by severity: use the Vulnerabilities filter to narrow by Critical, High, Medium, or Low.
-
Find endpoints related to a specific application.
-
Find the endpoints that have been changed or newly discovered in the last week and that process PII data. This kind of request can help you to stay up to date with critical changes in your APIs.
-
Find the endpoints being used to upload data to your server by the PUT or POST calls (REST) or mutations (GraphQL) (API protocols filter with methods for REST and operation types for GraphQL). Since such endpoints are a frequent attack target, they should be well secured. Using this kind of request you can check that endpoints are known to the team and are well secured from attacks.
-
Find the endpoints processing sensitive data to ensure they are properly secured.
-
Find the endpoints of a deprecated API version (e.g. by searching
/v1) and make sure that they are not used by clients. -
Find endpoints without authentication by using the Authentication filter and selecting No authentication. This helps identify potential security risks where endpoints may be unprotected.
Labeling
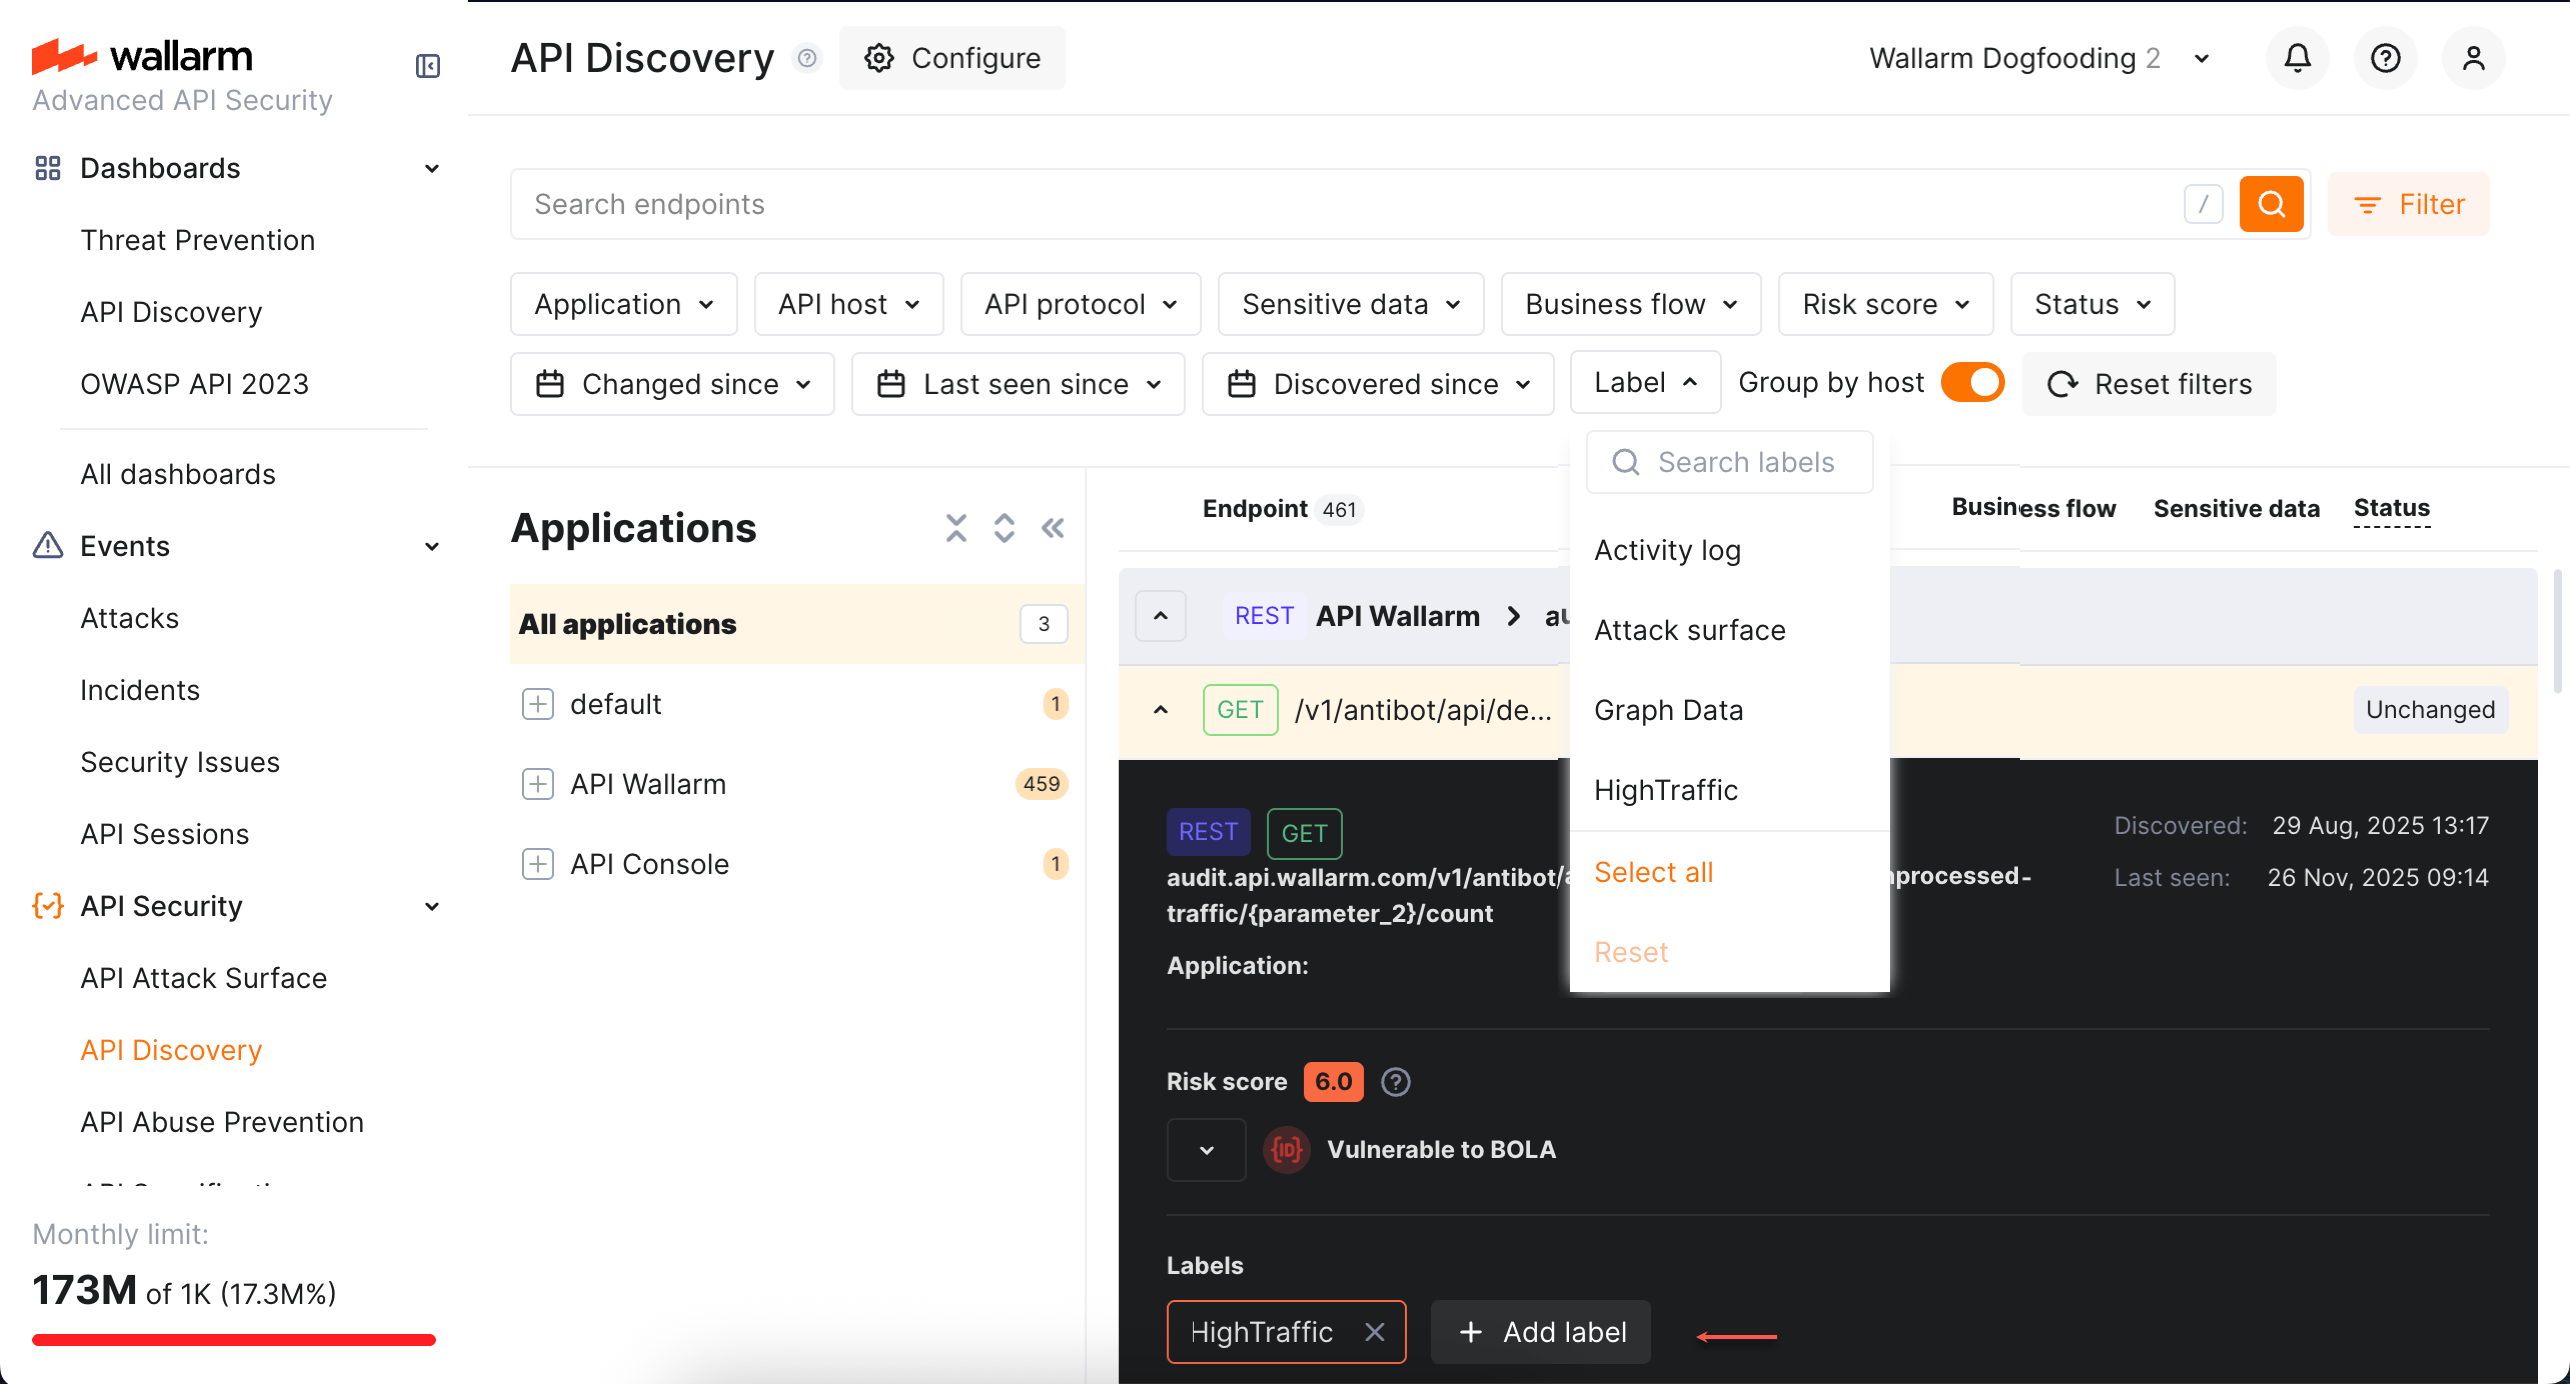
You can assign labels to endpoints to manage them more effectively.
To assign a label, open the endpoint's full-screen details page and click Assign label in the sidebar. You can choose from predefined labels (e.g., Critical, Identity service) or create your own custom labels.
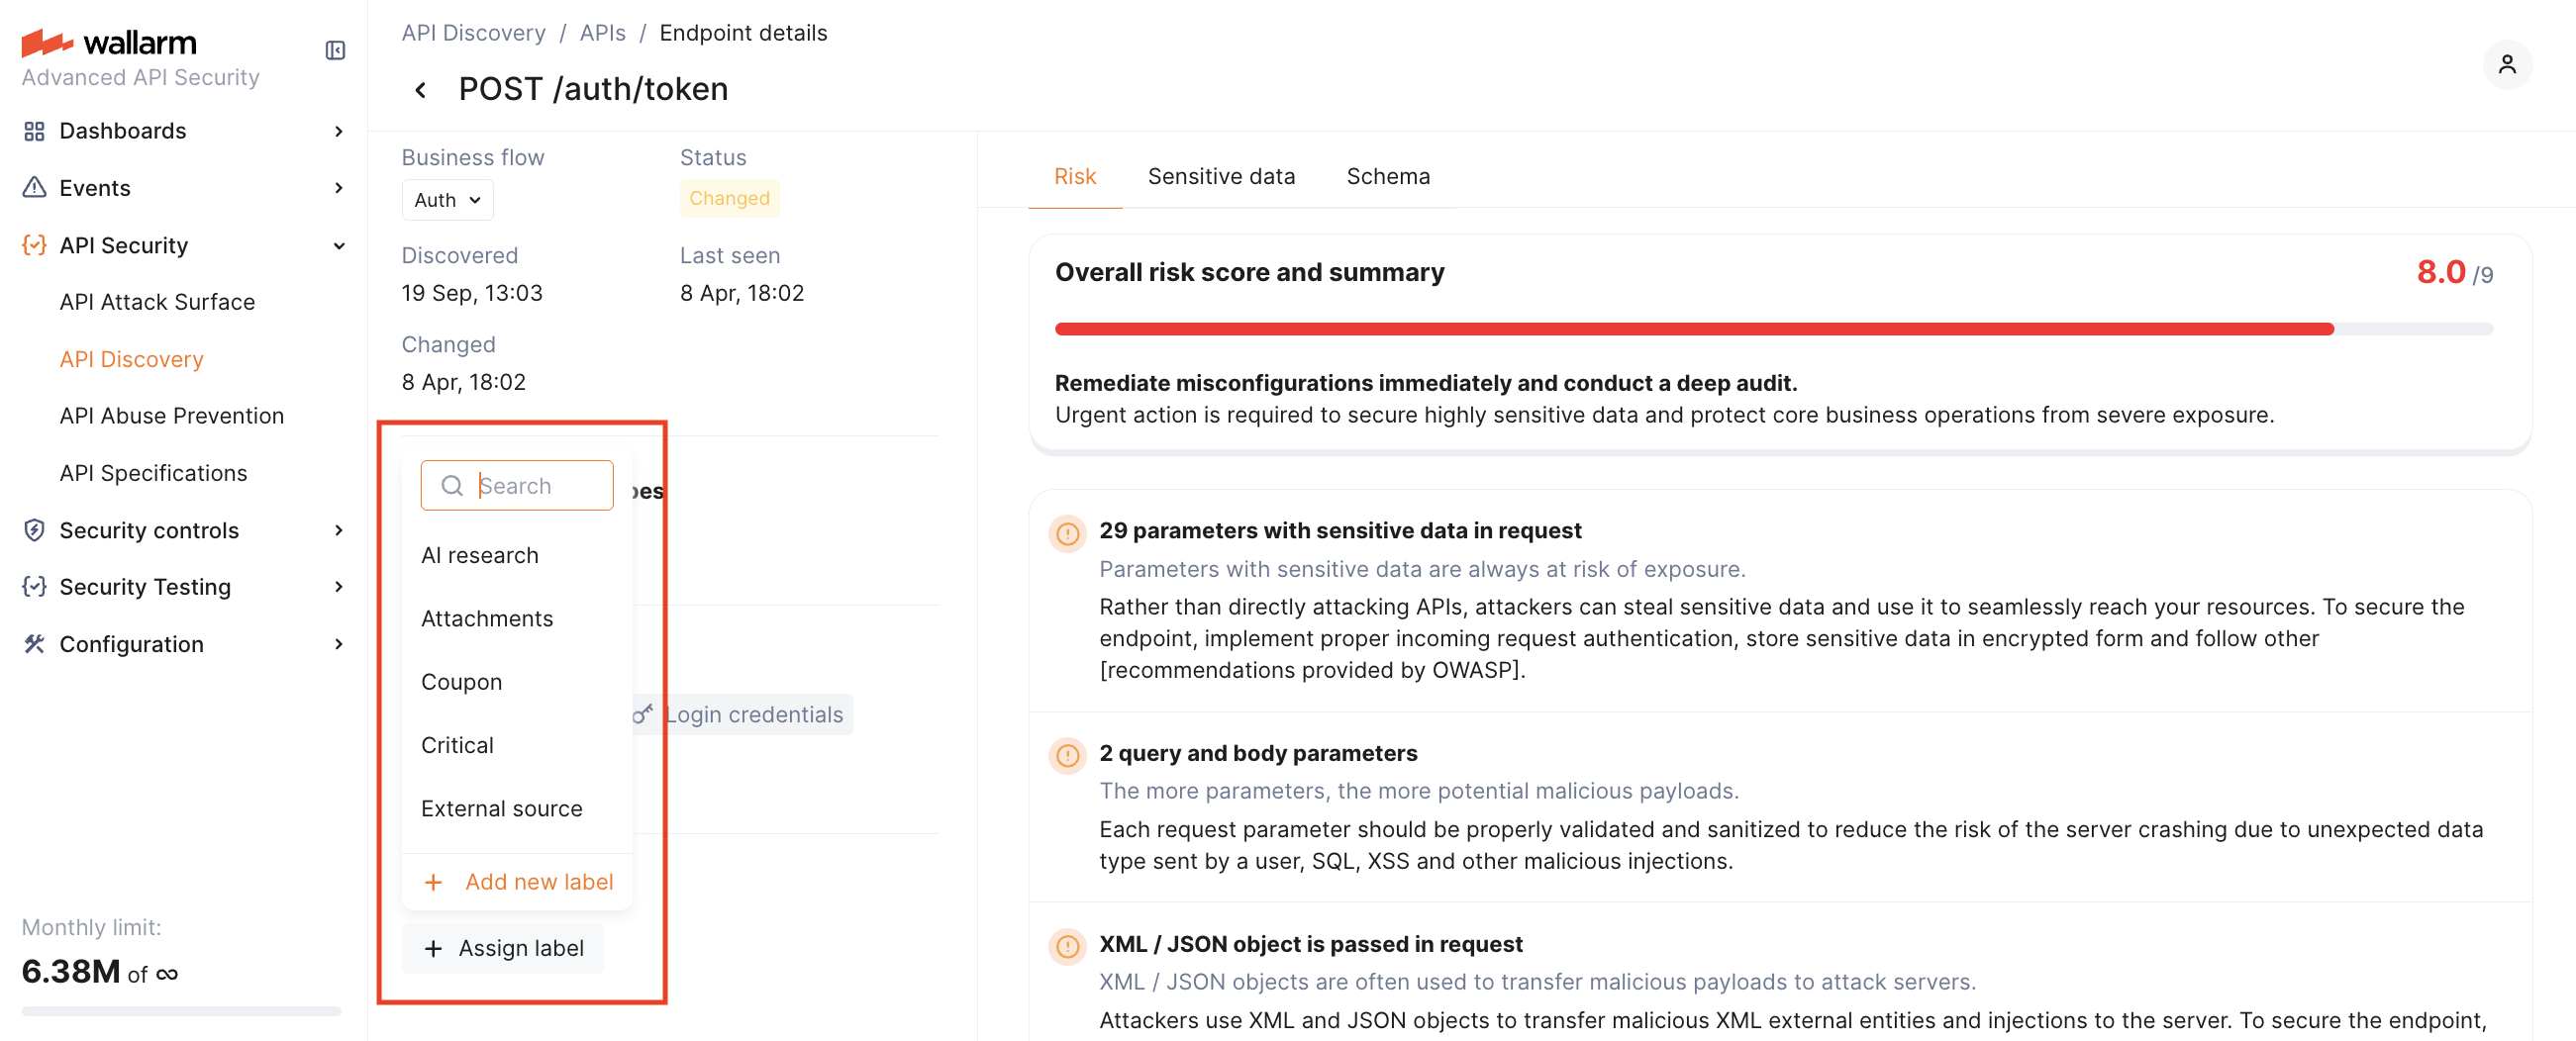
Once labels are assigned, use the Label filter to quickly search and isolate endpoints based on these custom labels.
Note that several labels can be assigned to the same endpoint.
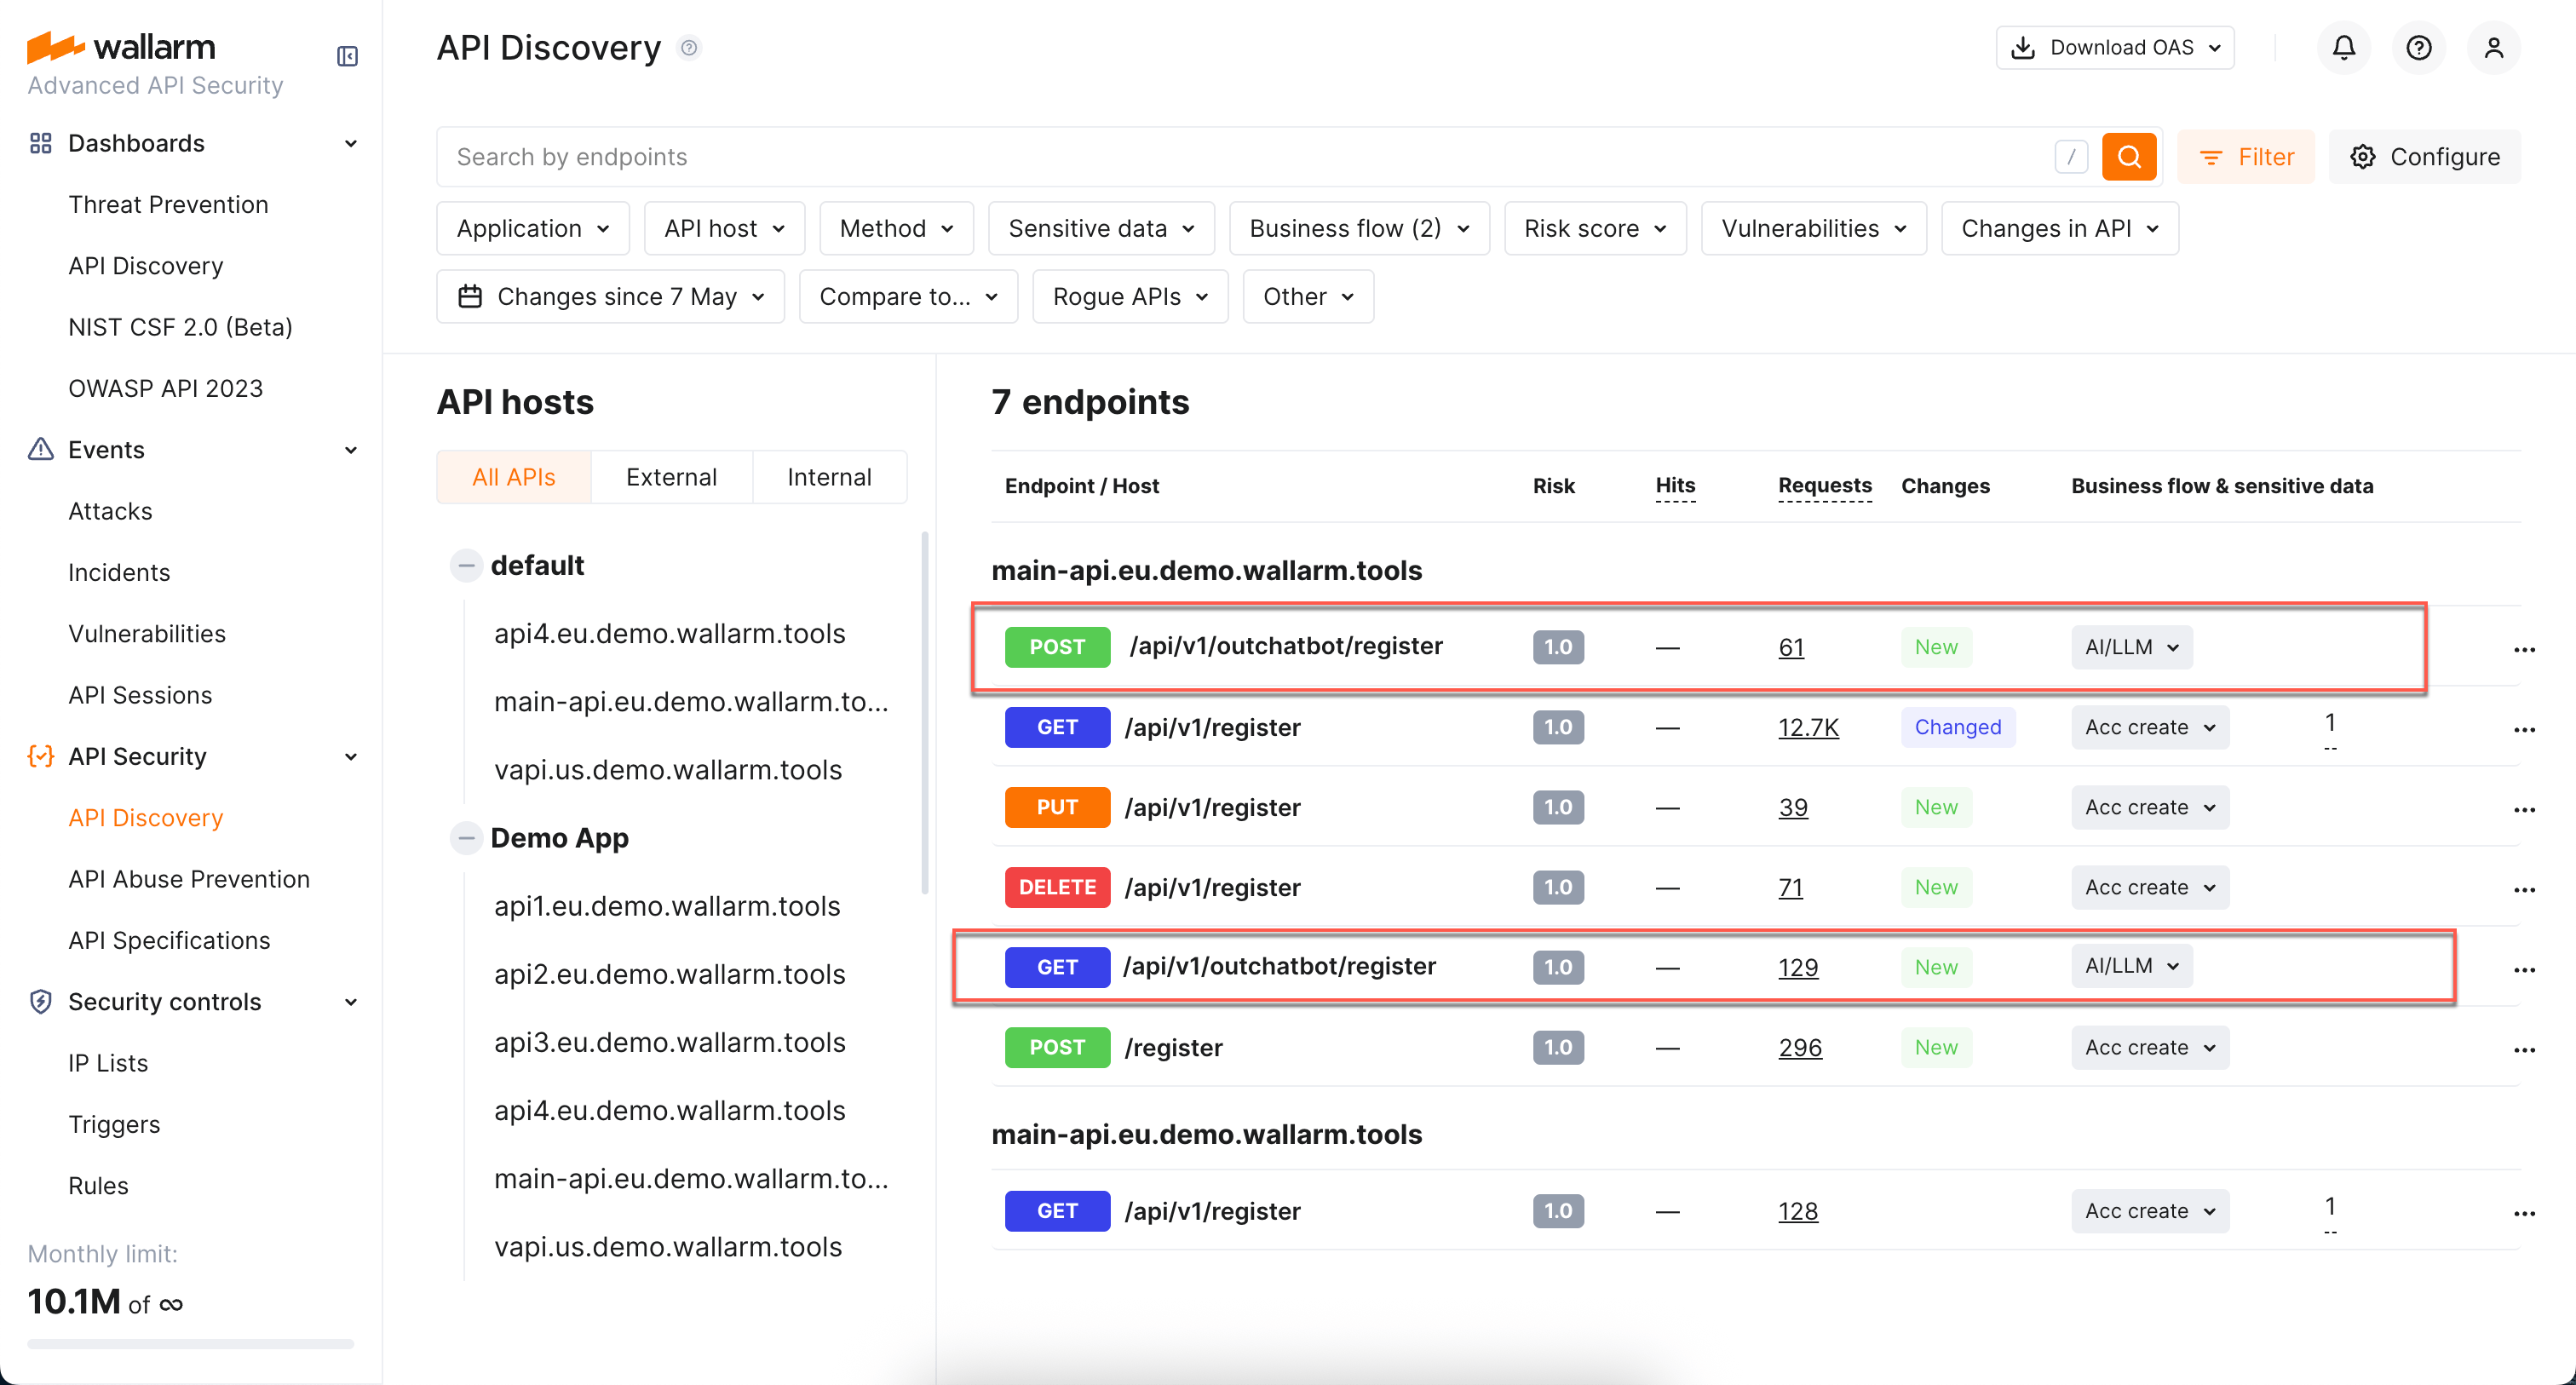
AI/LLM endpoints
Endpoints that talk to LLMs, ML models, chatbots, or third-party AI services (e.g., OpenAI) are automatically tagged with the AI/LLM sensitive business flow. Filter by Business flow → AI/LLM to see only AI-related endpoints.
You can also adjust the tag manually if automatic detection misses any.
Sessions that touch AI/LLM-tagged endpoints are themselves tagged with the AI/LLM business flow in API Sessions, so you can isolate user activity that exercises AI-backed APIs.
MCP Servers
The MCP Servers tab lists discovered Model Context Protocol servers alongside their primitives — tools, resources, and prompts.
MCP discovery requires NGINX Node 6.12.0 or Native Node 0.25.0. For all protocols and their required Node versions, see Supported protocols.
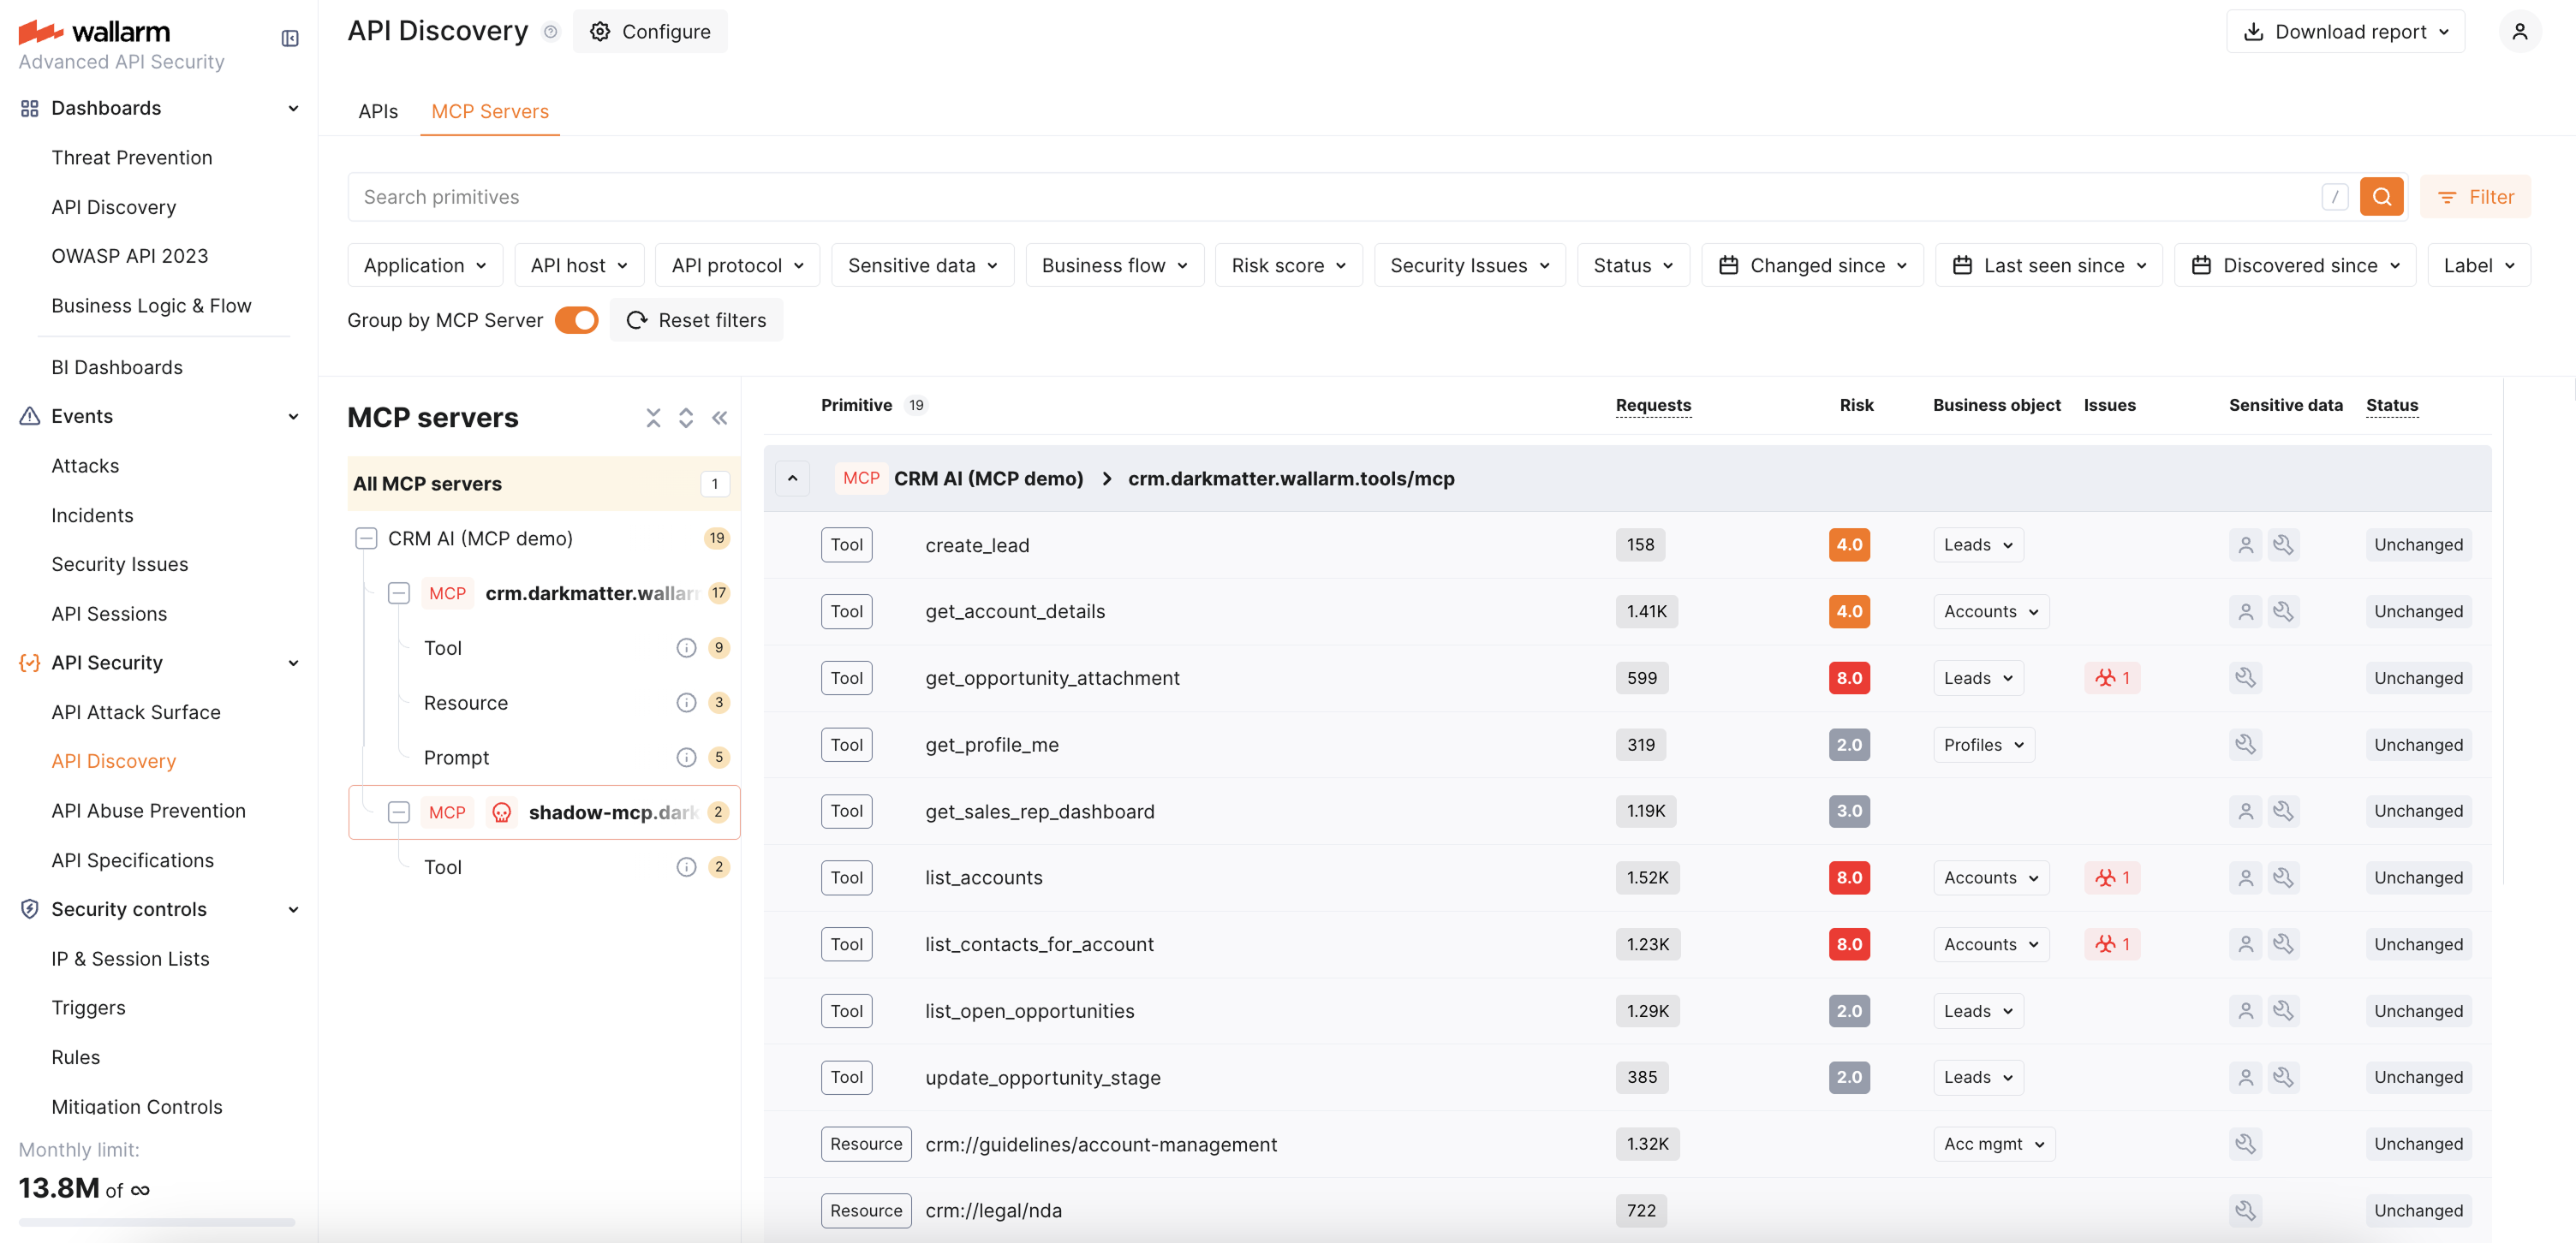
How detection works. The Wallarm node identifies MCP traffic by JSON-RPC 2.0 requests with MCP-specific methods. When detected, the MCP server is added to the MCP Servers tab, and the node automatically enables 100% response parsing for the MCP endpoint to capture the full schema from tools/list, resources/list, and prompts/list responses.
Within 30 minutes of discovering an MCP server, Wallarm automatically creates an MCP Session Configuration for it with default session-identification rules. Discovered MCP servers can also be used as the scope when creating MCP mitigation controls — ACL policies, request verification, and tool input schema enforcement.
For what is displayed for each MCP server and its primitives, see MCP primitive details below.
Details view
Clicking an endpoint, operation, or MCP primitive opens its details in a full-screen page.
Each details page has a unique URL that you can share with colleagues or clients for direct access.
When you navigate back from the details page, all your previously applied filters are preserved, so you can continue working with the filtered list without re-applying them.
REST endpoint details
Click the REST endpoint to open its full-screen details page, including transferred sensitive data, risk score and what contributes to it, headers and parameters of requests and responses:
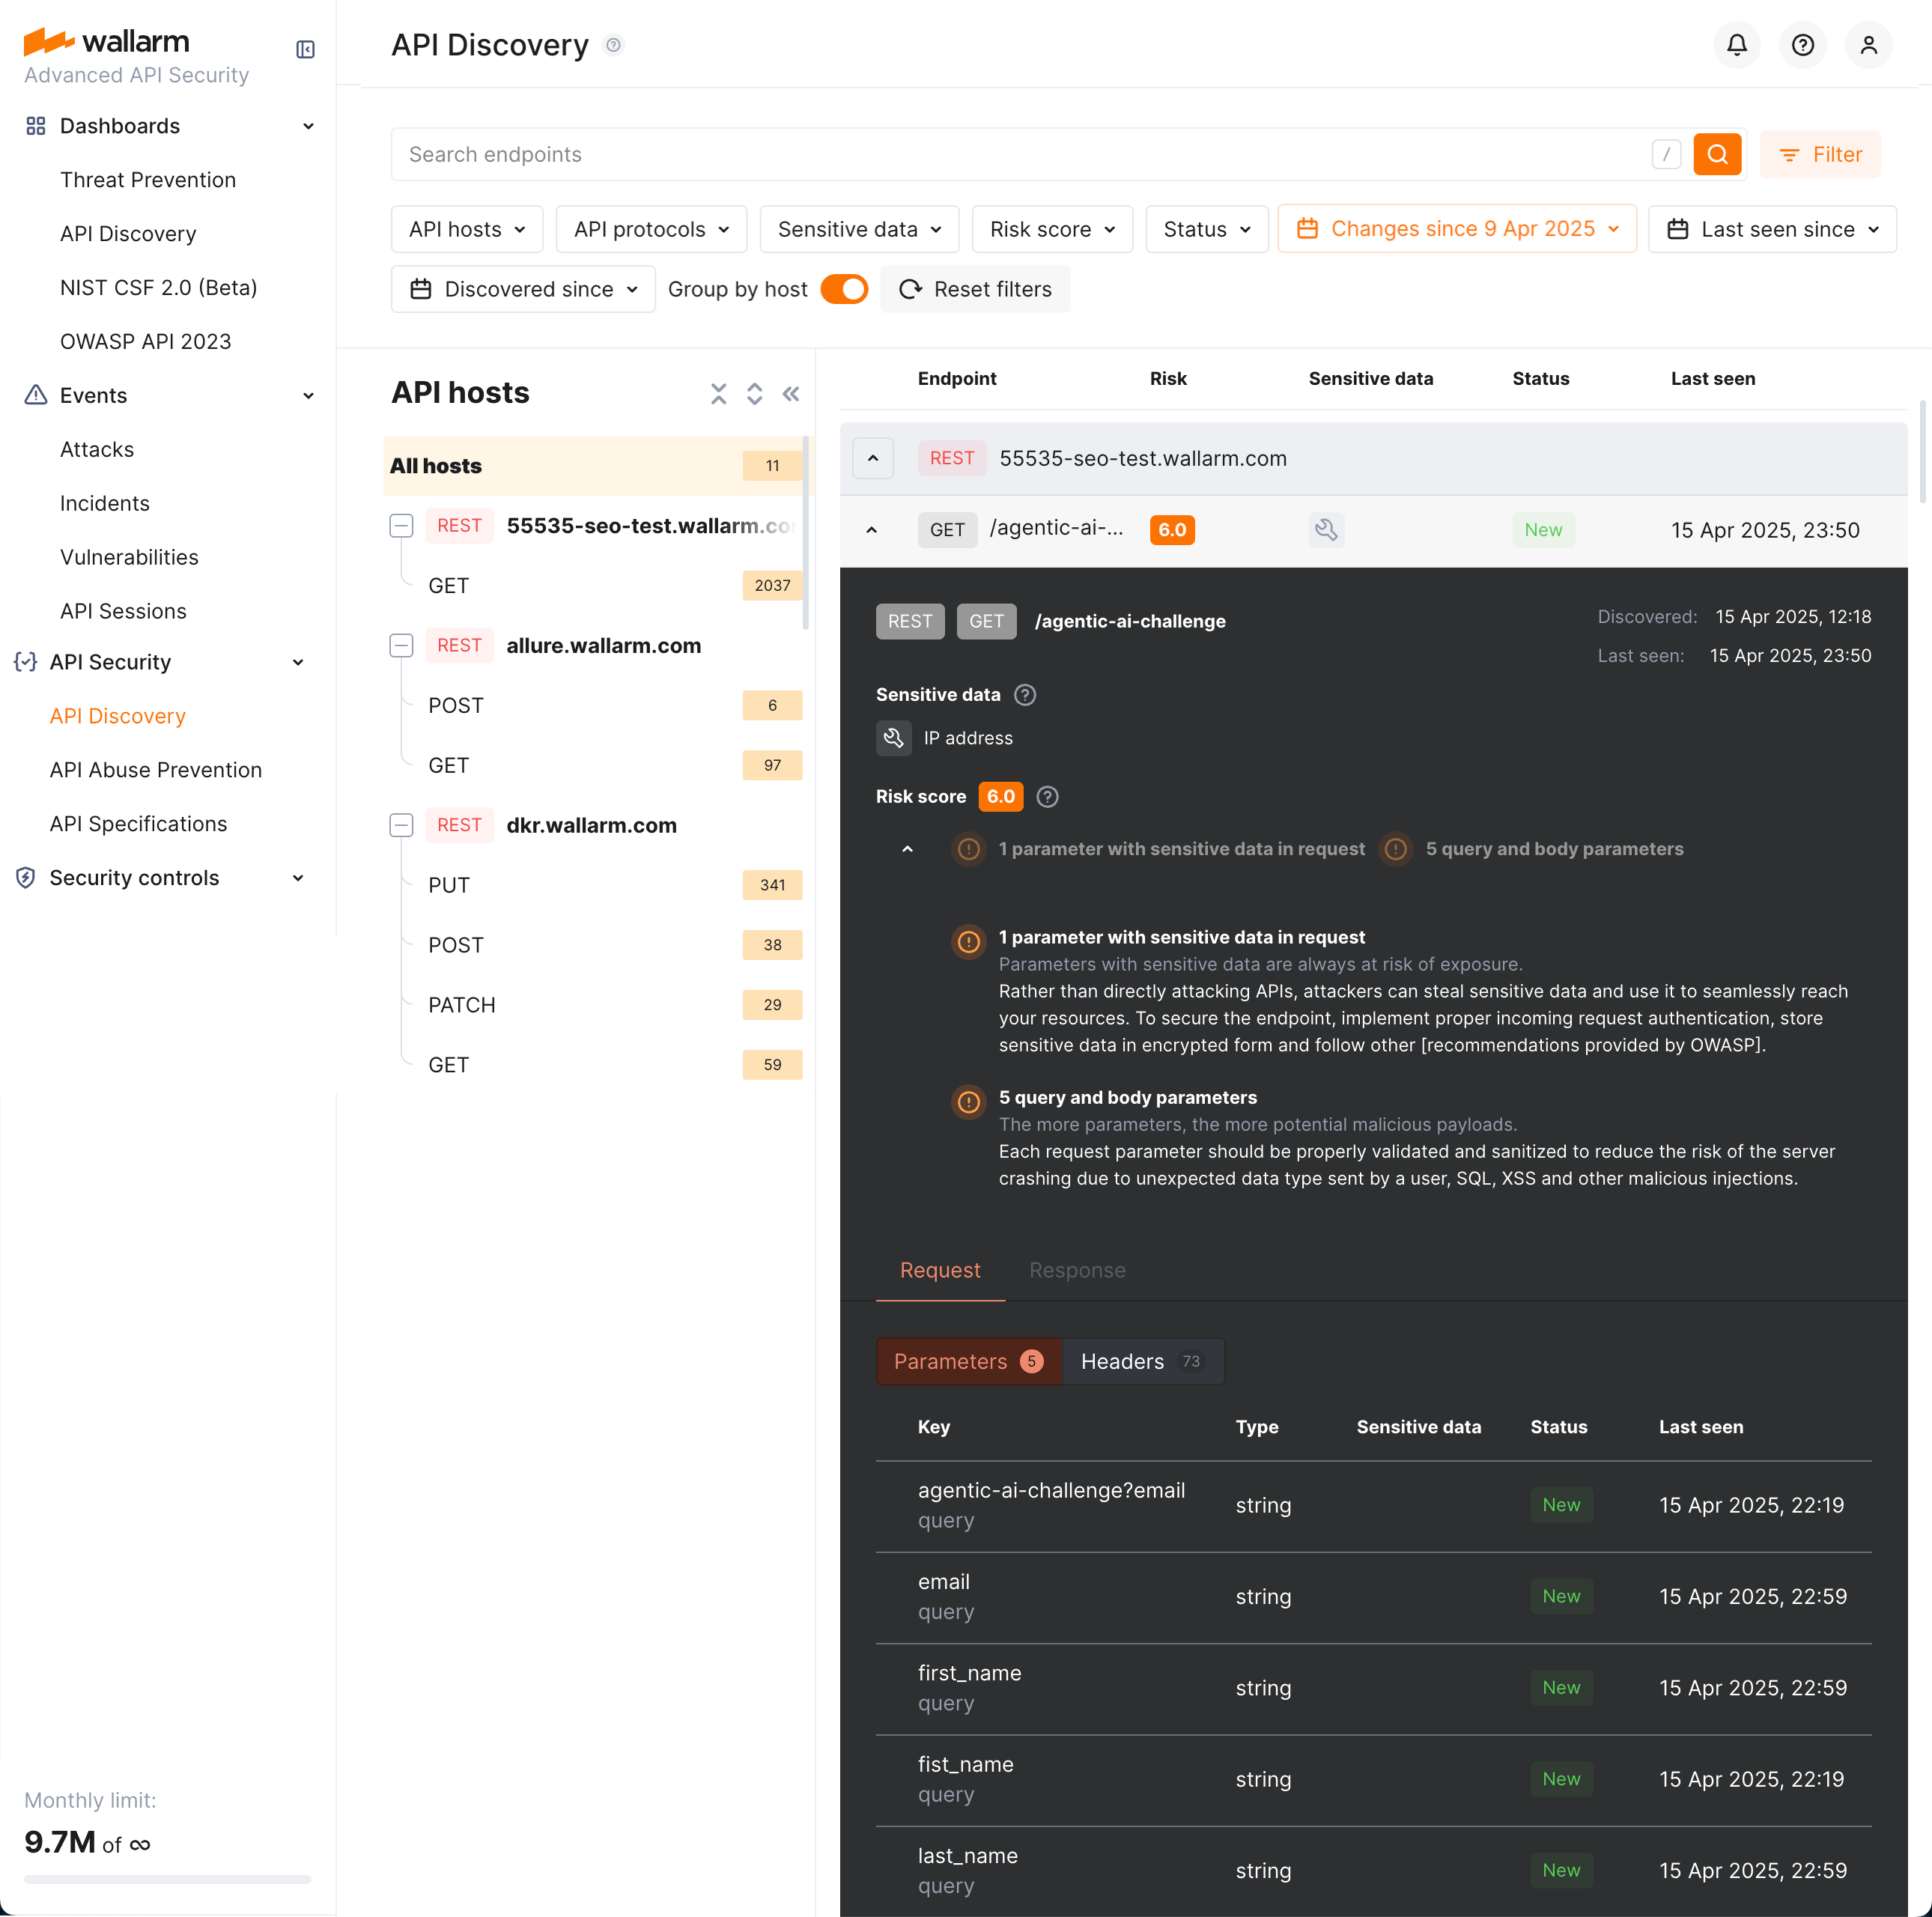
Each request/response parameter information includes:
-
Parameter name and the part of request/response this parameter belongs to
-
Path: the hierarchical location of a parameter within a REST query structure (not displayed, if all parameters are stored in the same root location)
-
Information about parameter changes (new, unused)
-
Presence and type of sensitive data transmitted by this parameter, including:
- Personally identifiable information (PII) like full name, passport number or SSN
- Login credentials like secret keys and passwords
- Financial data like bank card numbers
- Medical data like medical license number
- Technical data like IP and MAC addresses
-
Type/format of data sent in this parameter
-
Date and time when parameter value was last transferred by requests
-
Authentication flows and their coverage status — authentication type, per-parameter coverage percentage, parameter key and path
In REST endpoint details, in the Type column for parameters of request and responses, Wallarm indicates the data format identified through traffic analysis or, if not specific, a general data type.
For REST endpoints, Wallarm attempts to detect various data formats such as Int32, Int64, Float, Double, Datetime, IPv4/IPv6, among others. If a value does not conform to any recognized data format, Wallarm classifies it under a general data type, such as Integer, Number, String, or Boolean.
This data allows checking that values of the expected format are passed in each parameter. Inconsistencies can be the result of an attack or a scan of your API, for example:
-
The
Stringvalues are passed to the field withIP -
The
Doublevalues are passed to the field where there should be a value no more thanInt32
GraphQL operation details
GraphQL discovery requires NGINX Node 6.1.0 or Native Node 0.15.1. For all protocols and their required Node versions, see Supported protocols.
Click the GraphQL operation to open its full-screen details page, including transferred sensitive data, risk score and what contributes to it, schema, parameters and headers of requests and responses:
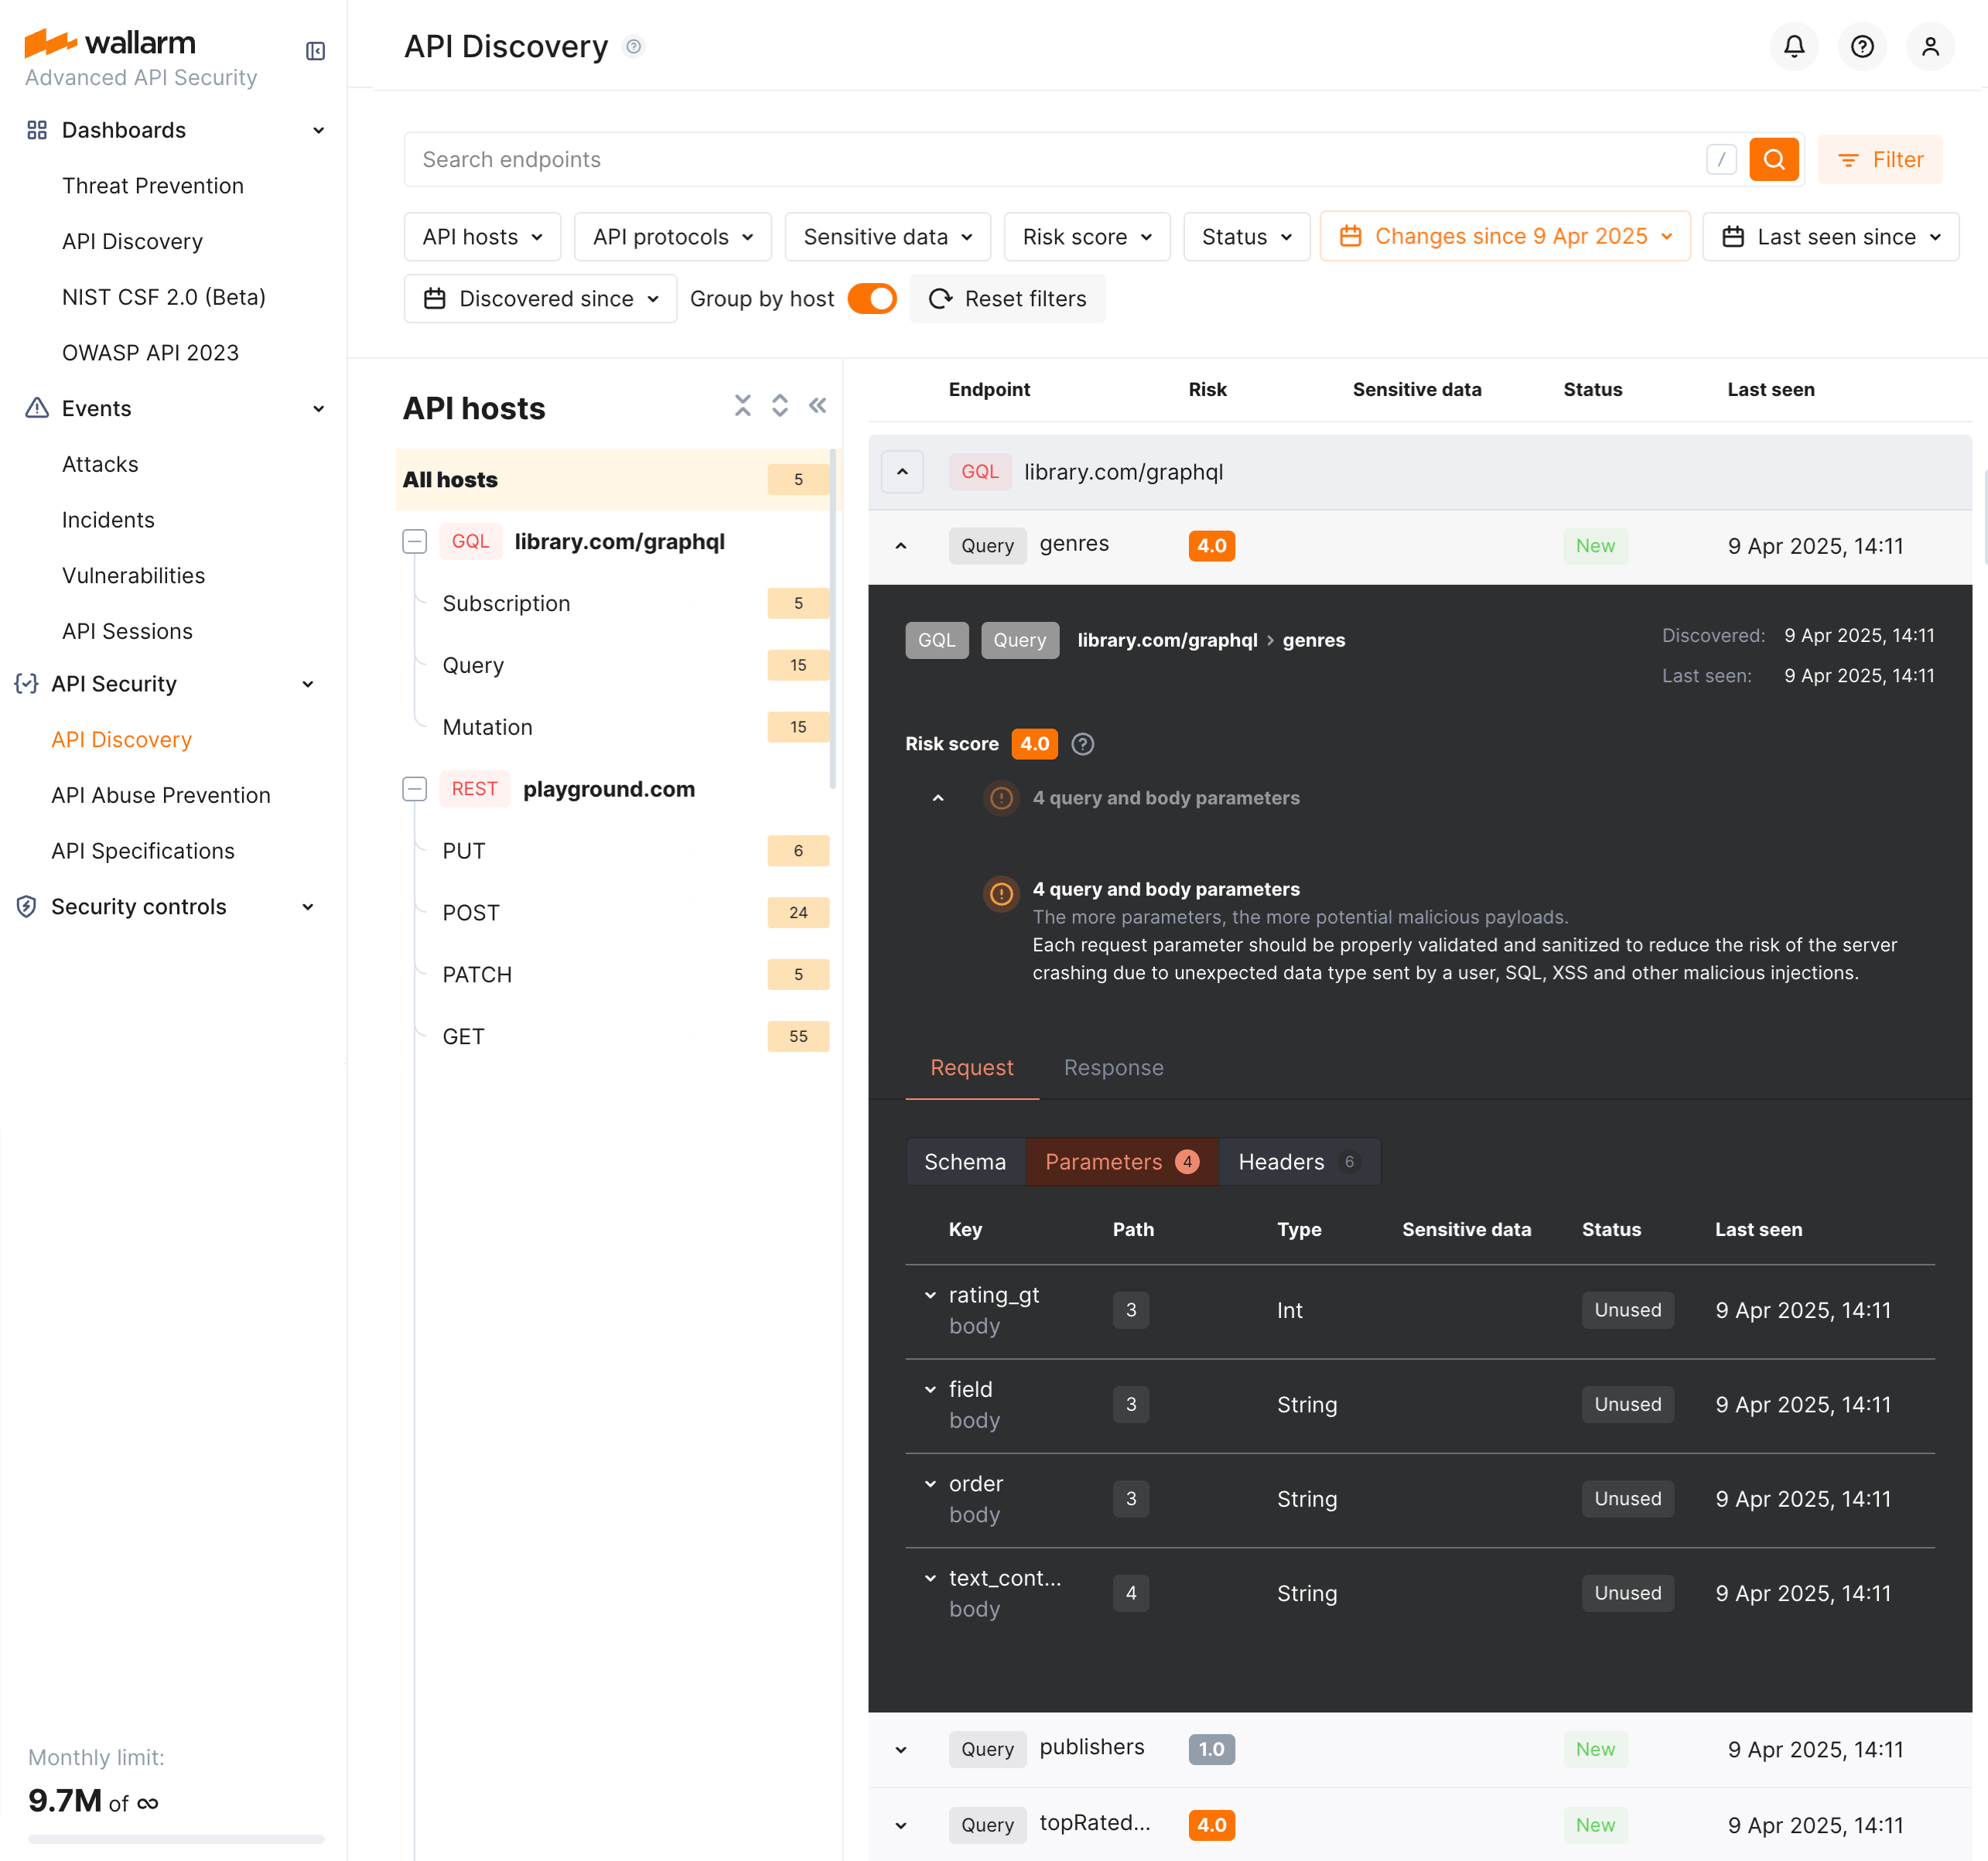
Each request/response parameter information includes:
-
Parameter name and the part of request/response this parameter belongs to
-
Path: the hierarchical location of a parameter within a GraphQL query structure (not displayed, if all parameters are stored in the same root location)
-
Information about parameter changes (new, unused)
-
Presence and type of sensitive data transmitted by this parameter
-
Date and time when parameter value was last transferred by requests
-
Authentication flows and their coverage status — authentication type, per-parameter coverage percentage, parameter key and path
In GraphQL operation details, in the Type column for parameters and headers, Wallarm indicates the data format identified through traffic analysis.
For GraphQL operations, data formats are detected in accordance with the scalar types specification:
-
Int: A signed 32‐bit integer. -
Float: A signed double-precision floating-point value. -
String: A UTF‐8 character sequence. -
Boolean: true or false.
SOAP operation details
SOAP discovery requires NGINX Node 6.3.0 or Native Node 0.17.1. For all protocols and their required Node versions, see Supported protocols.
Click the SOAP operation to open its full-screen details page, including transferred sensitive data, risk score and what contributes to it, XML body parameters, HTTPS and XML headers of requests and responses:
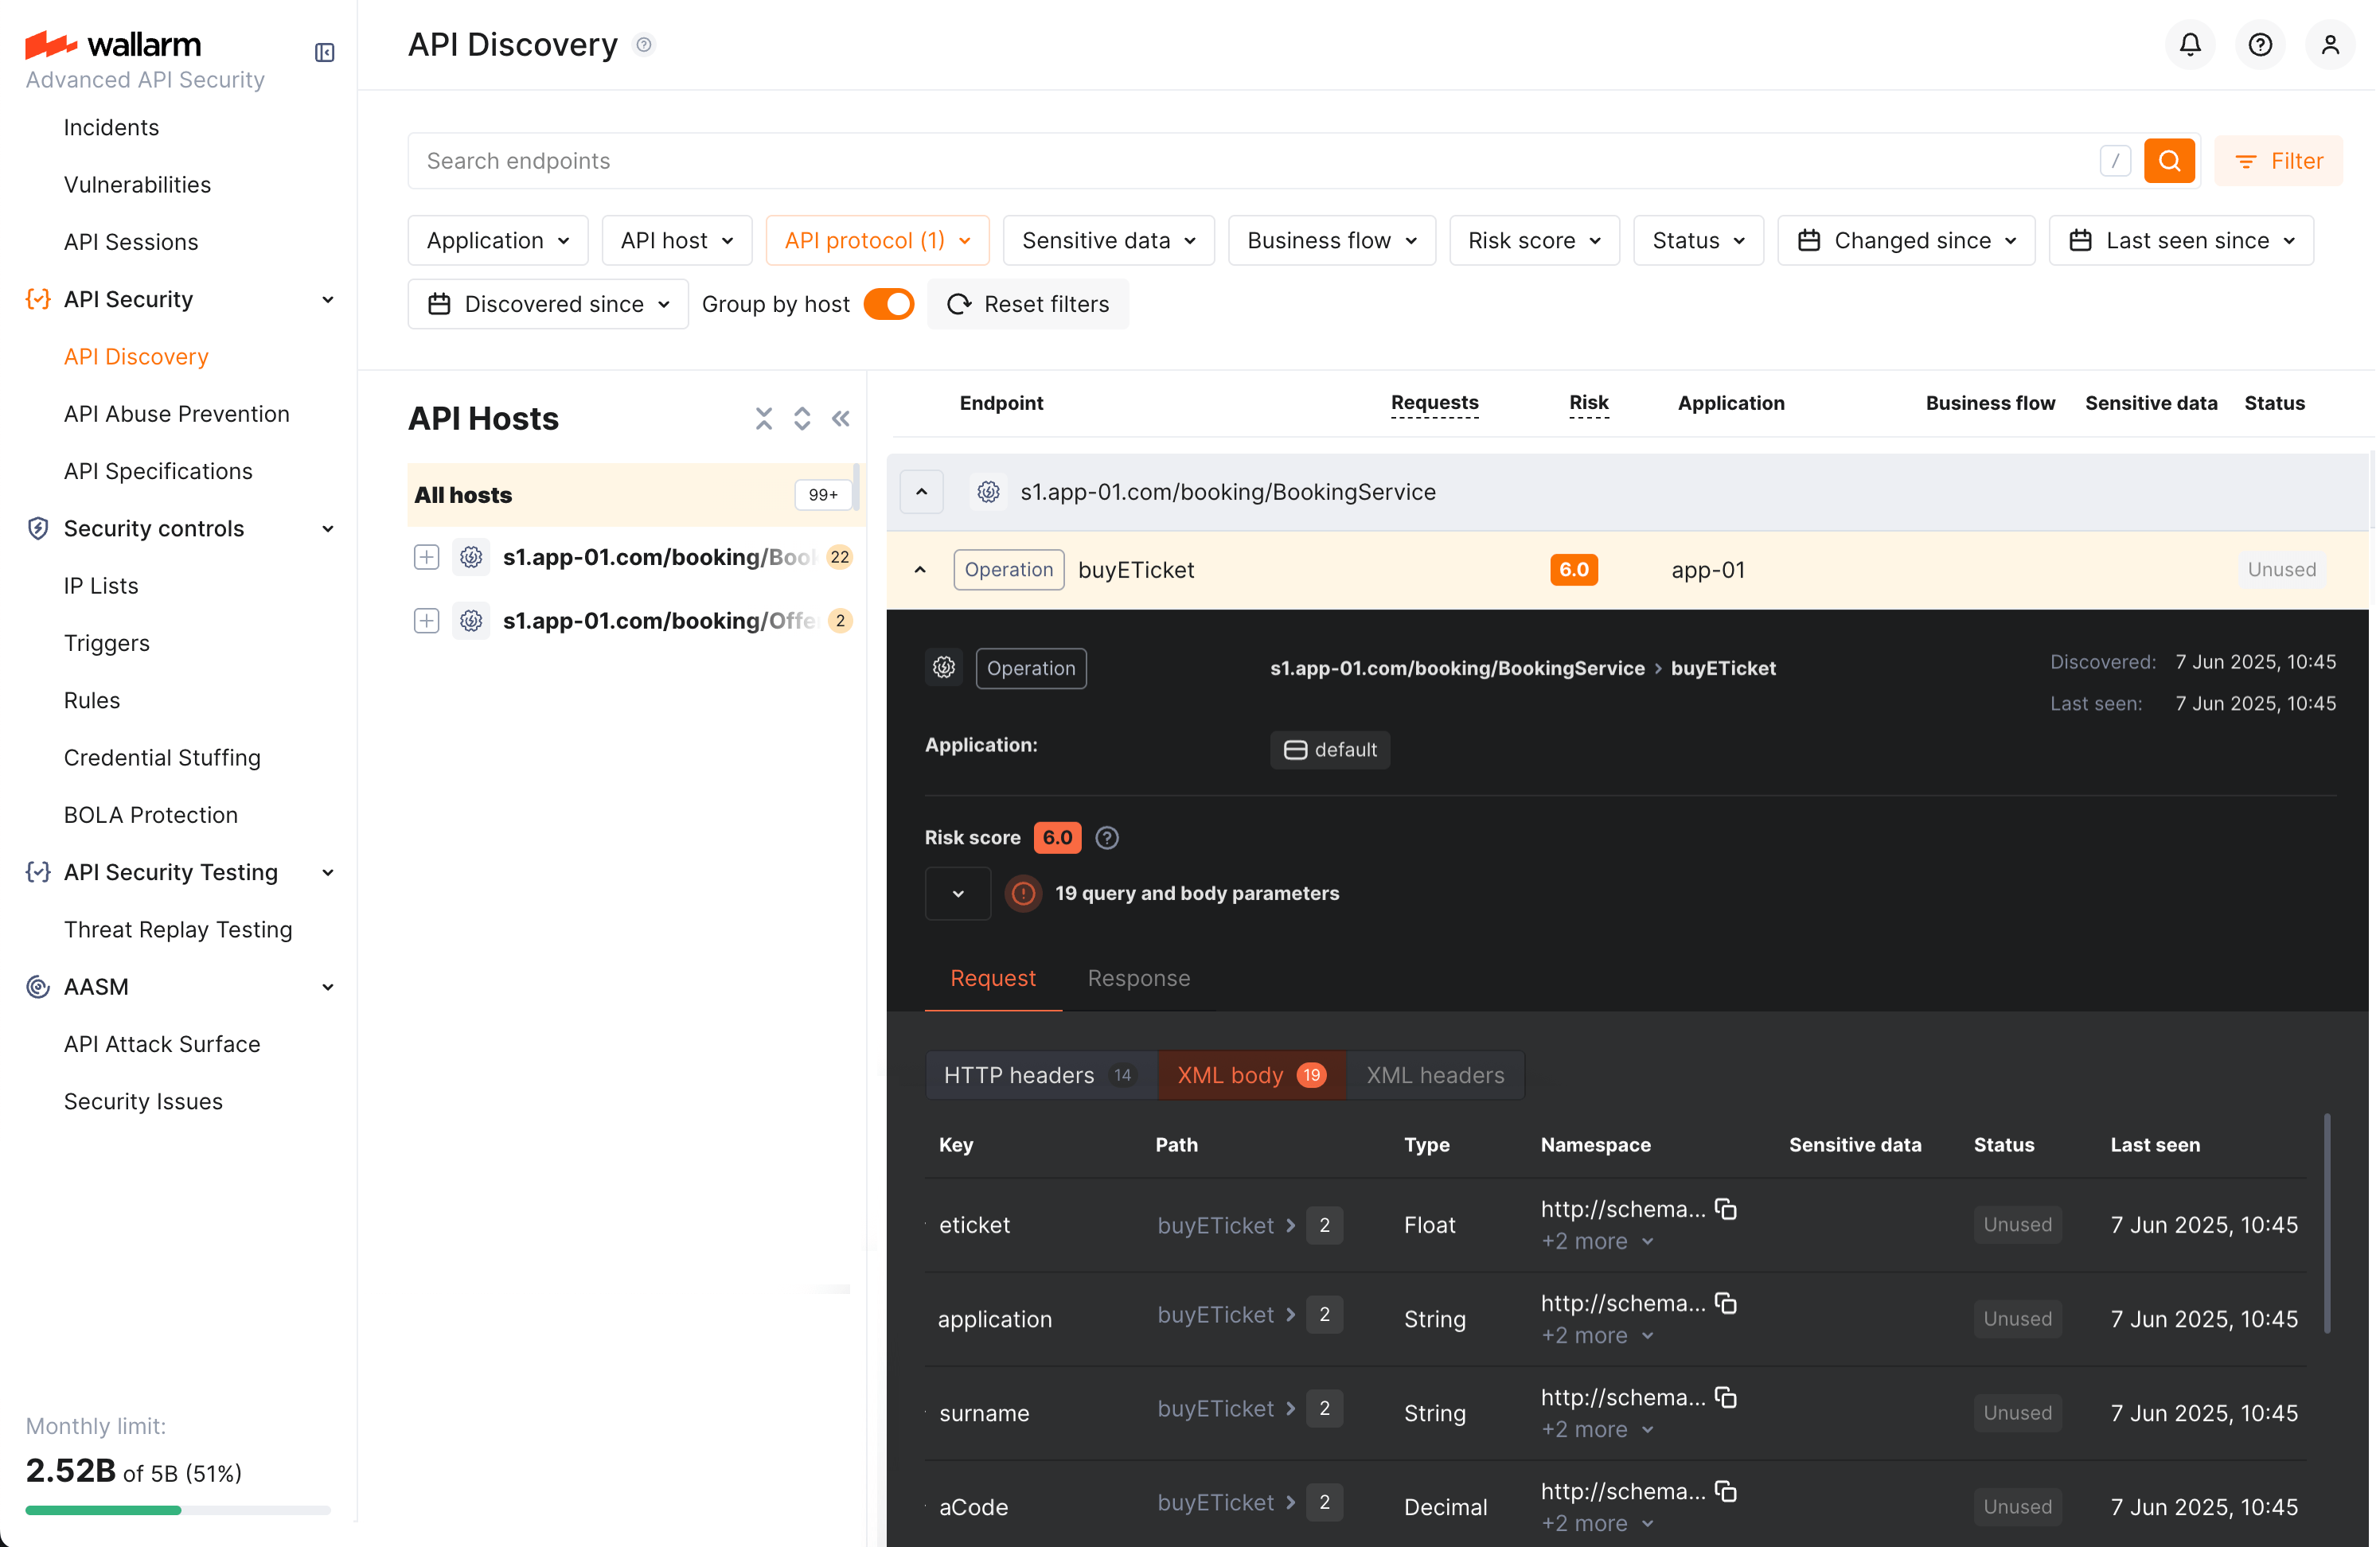
Each request/response XML parameter information includes:
-
Parameter name (Key)
-
Path: the hierarchical location of a parameter within an XML structure (not displayed, if all parameters are stored in the same root location)
-
Parameter type
-
Namespaces for path elements (from more general to more specific)
-
Presence and type of sensitive data transmitted by this parameter
-
Information about parameter changes (new, unused)
-
Date and time when parameter value was last transferred by requests
-
Authentication flows and their coverage status — authentication type, per-parameter coverage percentage, parameter key and path
In SOAP operation details, in the Type column for parameters and headers, Wallarm indicates the data format identified through traffic analysis.
For SOAP operations, it is a limited set from the built-in primitive XML data types:
-
soapTypeString =
String -
soapTypeBoolean =
Boolean -
soapTypeFloat =
Float -
soapTypeDecimal =
Decimal -
soapTypeDuration =
Duration -
soapTypeURI =
URI
gRPC operation details
gRPC discovery requires NGINX Node 6.4.0 and is not available on Native Node. For all protocols and their required Node versions, see Supported protocols.
Click the gRPC operation to open its full-screen details page, including transferred sensitive data, risk score and what contributes to it, parameters and headers of requests and responses:
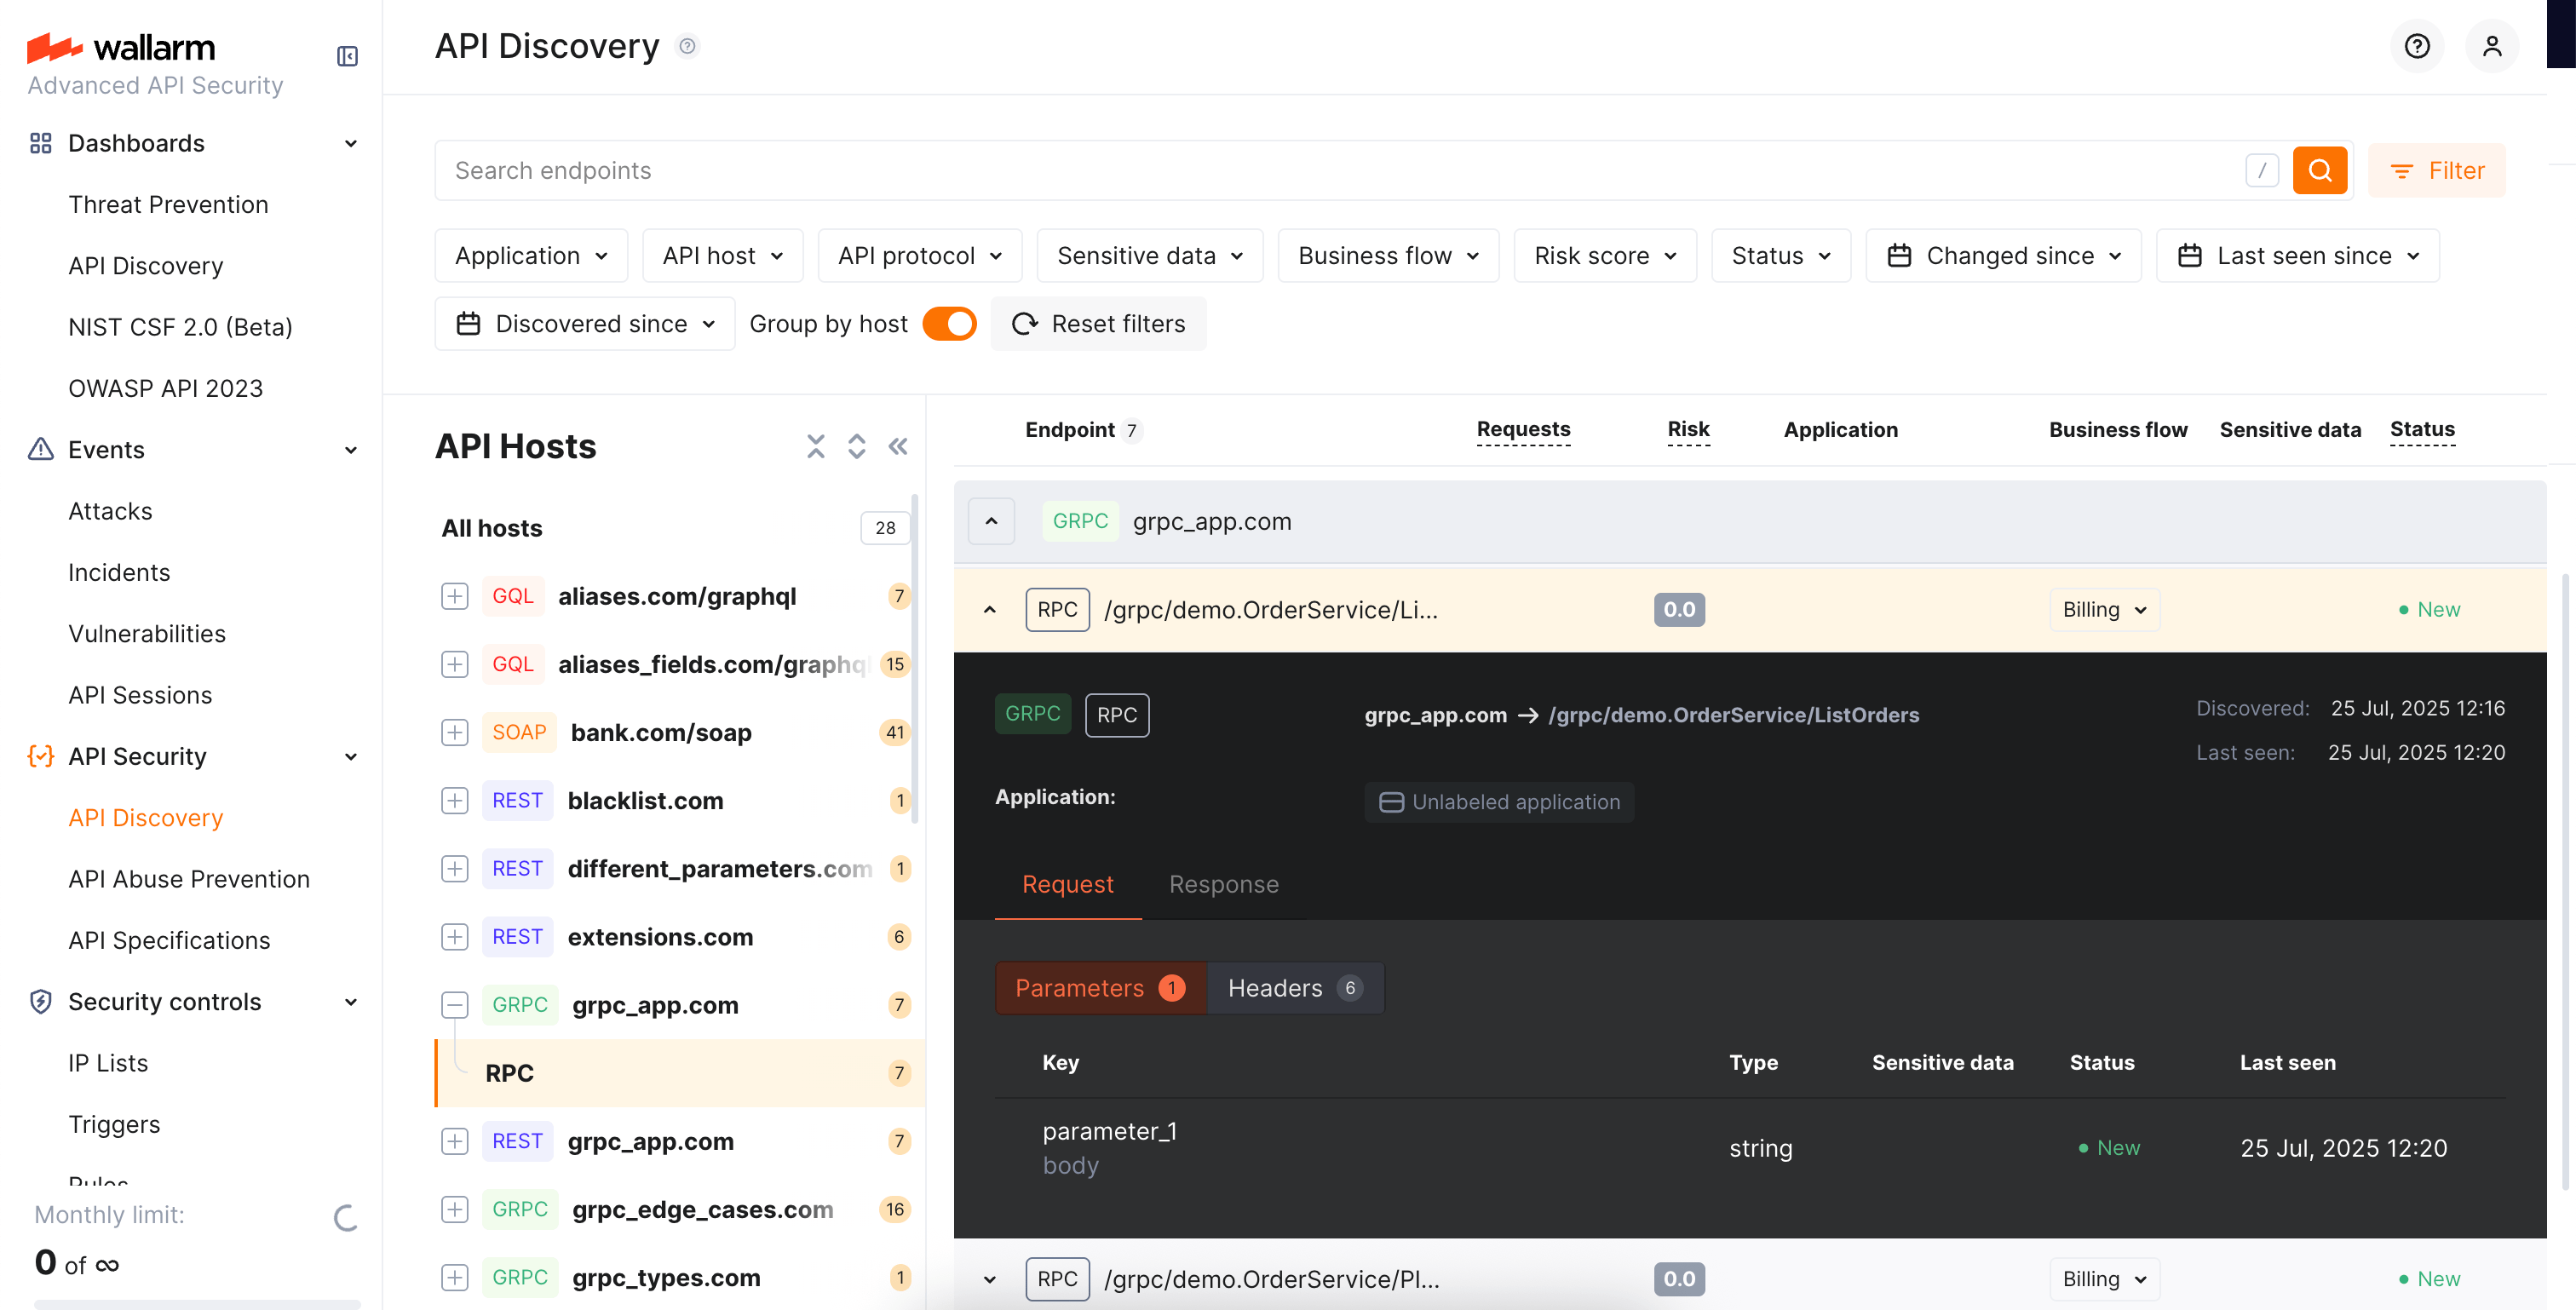
Each request/response parameter information includes:
-
Parameter data type and the part of request/response this parameter belongs to
Parameter names
Due to gRPC protocol peculiarities, it is impossible to discover parameter names. However, it is useful to understand the nesting depth, type and number of parameters for each operation.
-
Information about parameter changes (new, unused)
-
Presence and type of sensitive data transmitted by this parameter
-
Date and time when parameter value was last transferred by requests
-
Authentication flows and their coverage status — authentication type, per-parameter coverage percentage, parameter key and path
Format and data type
In gRPC operation details, in the Type column for parameters and headers, Wallarm indicates the data format identified through traffic analysis.
Wallarm discovers general gRPC services that use protocol buffers, on which gRPC relies when defining gRPC message data types:
-
Int: A signed 32‐bit integer. -
Float: A signed double-precision floating-point value. -
String: A UTF‐8 character sequence. -
Boolean: true or false.
MCP primitive details
MCP discovery requires NGINX Node 6.12.0 or Native Node 0.25.0. For all protocols and their required Node versions, see Supported protocols.
Discovered MCP servers are displayed in the MCP Servers tab of API Discovery. Each MCP server lists its primitives — tools, resources, and prompts. Click a primitive to open its full-screen details page.
The details page displays:
-
Primitive name and description — as reported by the MCP server
-
MCP server version — protocol version of the MCP server
-
Request counters — number of requests for the last 7 days
The Schema tab content depends on the primitive type:
Tool primitives display the Arguments section with the tool's input parameters as declared in the tools/list response:
- Parameter name
- Data type (e.g.,
String,Integer,Boolean) - Parameter description
Request and response headers are also displayed.
Resource primitives display:
- MIME type of the resource
- Request and response headers
Prompt primitives display:
- Arguments — input parameters for the prompt template
- Request and response headers
Each parameter information also includes:
-
Information about parameter changes (new, unused)
-
Presence and type of sensitive data transmitted by this parameter
-
Date and time when parameter value was last transferred by requests
Activities
The number of requests related to the endpoint or MCP primitive is displayed in the Requests column. Click this number to open the API Sessions section (or MCP Sessions for MCP primitives) with the list of sessions for the last week containing these requests.
Within each found session, only requests to your endpoint or primitive will be initially displayed — within the session, remove the filter to see all requests for context.
A structured view of session activity helps in understanding your endpoint or primitive's place in malicious and legitimate activities, its relation to sensitive business flows and required protection measures.
Variability
URLs can include diverse elements, such as a user ID. API Discovery supports finding such elements for UUID, INTEGER, FLOAT and HEX path segment types:
-
/api/users/profile/a1b2c3d4-e5f6-7890-1234-567890abcdef12 -
/api/users/profile/f0e9d8c7-b6a5-4321-fedc-ba9876543210 -
/api/users/profile/1a2b3c4d-5e6f-7080-9102-34567890fedc
The API Discovery module unifies such elements into the {parameter_X} format in the endpoint paths, so for the example above you will not have 3 endpoints, but instead there will be one:
/api/articles/author/{parameter_1}
Click the endpoint to open its details page and view which type was automatically detected for the diverse parameter.
Notifications
API Discovery can notify you about endpoint changes in two ways:
-
Email digests — daily or hourly summaries of new and changed endpoints, delivered to your account email and any additional addresses.
-
Per-endpoint alerts via triggers — one notification per changed endpoint, delivered through any configured integration (Slack, webhook, SIEM, PagerDuty, Microsoft Teams, Telegram, and others) using the Changes in API trigger.
Exporting API inventory data
You can export the discovered API inventory as OpenAPI (OAS) 3.1 (JSON) or as CSV.
OpenAPI (OAS) export
Exporting to OAS lets you use the discovered API schema for protection, analysis, and integration with other tools:
-
Upload to API specifications in Wallarm to enforce requests or enable rogue API detection (when available for your API Discovery version).
-
Open in Swagger Editor to inspect and edit the inventory in OpenAPI format.
-
Use in Wallarm's Schema-Based Testing to run automated API security tests, or export to third-party platforms (e.g. Postman) for documentation, testing, or further analysis. The specification helps with vulnerability testing and reviewing endpoints for sensitive data and undocumented parameters.
To download the OAS file:
-
In Wallarm Console → API Discovery, select a single host for which you need the specification.
-
Optionally, apply any additional filters to limit the endpoints included in the export.
-
Click Download report.
-
In the popup, choose OpenAPI (OAS 3.1, JSON) and click Generate OAS.
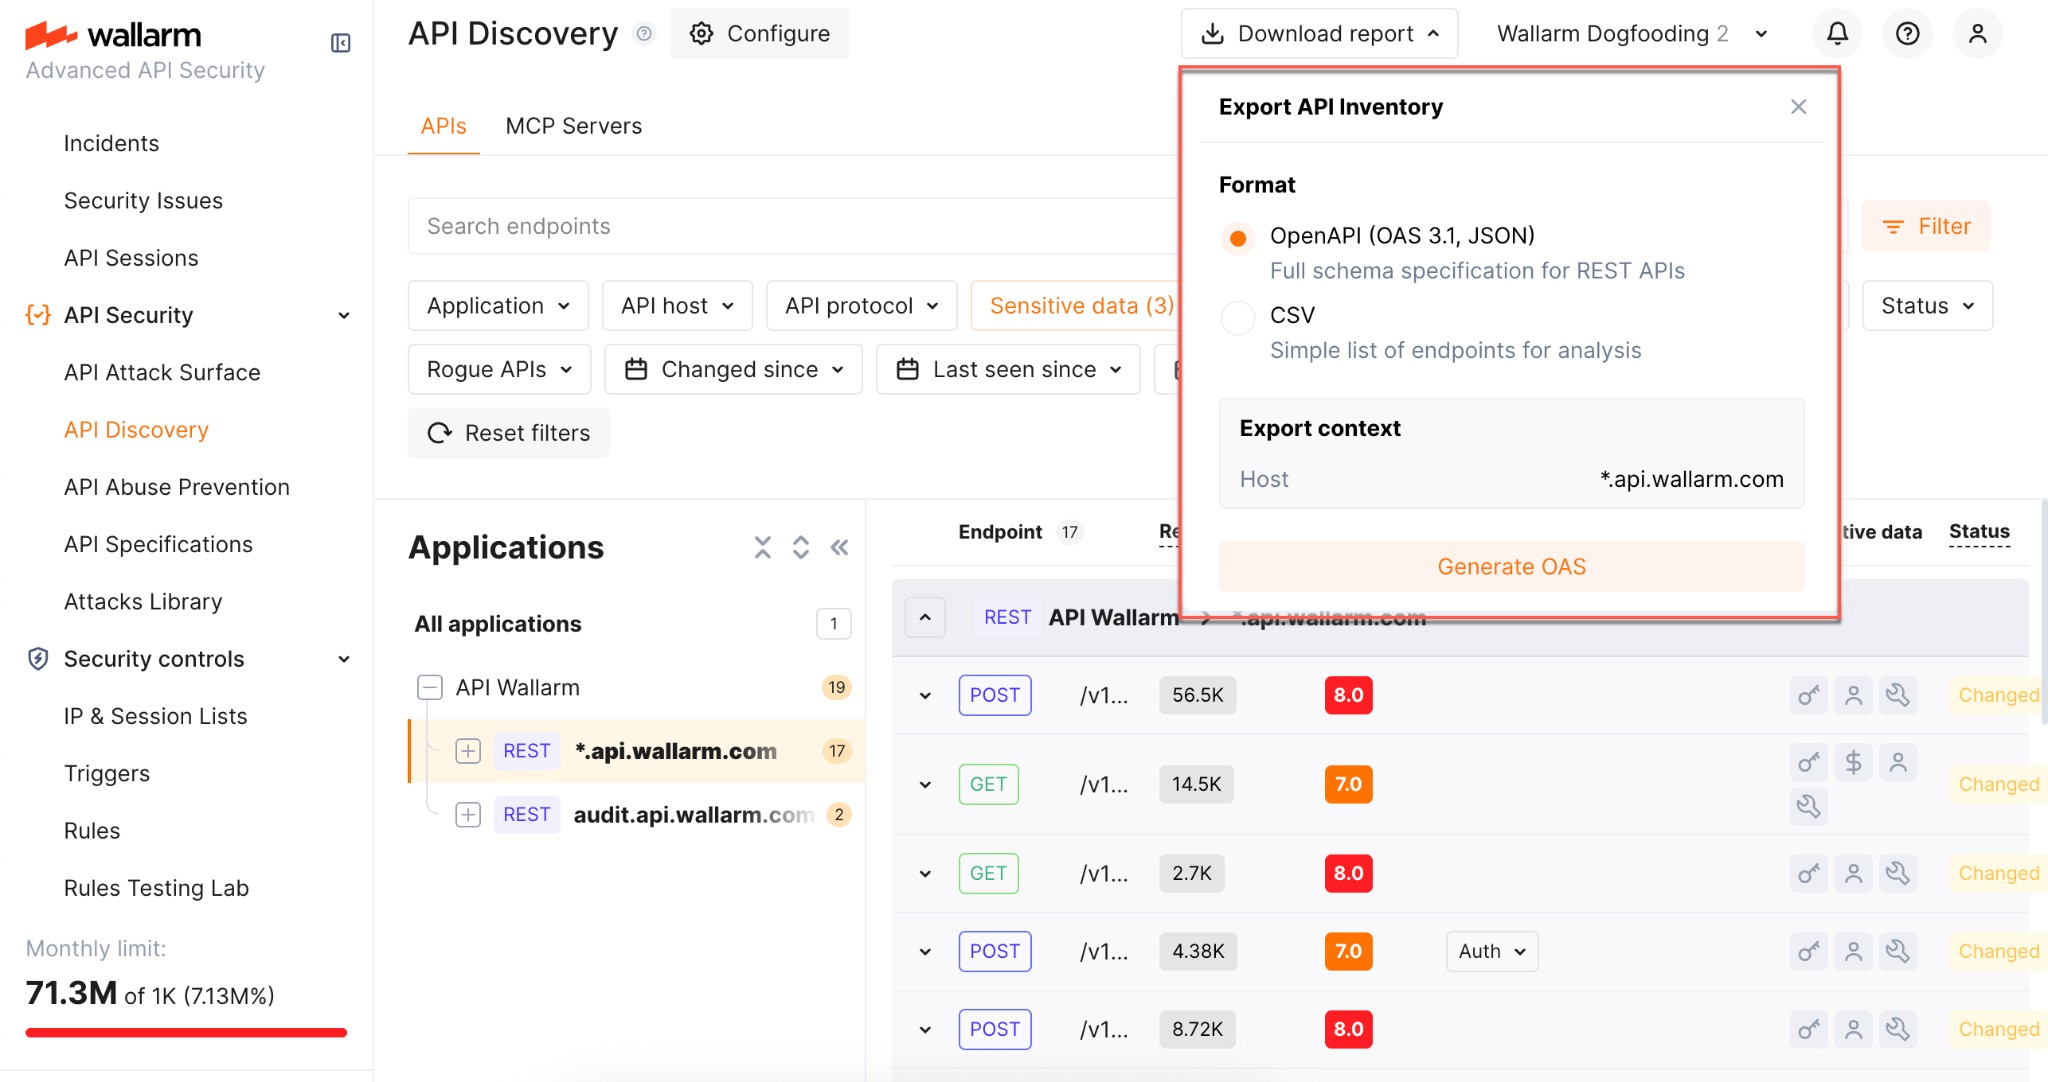
-
Wait until the file is generated. When ready, the browser starts the download automatically and the JSON file is saved to your default download location.
Limitations:
-
One host per specification (aligned with OpenAPI recommendations)
-
REST only
-
Maximum 1000 endpoints per host and 100,000 parameters in total per export
-
Not supported:
application/xmlandapplication/x-www-form-urlencodedcontent types -
Not supported: nested lists or objects in headers, path, or query parameters
-
Not supported:
oneOfdirective
CSV export
Use Download report → CSV to get the filtered endpoints in a comma-separated format. The CSV is generated immediately and includes key endpoint attributes such as risk score and sensitive data types.
No parameter information
The CSV report does not include information on API endpoint parameters.