Exploring Bot Activity  
API Abuse Prevention identifies malicious bot activity based on ML algorithms. Such attacks are impossible to analyze based on a single blocked request. Therefore, it is essential that the Wallarm platform offers a wide range of tools to investigate bot activity from different angles.
API abuse dashboards
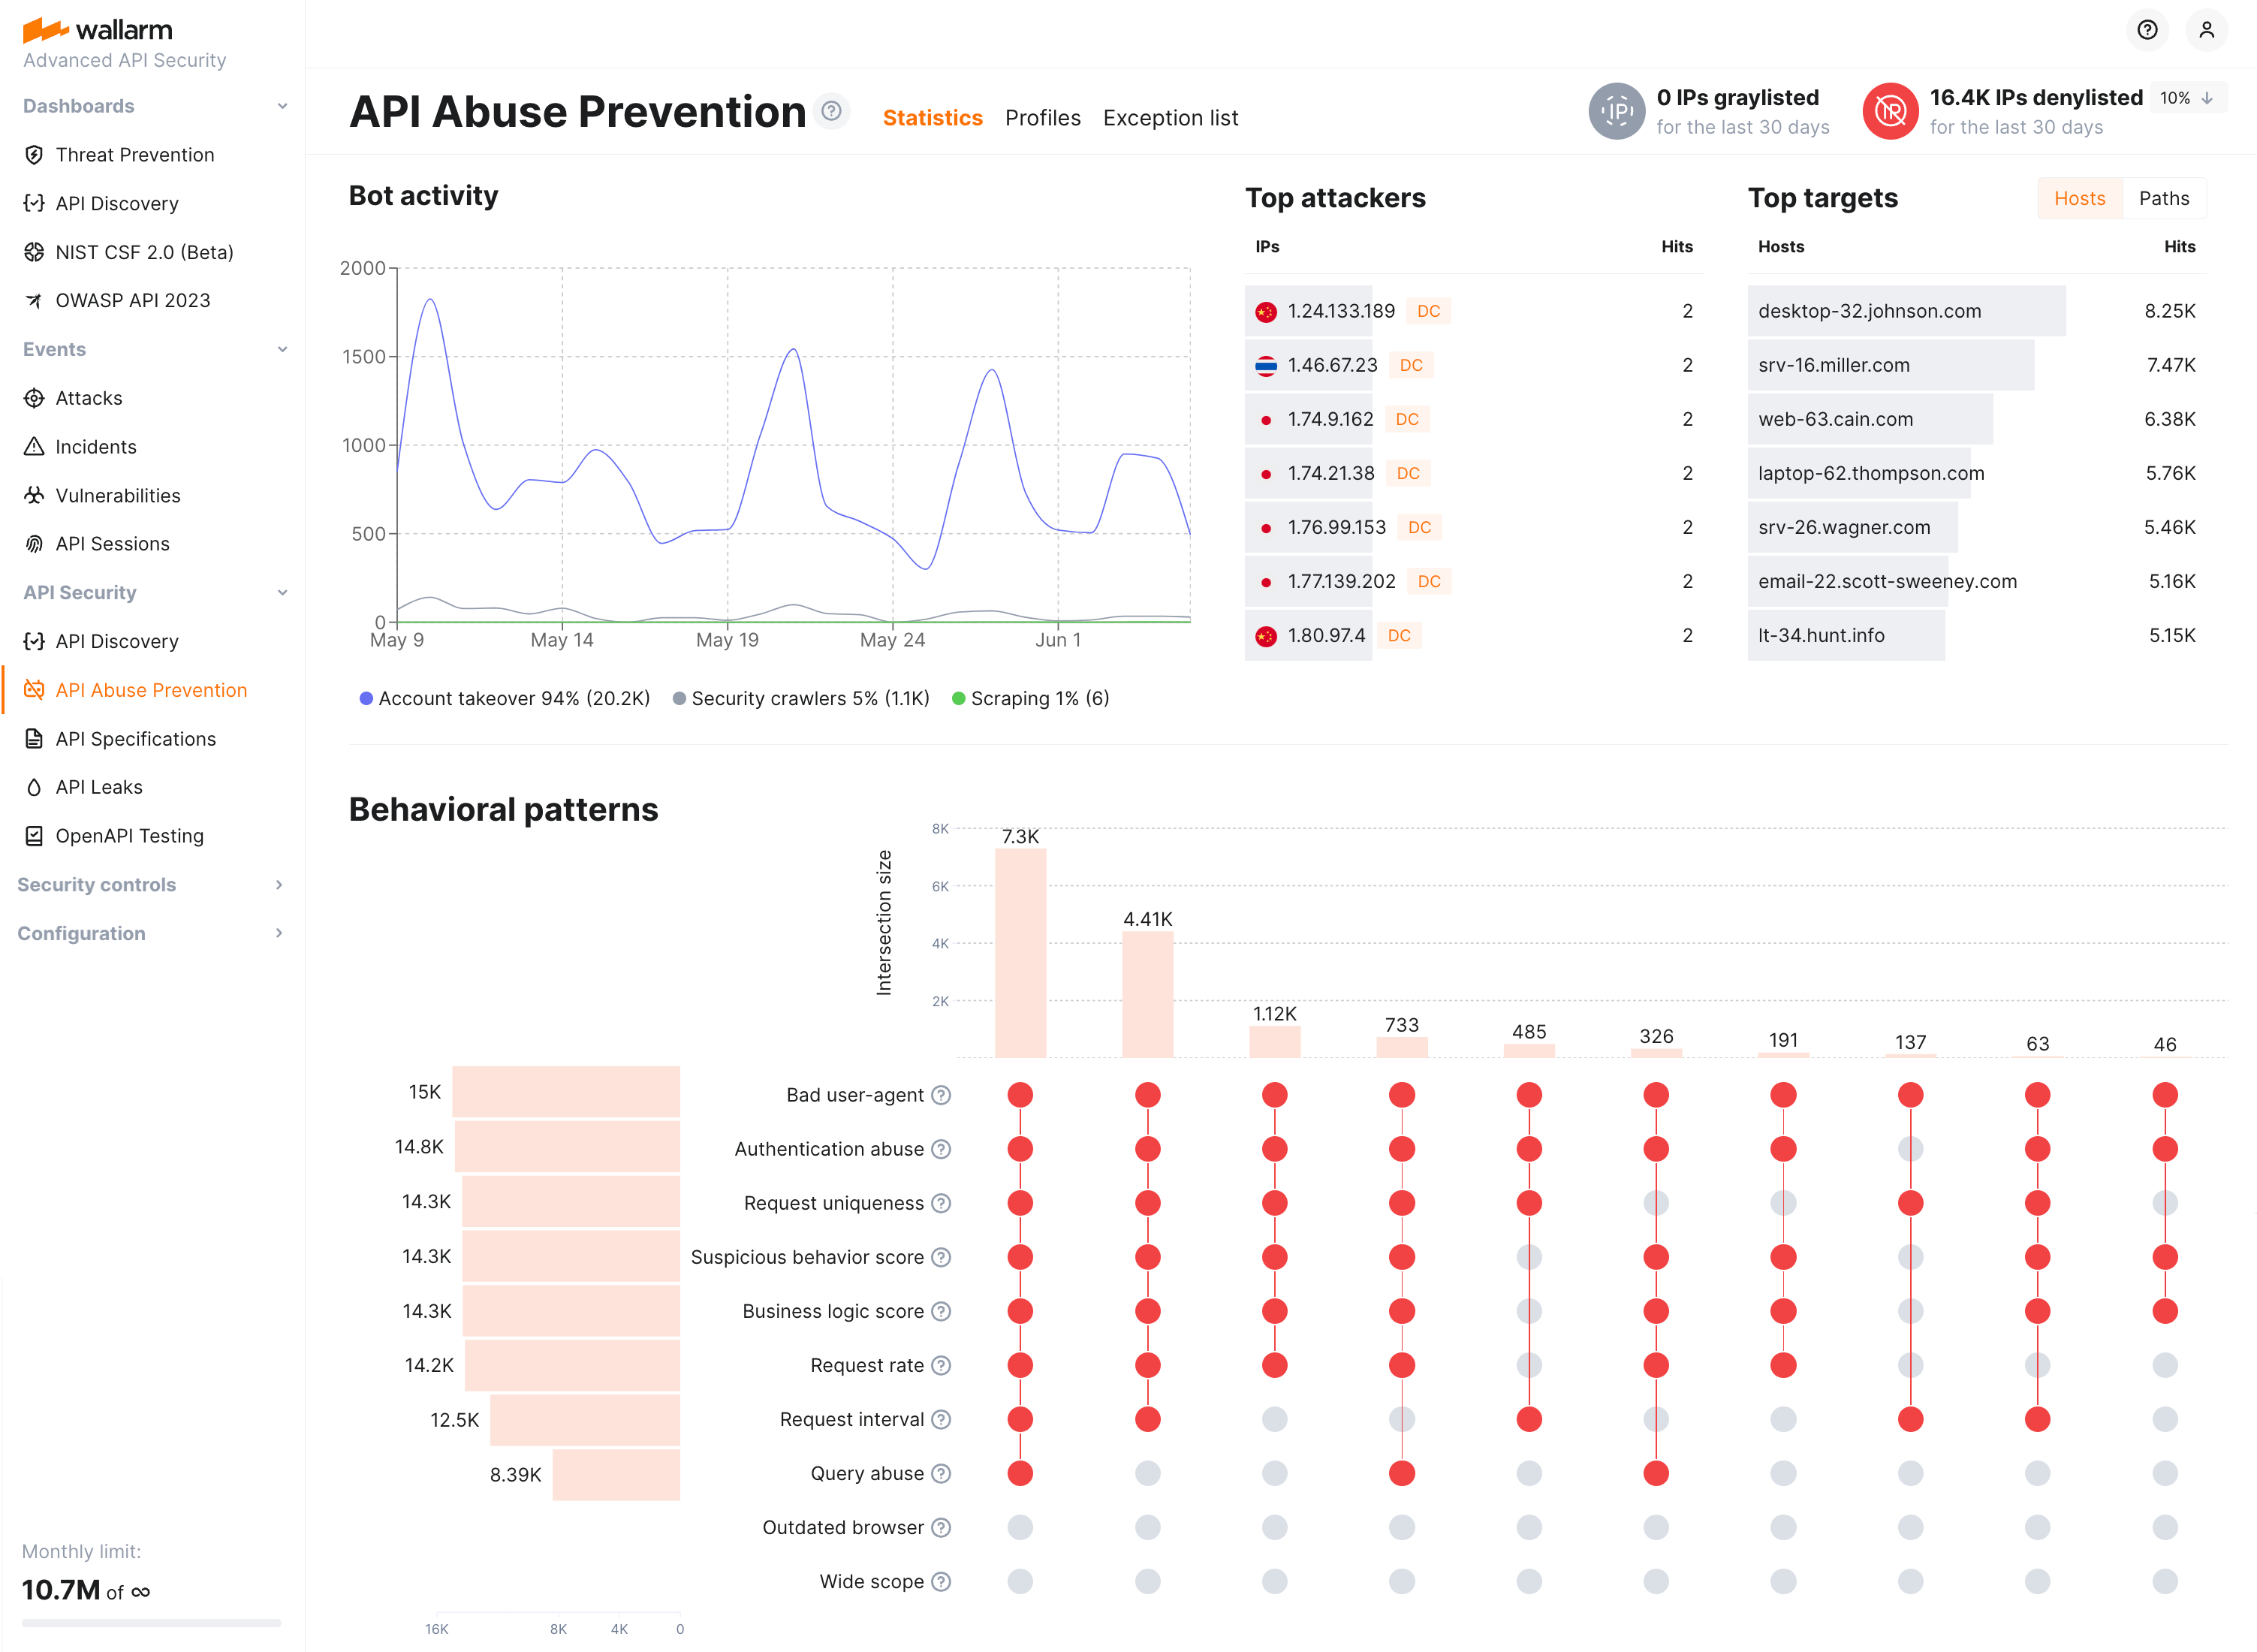
API Abuse Prevention conveniently visualizes the data on bot activities for the last 30 days at the API Abuse Prevention section → Statistics tab. Using the timeline diagram, you can easily identify spikes in bot activity. The additional Top Attackers and Top Targets widgets allow you to determine the most active bots and the most attacked APIs and applications. You can drill down to investigate these bot activities at the Attacks tab in one click on the dashboard element.
You can also analyze bot behaviors at the Behavioral patterns at the bottom. Get detailed information on each detector and how they acted together to determine bot actions. This widget and the counters of deny- or graylisted IPs at the top right will link you to the IP Lists history where you can check when and for what period of time the bot's IP was placed on the blocking list.
If no bot activities were detected, the Legitimate traffic state is displayed:
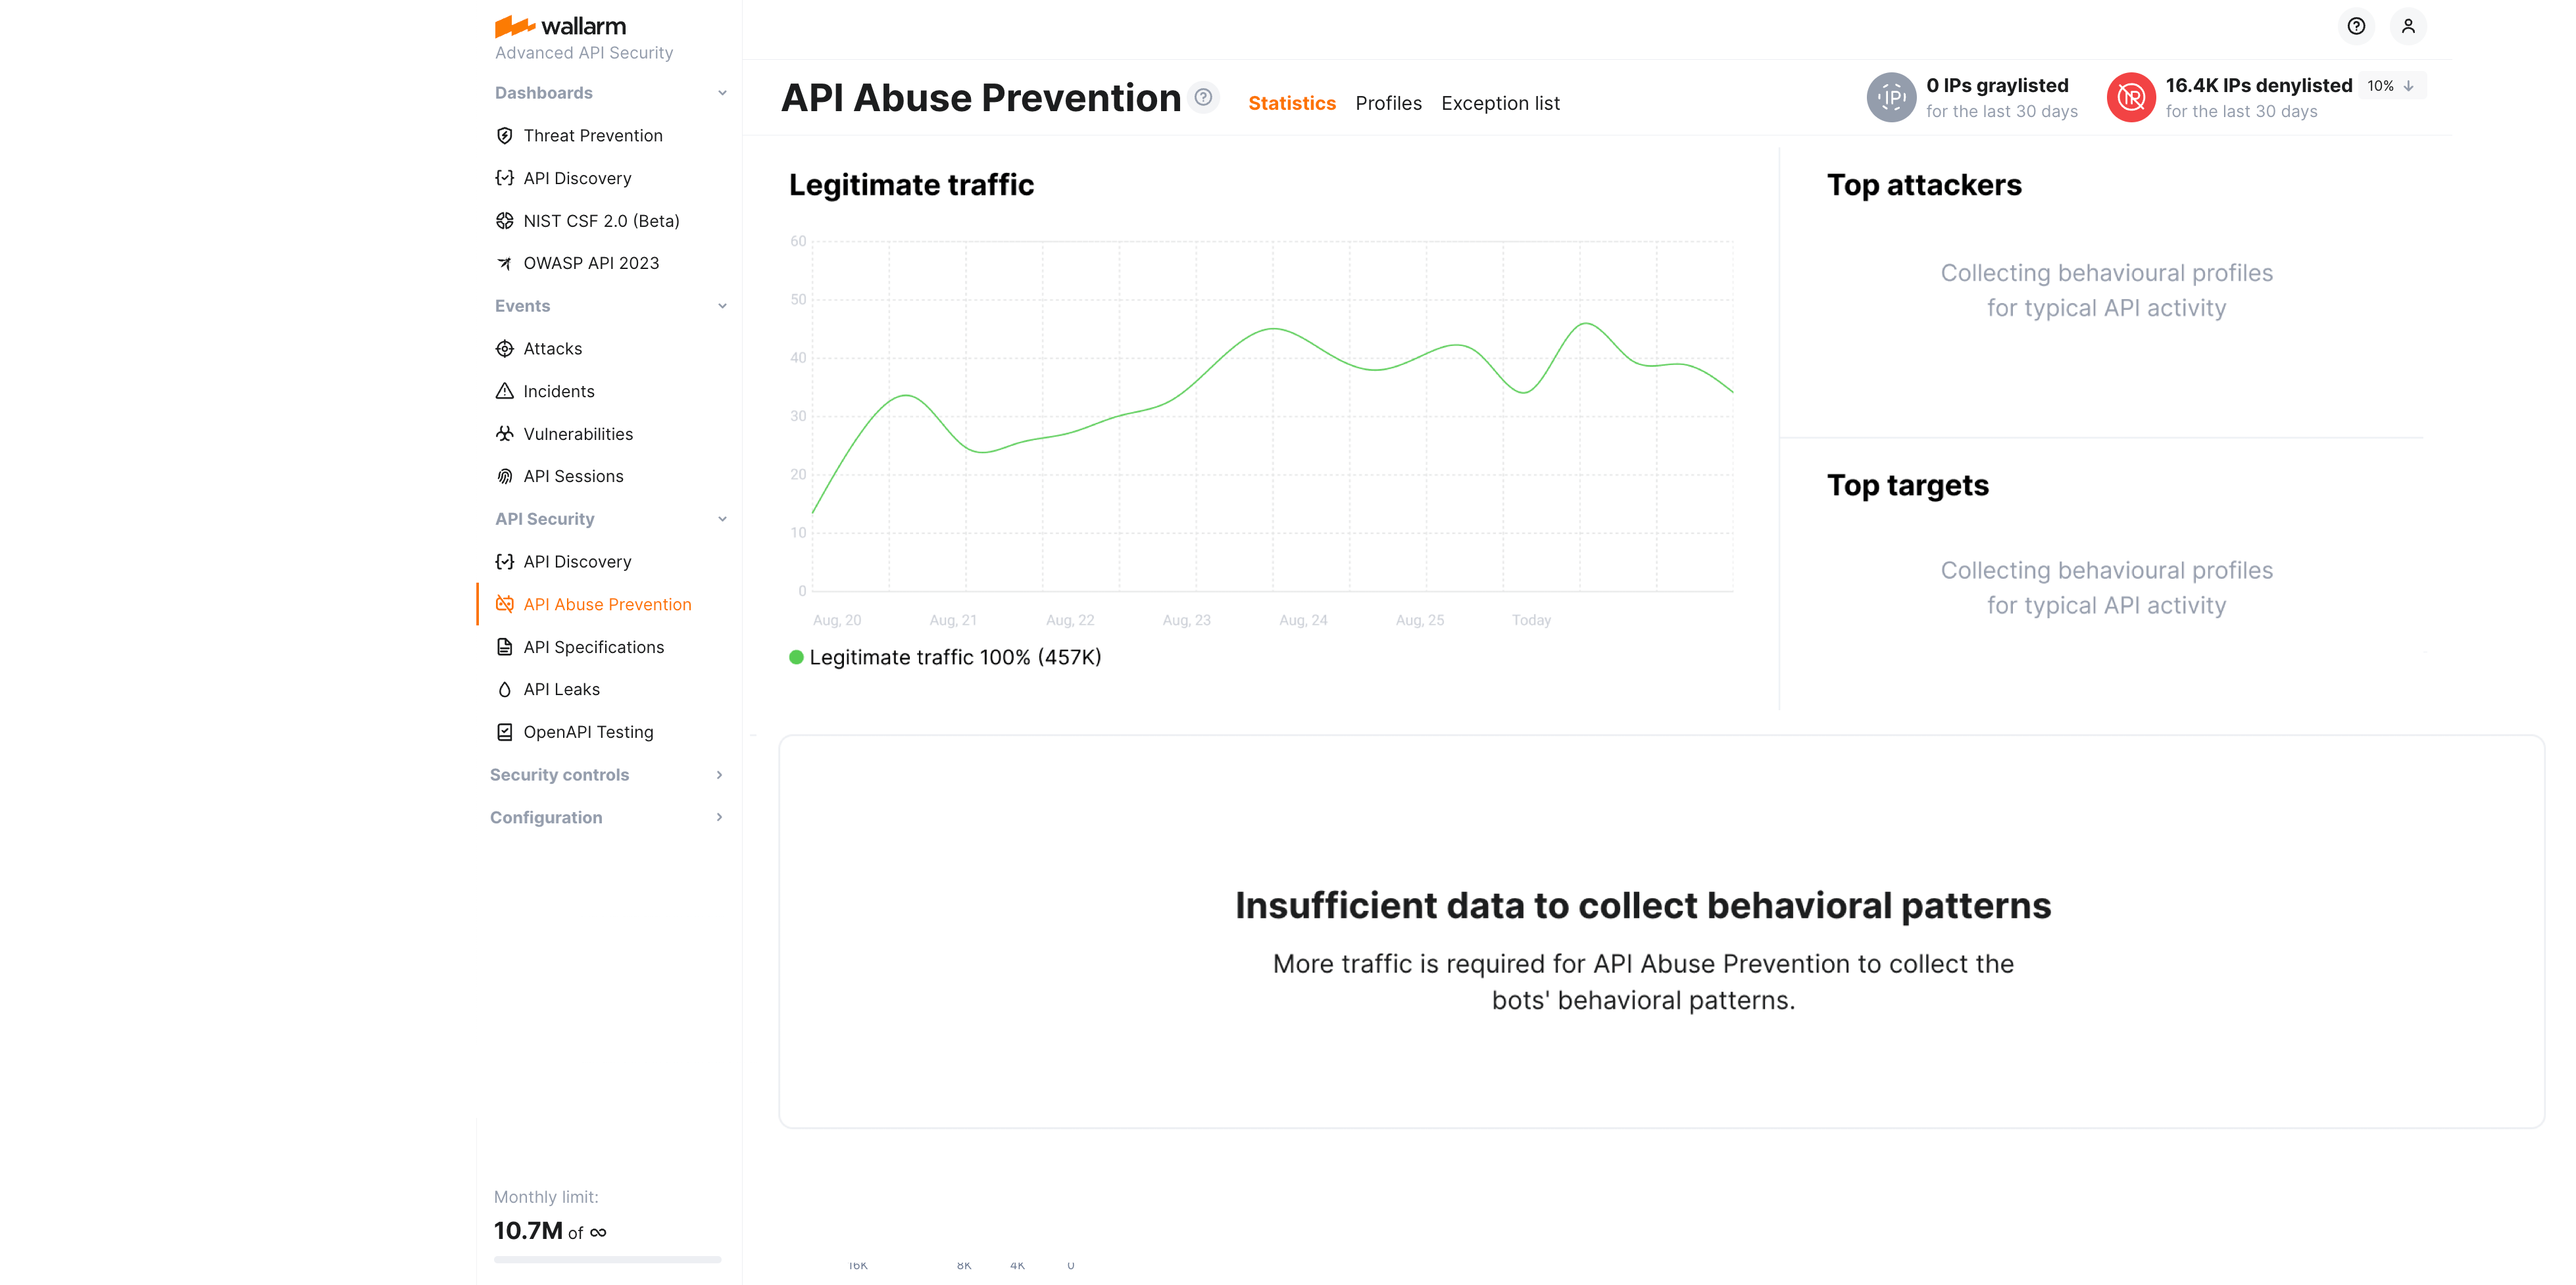
Note that bot detection relies on the traffic - if there is not a sufficient amount of it, API Abuse Prevention notifies about that with the Insufficient data to build statistics message. You can check the per-profile traffic on the Profiles tab.
Attacks
You can explore attacks performed by bots in Wallarm Console → Attacks section. Use the api_abuse, account_takeover, scraping and security_crawlers search keys or select the appropriate options from the Type filter.
Note that:
-
Even if the bot IP is placed into the denylist by API Abuse Prevention, by default, Wallarm collects and displays statistics regarding blocked requests originating from it.
-
The detailed information on the bot attack is stored for 31 days: while the attack itself may remain in the Attacks section for a longer time, after 31 days, if you expand it, no detector values or heatmaps will be presented -
Not enough datamessage will be displayed instead.
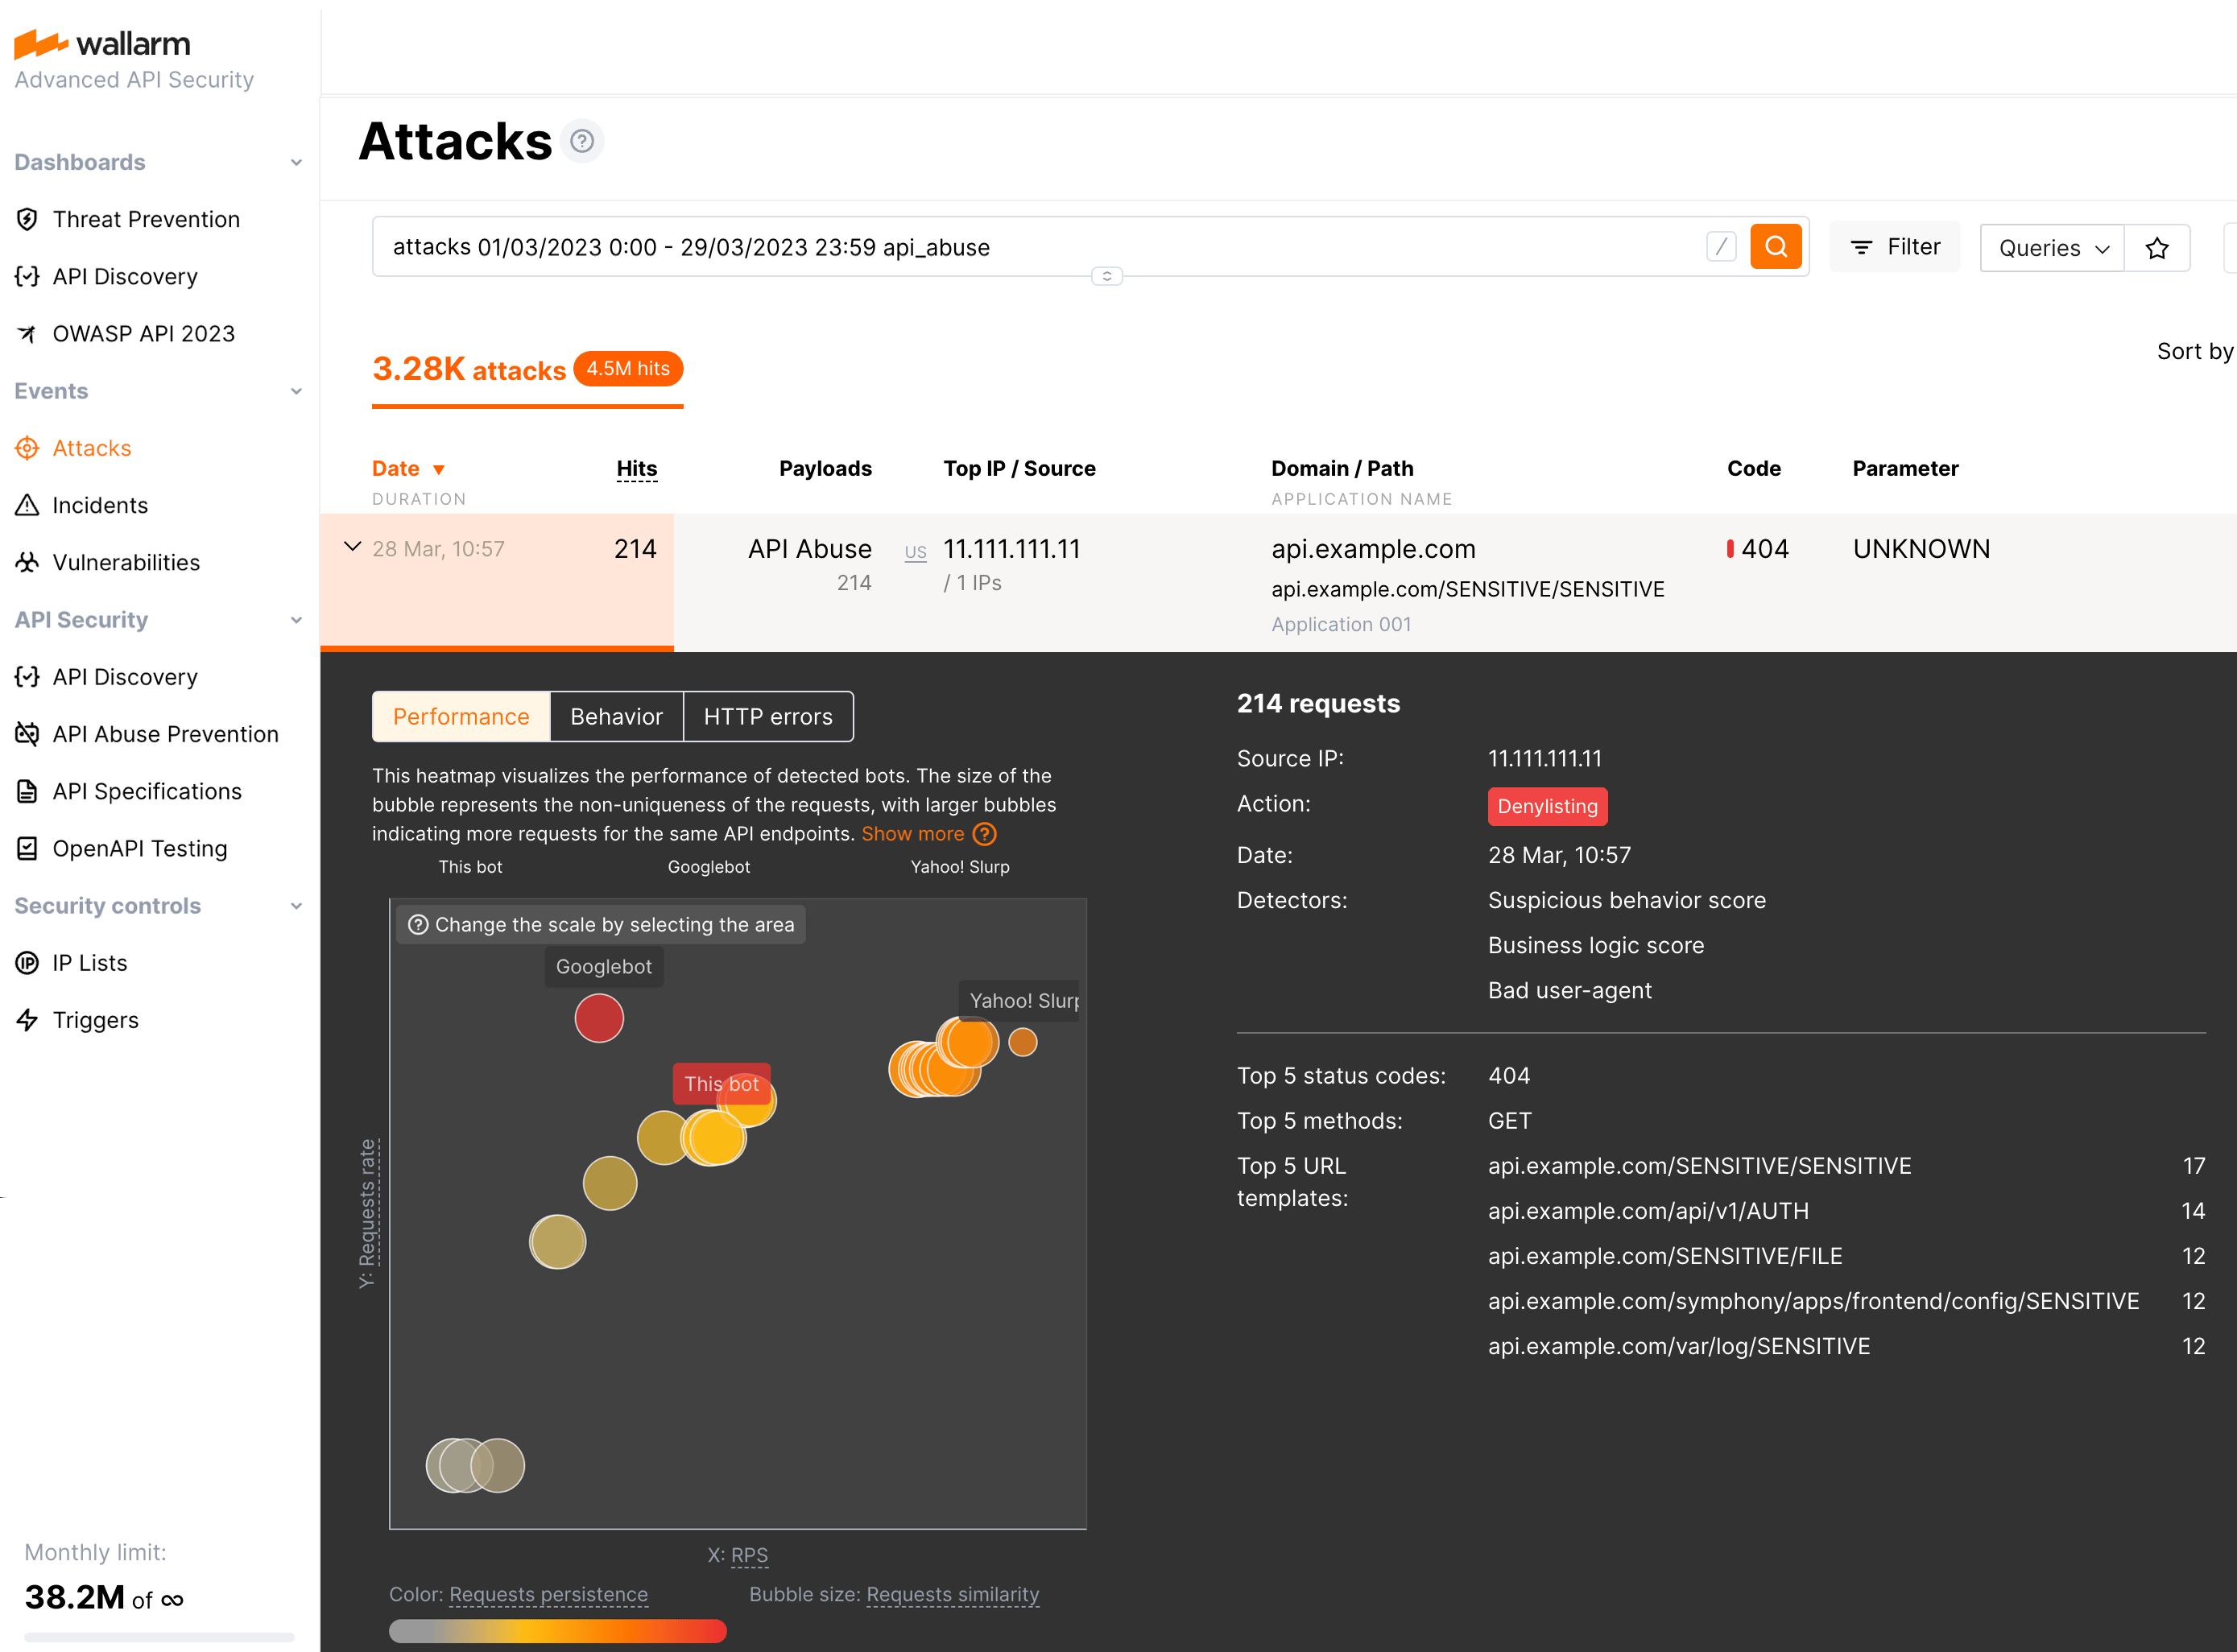
Detector values
Pay attention to the list of triggered detectors and their values showing how big the deviation from normal behavior is for particular anomalies. On the figure above, for example, they are Query abuse with the value 326 when normal is < 10, Request interval with the value 0.05 when normal is > 1 and others.
Heatmaps
Bot information is visualized in three heatmaps. In all heatmaps, the bigger the bubble, the closer it is to red color and to the upper right corner - the more reasons to consider this IP to be a bot.
On the heatmaps, you can also compare your current bot (this bot) with the other bots that attacked the same application within the past 24 hours. If too many bots did that, only the 30 most suspicious will be displayed.
The heatmaps:
-
Performance visualizes the performance of the current and other detected bots including their request non-uniqueness, scheduled requests, RPS, and request interval.
-
Behavior visualizes the suspicious behavior score of the current and other detected bots including their degree of suspicious behavior, amount of requests to critical or sensitive endpoints, RPS and the number of bot detectors that detected them as bots.
-
HTTP errors visualizes the API errors caused by bot activities including the number of different endpoints they target, the number of unsafe requests they make, their RPS, and the number of error response codes they receive.
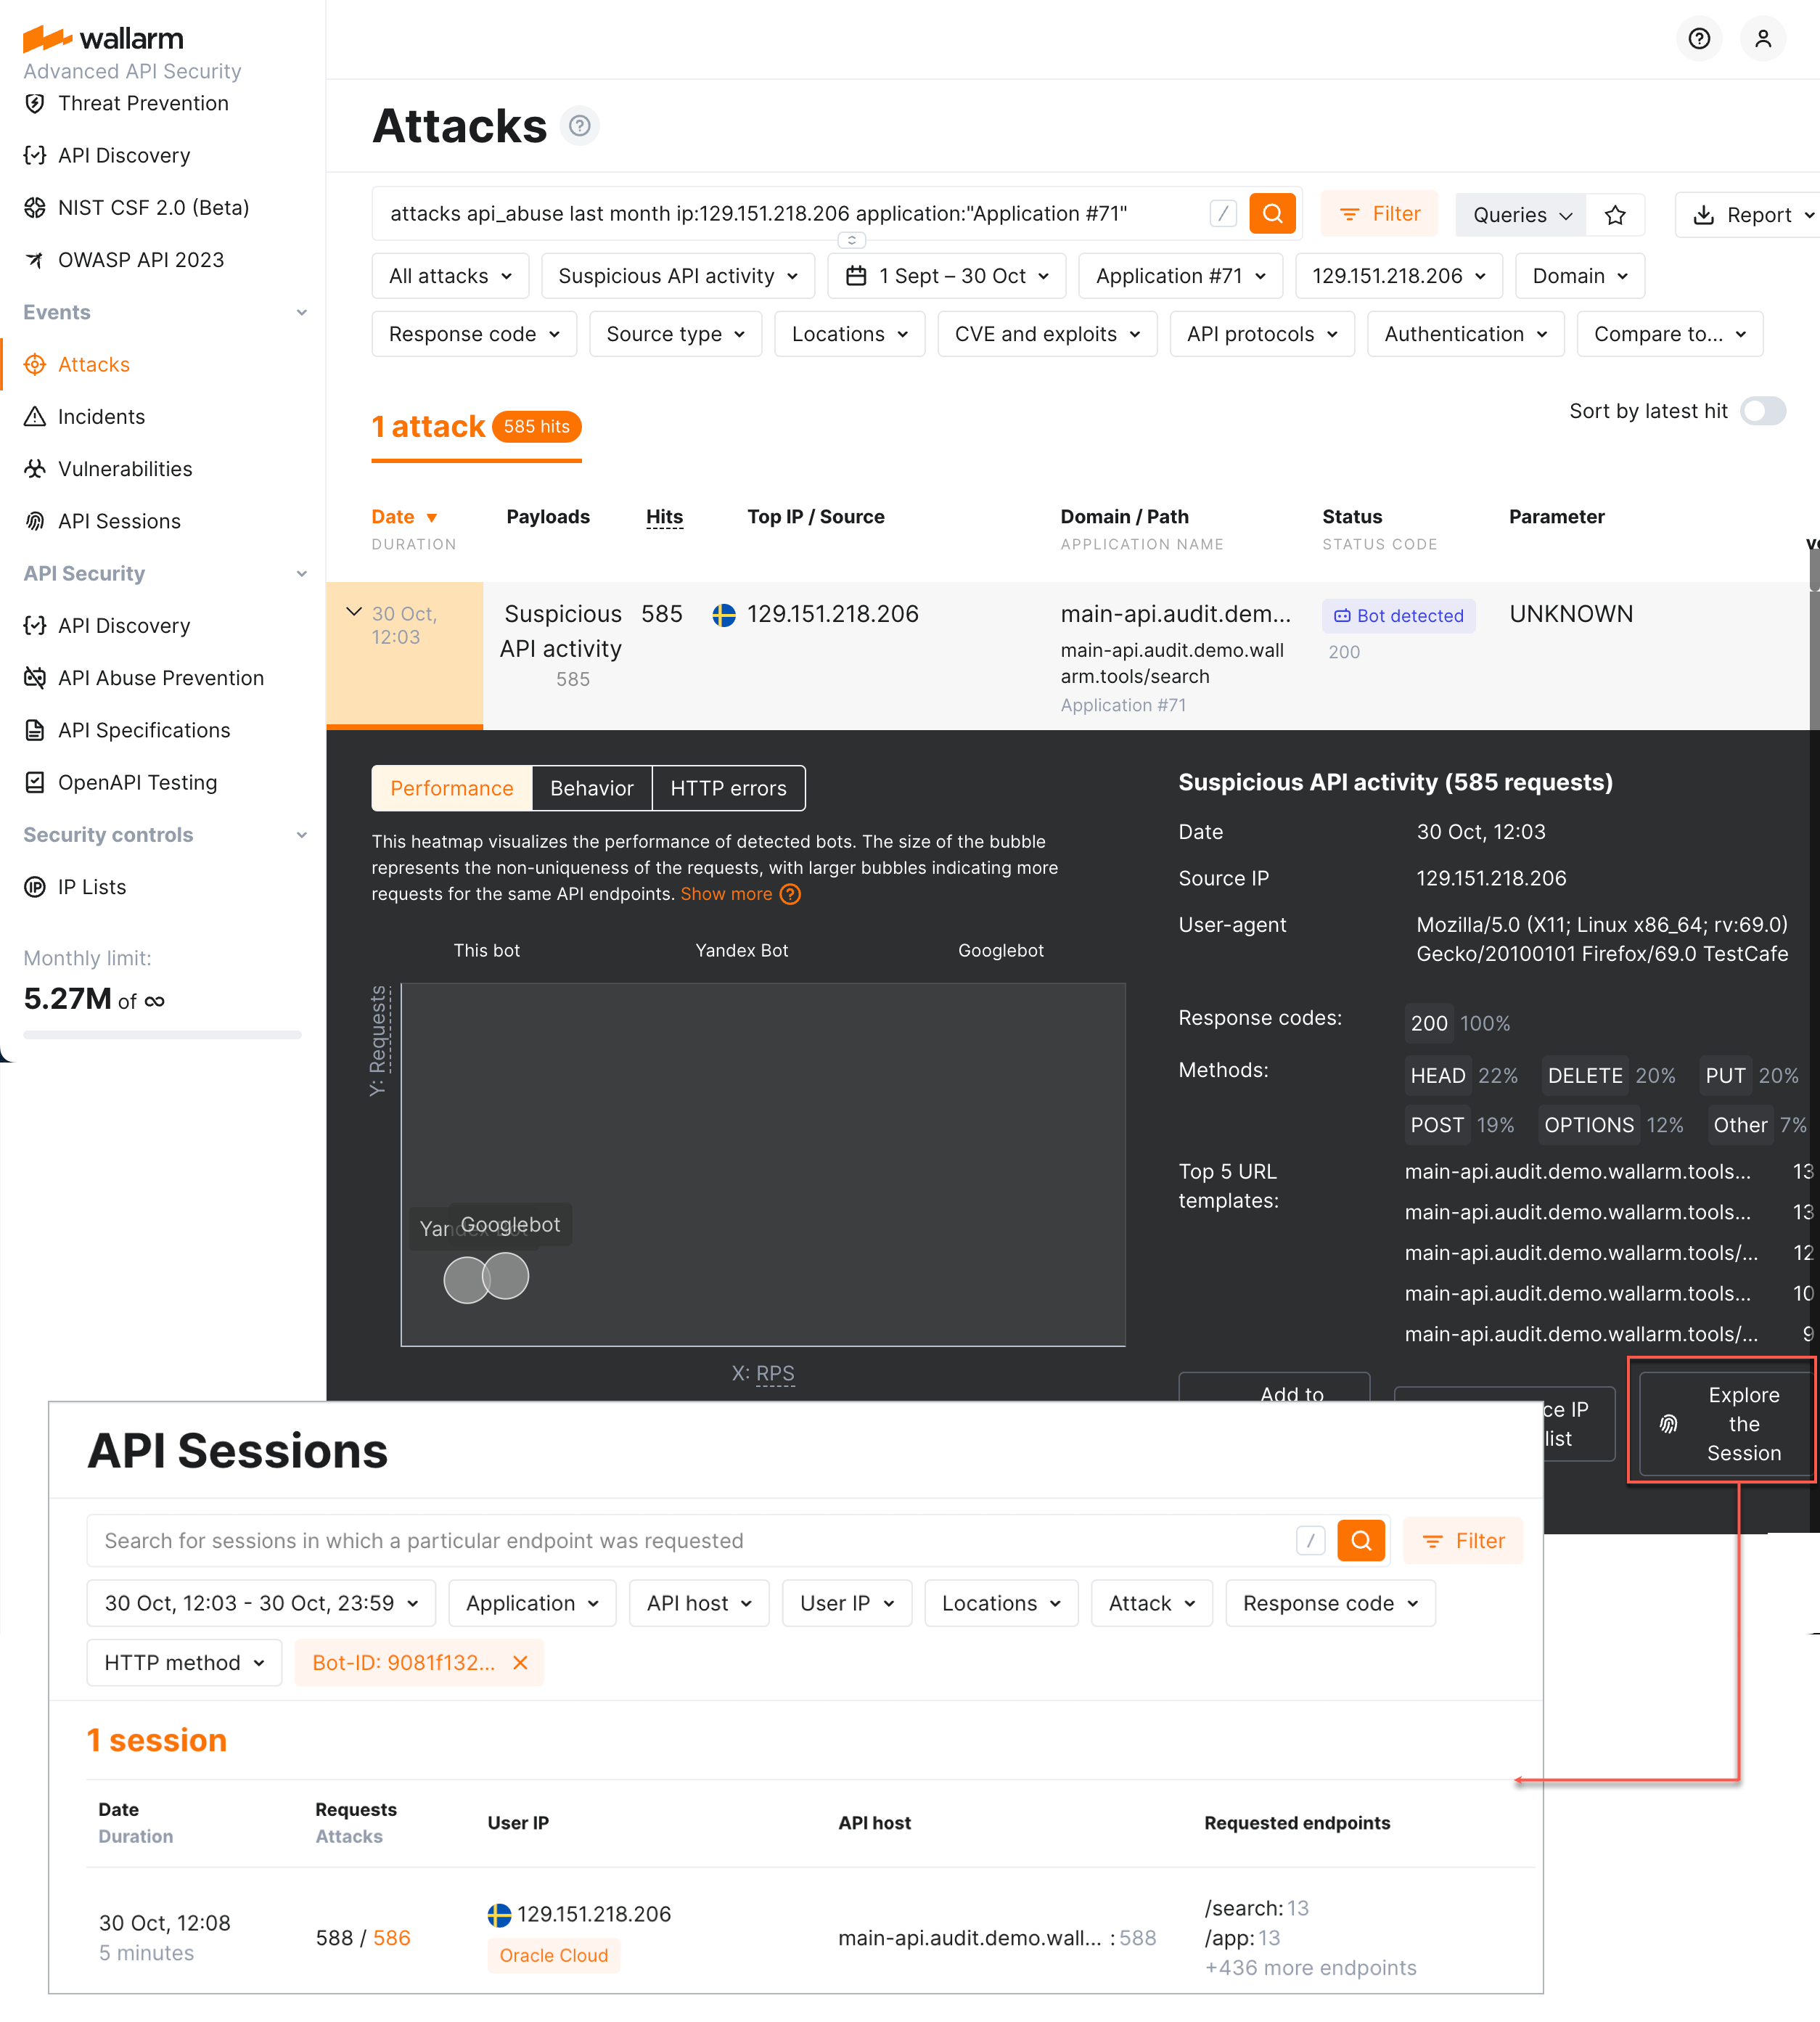
Verifying API abuse detection accuracy with API Sessions
Once the malicious bot activity is detected by Wallarm's API Abuse Prevention and displayed in the Attacks section, you can see the full context of this attack's requests: to which user session they belong and what the full sequence of requests in this session is. This allows you to investigate all activity of the actor to verify whether the decision to mark this actor as a malicious bot was correct.
To perform this analysis, in Wallarm Console → Attacks, access the bot attack details, then click Explore in API Sessions. Wallarm will open the API Session section filtered: the session(s) related to these bot activities will be displayed.