Logstash üzerinden Splunk Enterprise
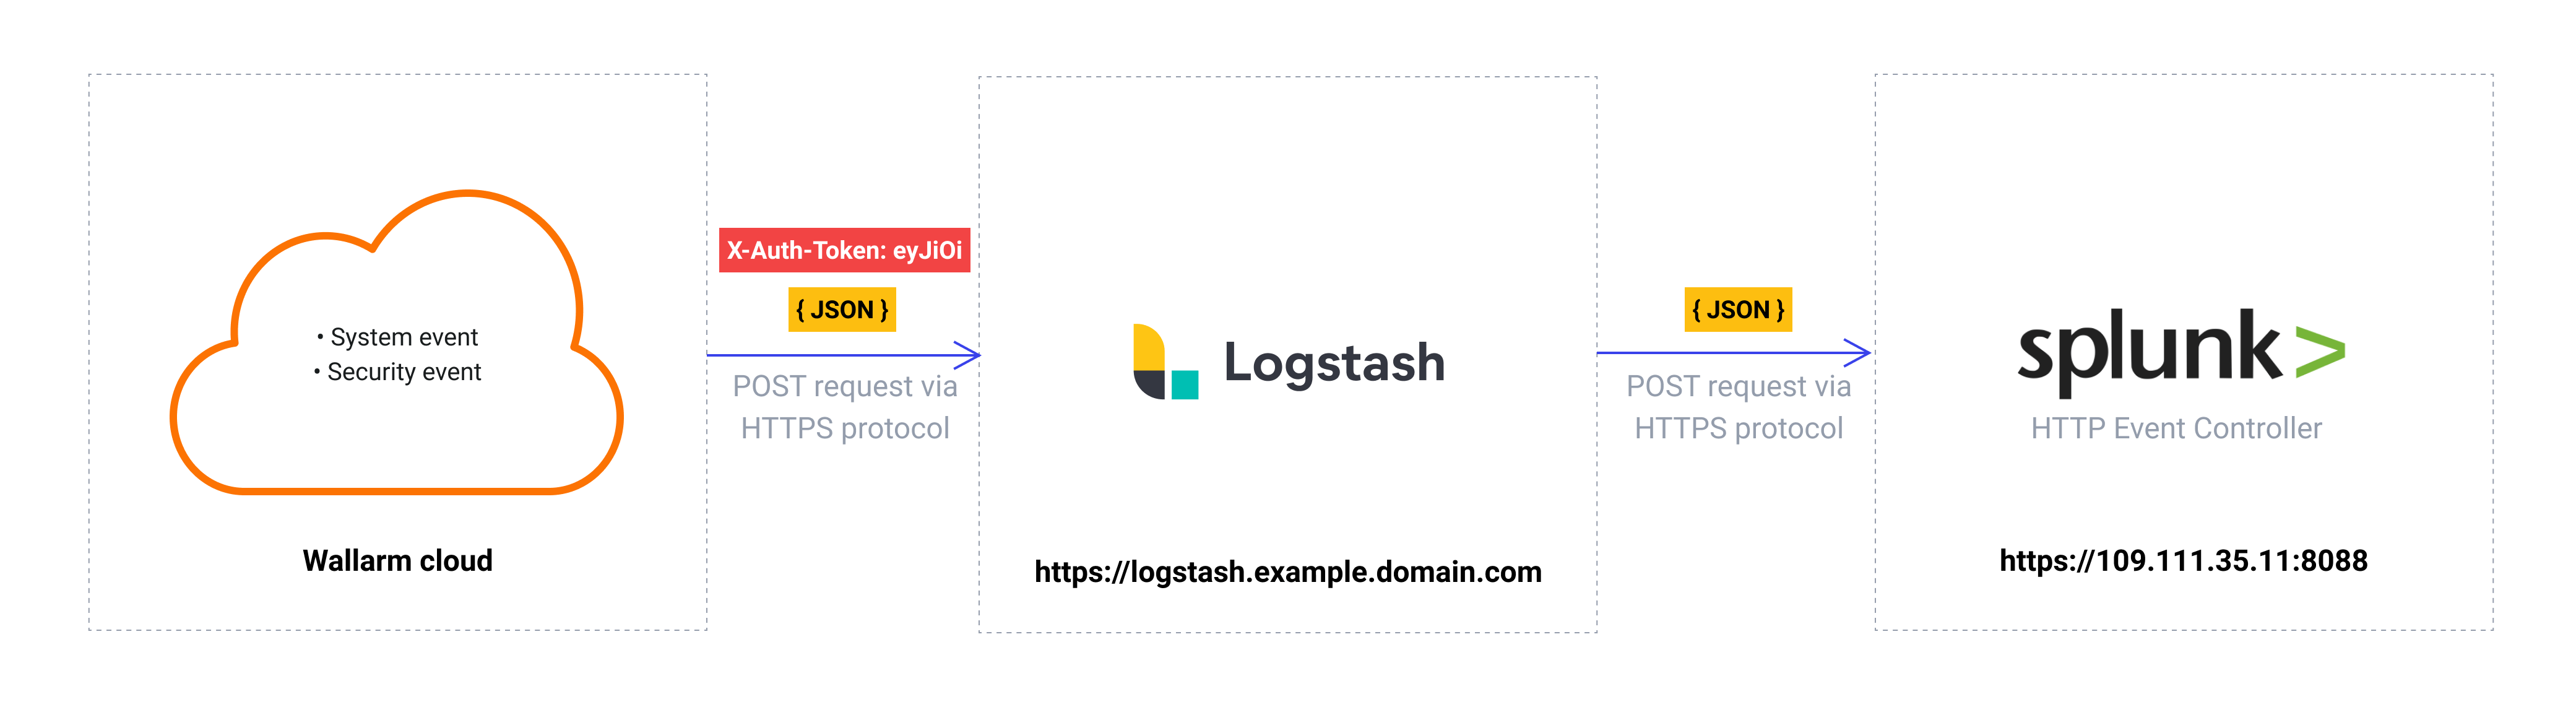
Bu talimatlar, Wallarm’ın Logstash veri toplayıcı ile entegrasyonuna ilişkin bir örnek sunar; olayların Splunk SIEM sistemine iletilmesini sağlar.
The most common logging scheme in complex systems consists of the following components:
-
Data collector: accepts logs from several sources and forwards logs to the SIEM system
-
SIEM system or log management systems: used to analyze logs and monitor the system status
Kullanılan kaynaklar
-
Splunk Enterprise WEB URL
https://109.111.35.11:8000ve API URLhttps://109.111.35.11:8088ile -
Debian 11.x (bullseye) üzerine kurulu ve
https://logstash.example.domain.comüzerinden erişilebilen Logstash 7.7.0 -
Logstash entegrasyonunu yapılandırmak için EU cloud içindeki Wallarm Console’a yönetici erişimi
Wallarm Cloud IP addresses
To provide Wallarm Cloud access to your system, you may need a list of its public IP addresses:
Splunk Enterprise ve Logstash servislerine ait bağlantılar örnek olarak verildiğinden yanıt vermezler.
Splunk Enterprise yapılandırması
Logstash günlükleri, Wallarm Logstash logs adı ve diğer varsayılan ayarlarla Splunk HTTP Event Controller’a gönderilir:
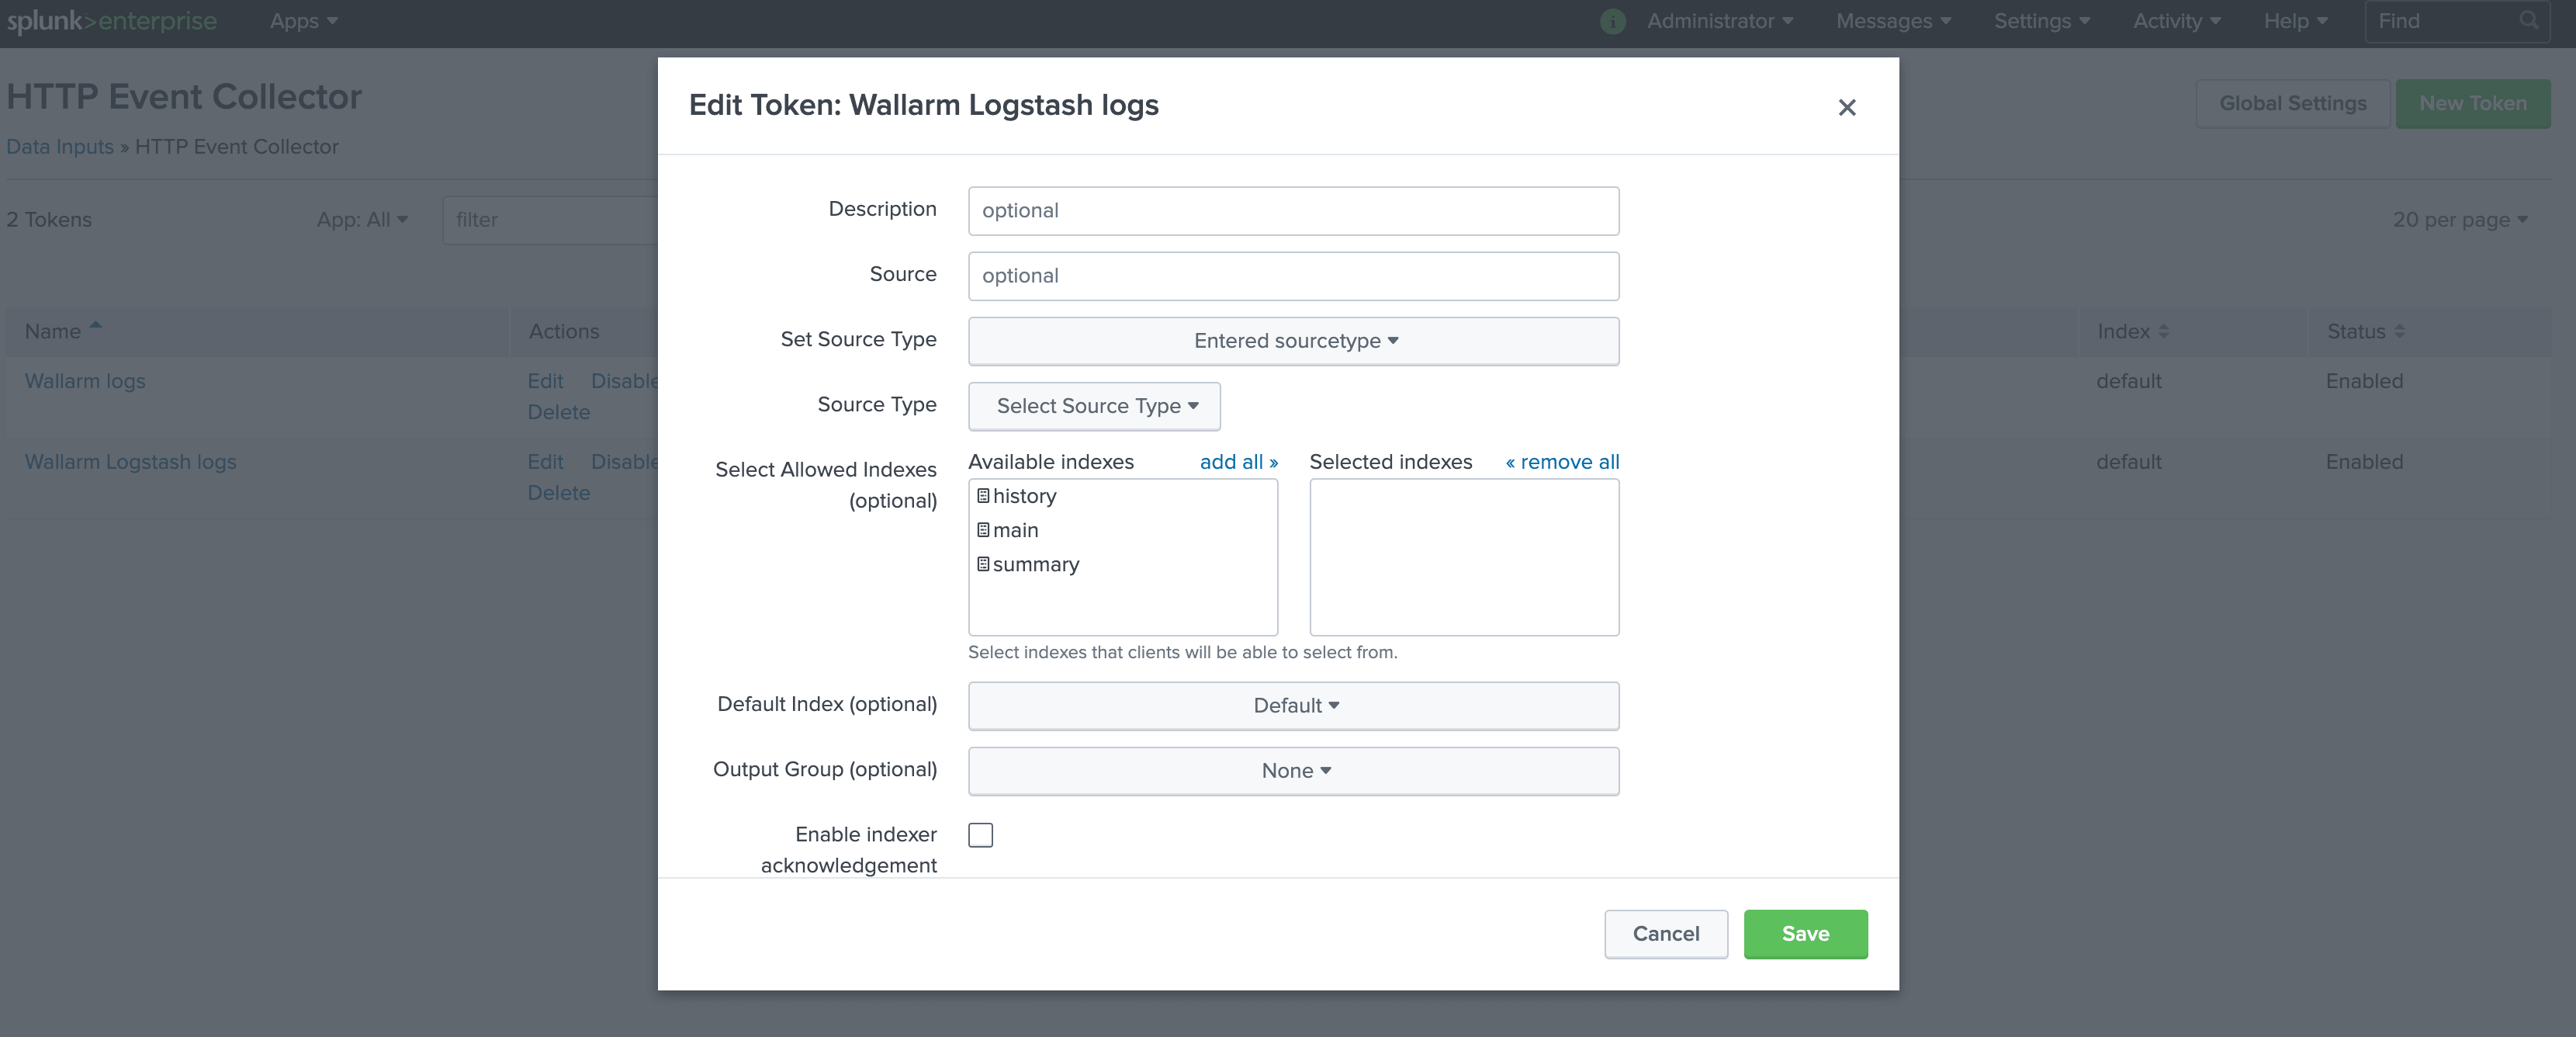
HTTP Event Controller’a erişmek için oluşturulan 93eaeba4-97a9-46c7-abf3-4e0c545fa5cb jetonu kullanılacaktır.
Splunk HTTP Event Controller kurulumunun daha ayrıntılı açıklaması resmi Splunk dokümantasyonunda mevcuttur.
Logstash yapılandırması
Wallarm, günlükleri webhooks üzerinden ara veri toplayıcı olan Logstash’e gönderdiğinden Logstash yapılandırması aşağıdaki gereksinimleri karşılamalıdır:
-
POST veya PUT isteklerini kabul etmek
-
HTTPS isteklerini kabul etmek
-
Genel bir URL’ye sahip olmak
-
Günlükleri Splunk Enterprise’a iletmek; bu örnekte günlükleri iletmek için
httpeklentisi kullanılmaktadır
Logstash, logstash-sample.conf dosyasında yapılandırılmıştır:
-
Gelen webhook işleme
inputbölümünde yapılandırılmıştır:- Trafik 5044 portuna gönderilir
- Logstash sadece HTTPS bağlantılarını kabul edecek şekilde yapılandırılmıştır
- Genel olarak güvenilen bir CA tarafından imzalanmış Logstash TLS sertifikası
/etc/server.crtdosyasında bulunmaktadır - TLS sertifikasının özel anahtarı
/etc/server.keydosyasında bulunmaktadır
-
Splunk’a iletim ve günlük çıktılaması
outputbölümünde yapılandırılmıştır:- Günlükler Logstash’ten Splunk’a JSON formatında iletilir
- Tüm olay günlükleri Logstash’ten Splunk API uç noktası
https://109.111.35.11:8088/services/collector/rawadresine POST istekleriyle iletilir. İstekleri yetkilendirmek için HTTPS Event Collector jetonu kullanılır - Logstash günlükleri ayrıca komut satırına yazdırılır (15. kod satırı). Bu ayar, olayların Logstash üzerinden günlüğe yazıldığını doğrulamak için kullanılır
Yapılandırma dosyalarının daha ayrıntılı açıklaması resmi Logstash dokümantasyonunda mevcuttur.
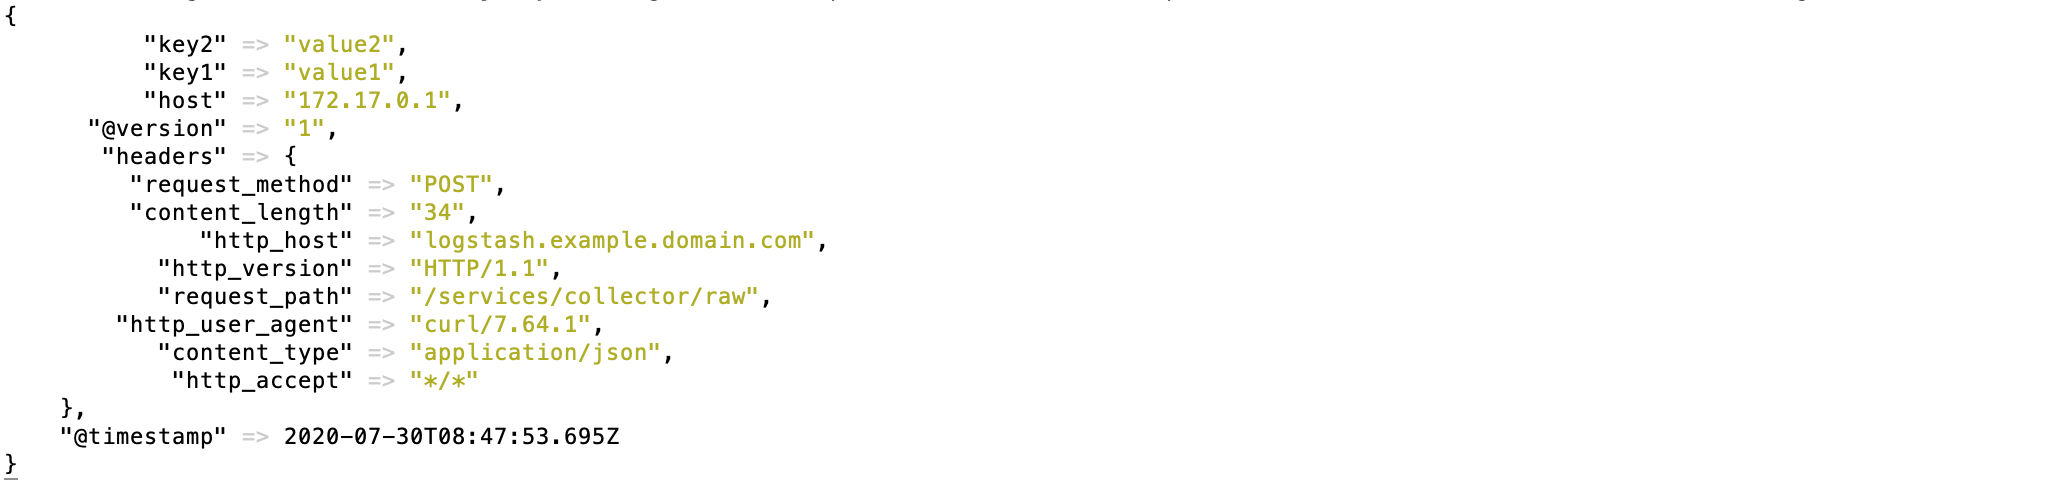
Logstash yapılandırmasını test etme
Logstash günlüklerinin oluşturulup Splunk’a iletildiğini kontrol etmek için Logstash’e POST isteği gönderilebilir.
İstek örneği:
curl -X POST 'https://logstash.example.domain.com' -H "Content-Type: application/json" -H "Authorization: Splunk 93eaeba4-97a9-46c7-abf3-4e0c545fa5cb" -d '{"key1":"value1", "key2":"value2"}'
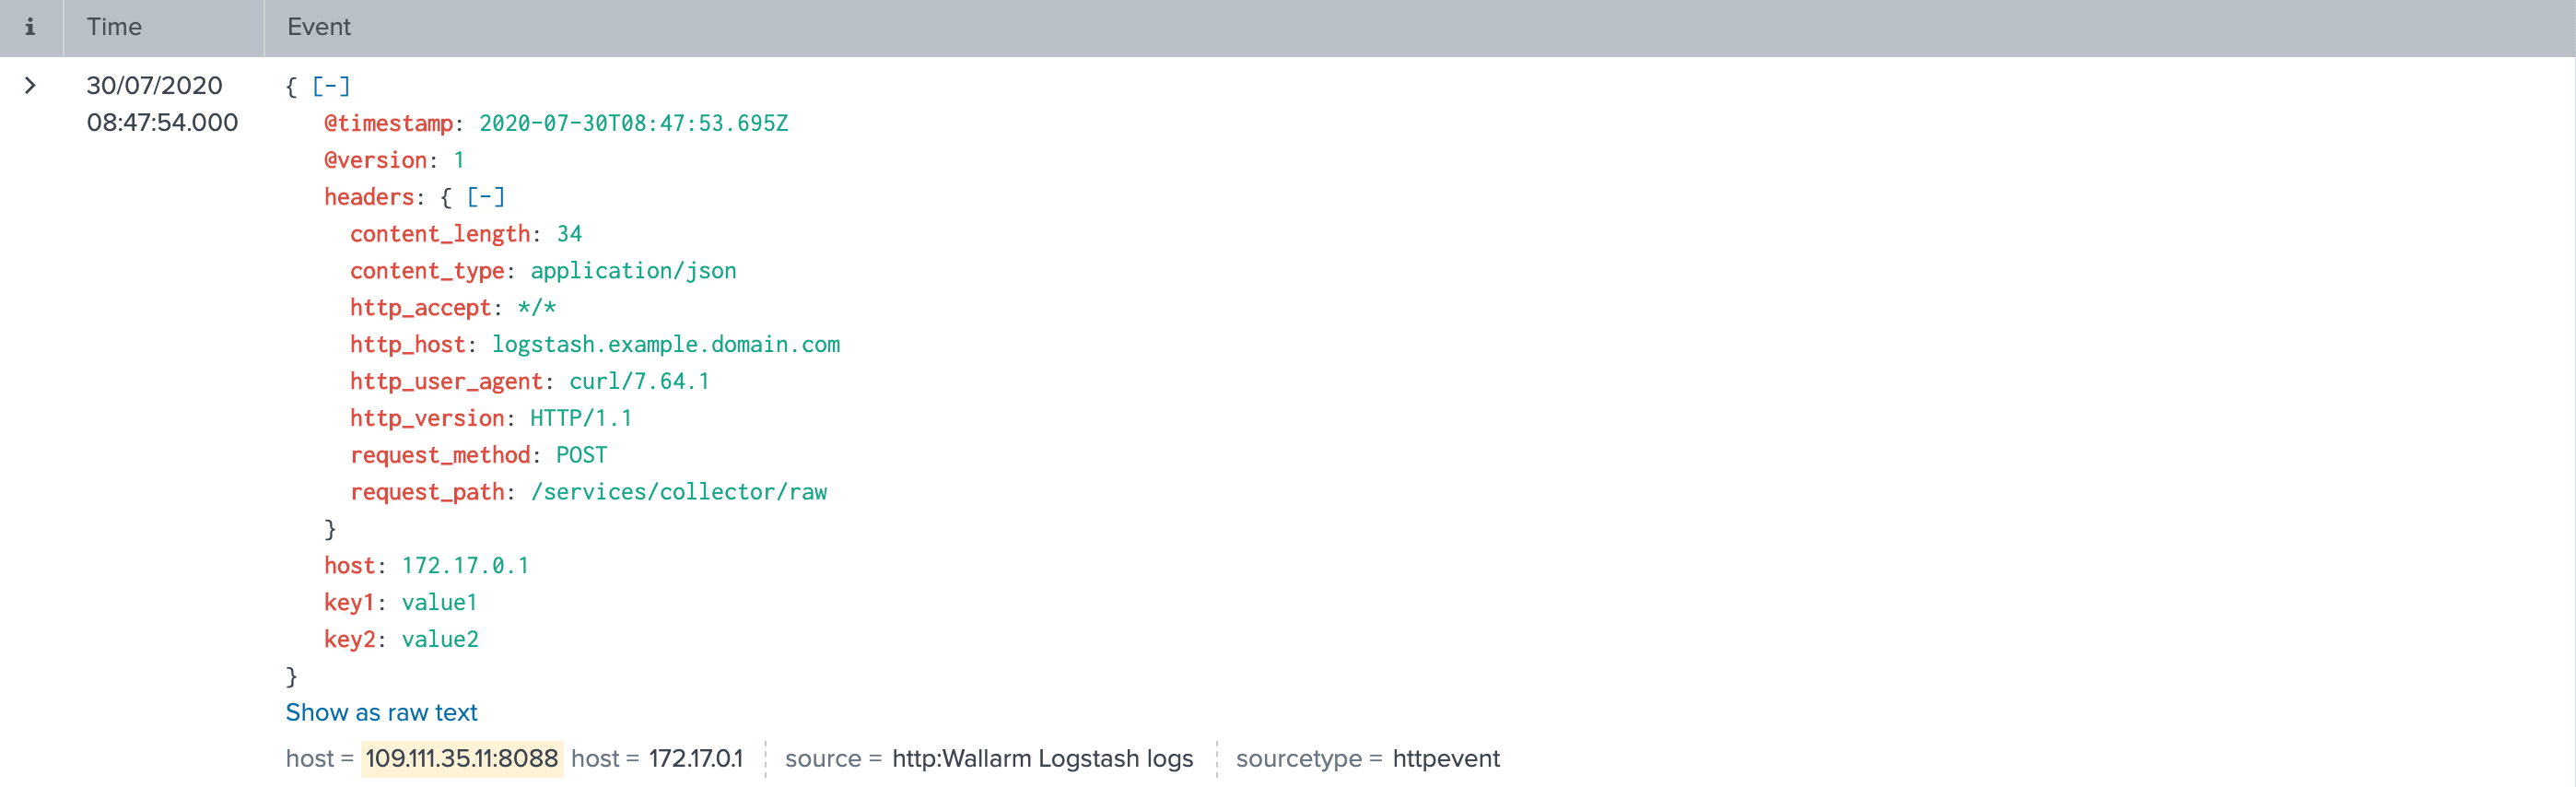
Logstash günlükleri:
Splunk olayı:
Logstash entegrasyonunun yapılandırılması
-
Webhooks are sent to
https://logstash.example.domain.com -
Webhooks are sent via POST requests
-
The webhook integration has default advanced settings
-
Webhooks sent to Webhook URLs are all available events: hits, system events, vulnerabilities, scope changes
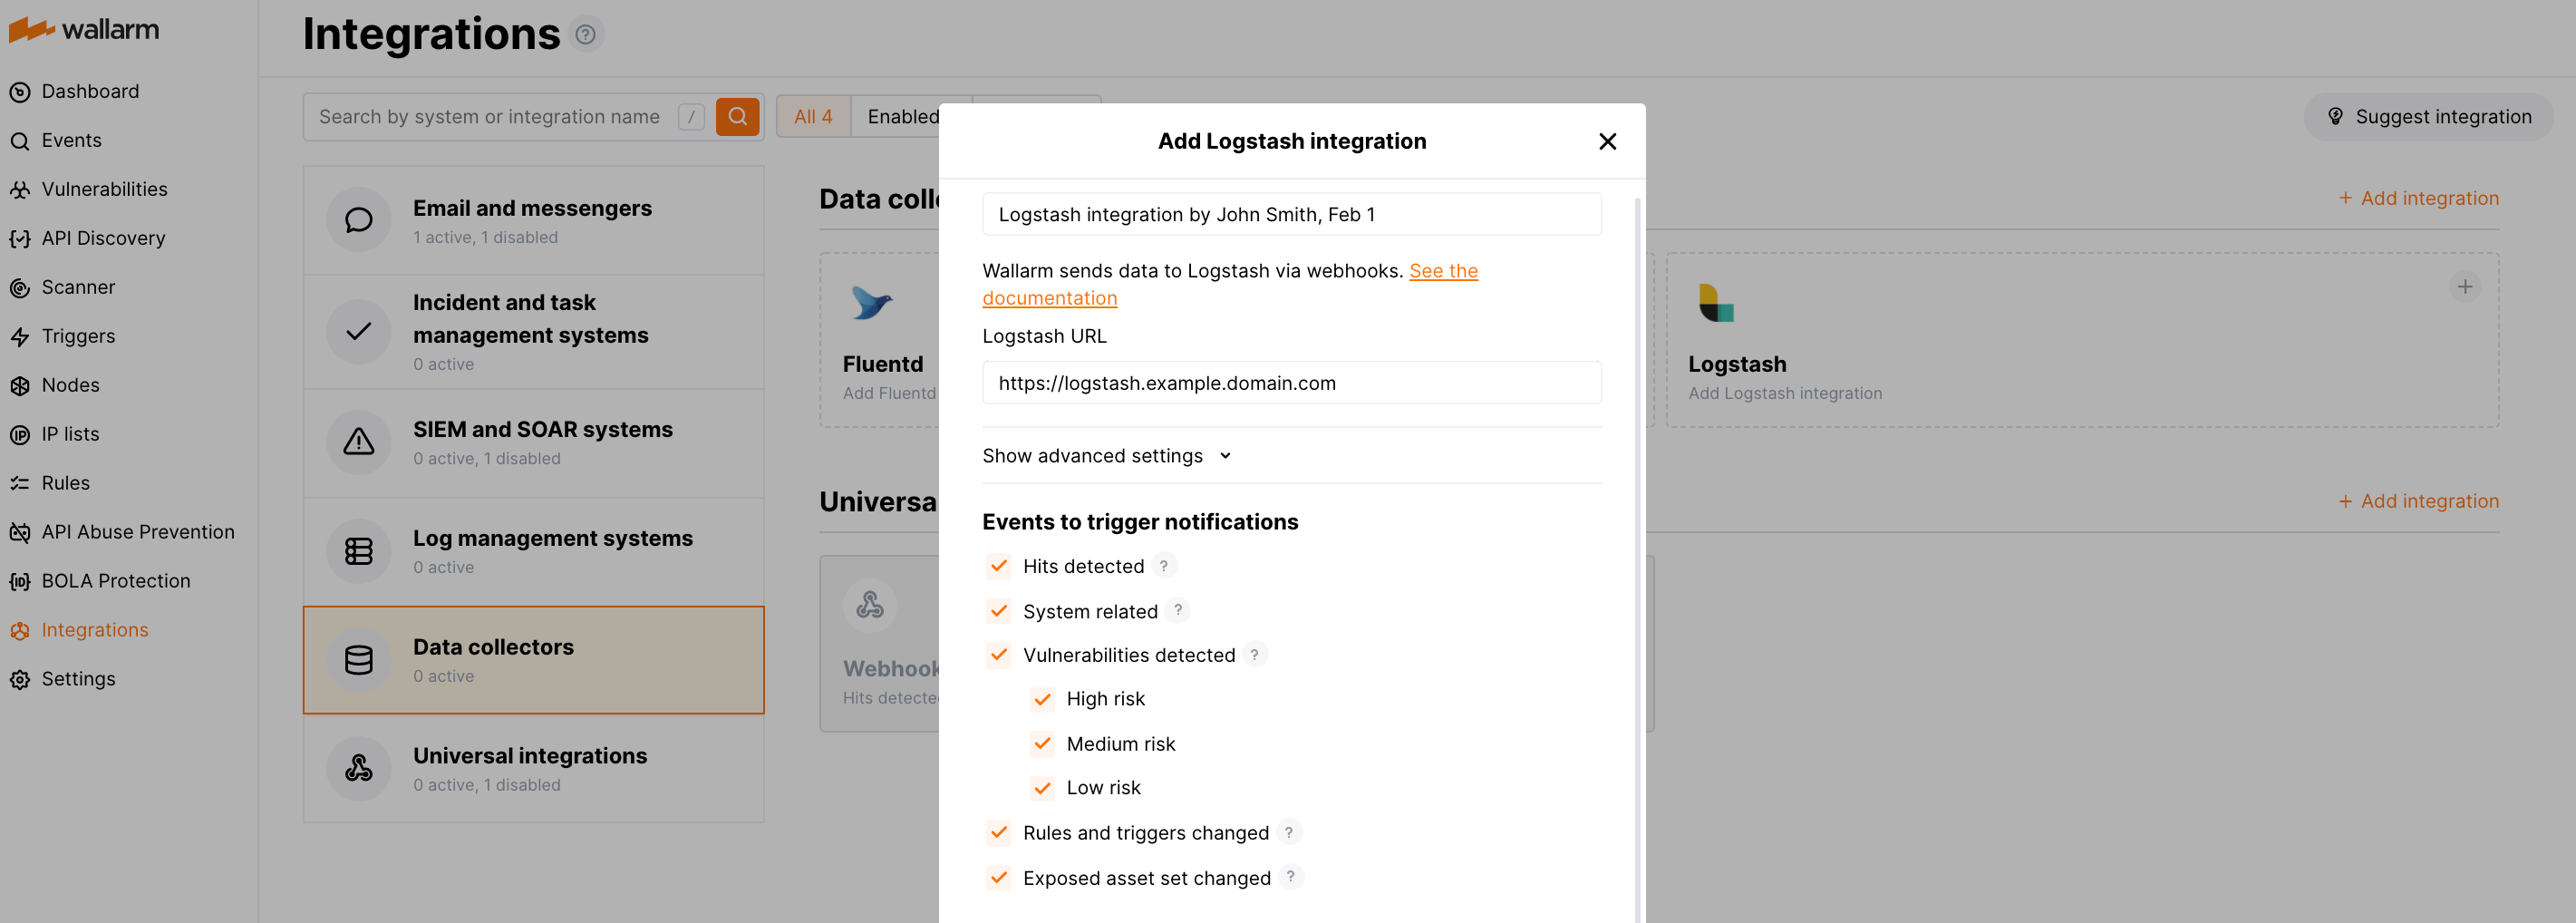
Logstash entegrasyonunun yapılandırması hakkında daha fazla bilgi
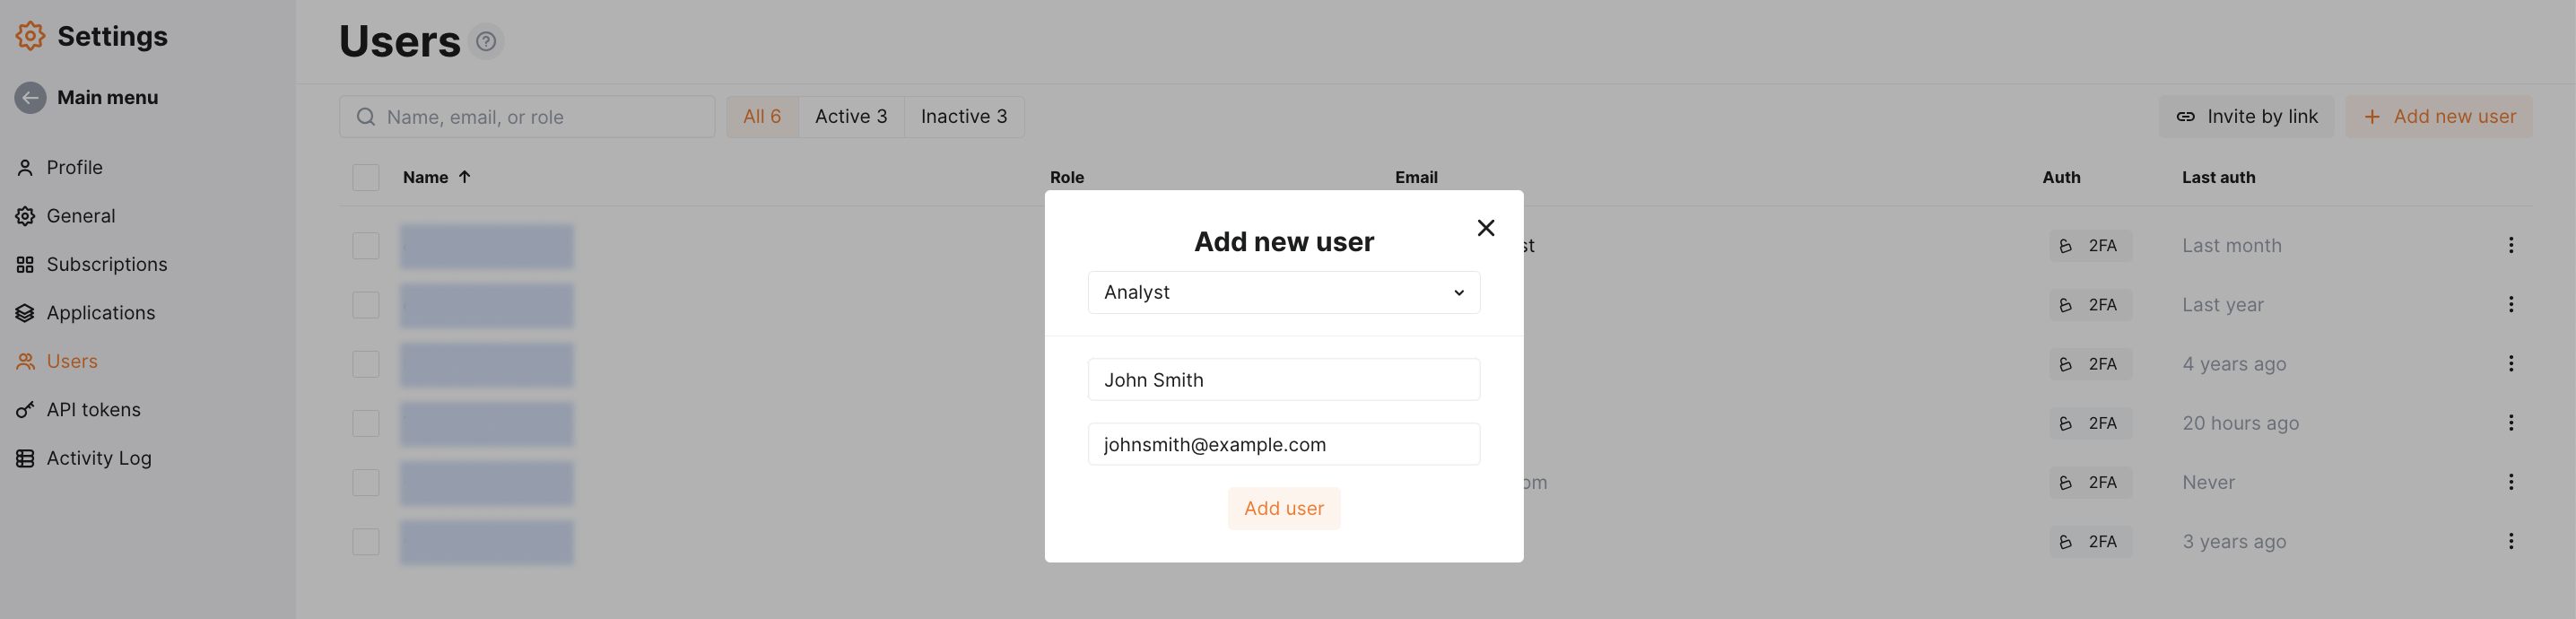
Örnek test
To test the configuration, a new user is added in Wallarm Console:
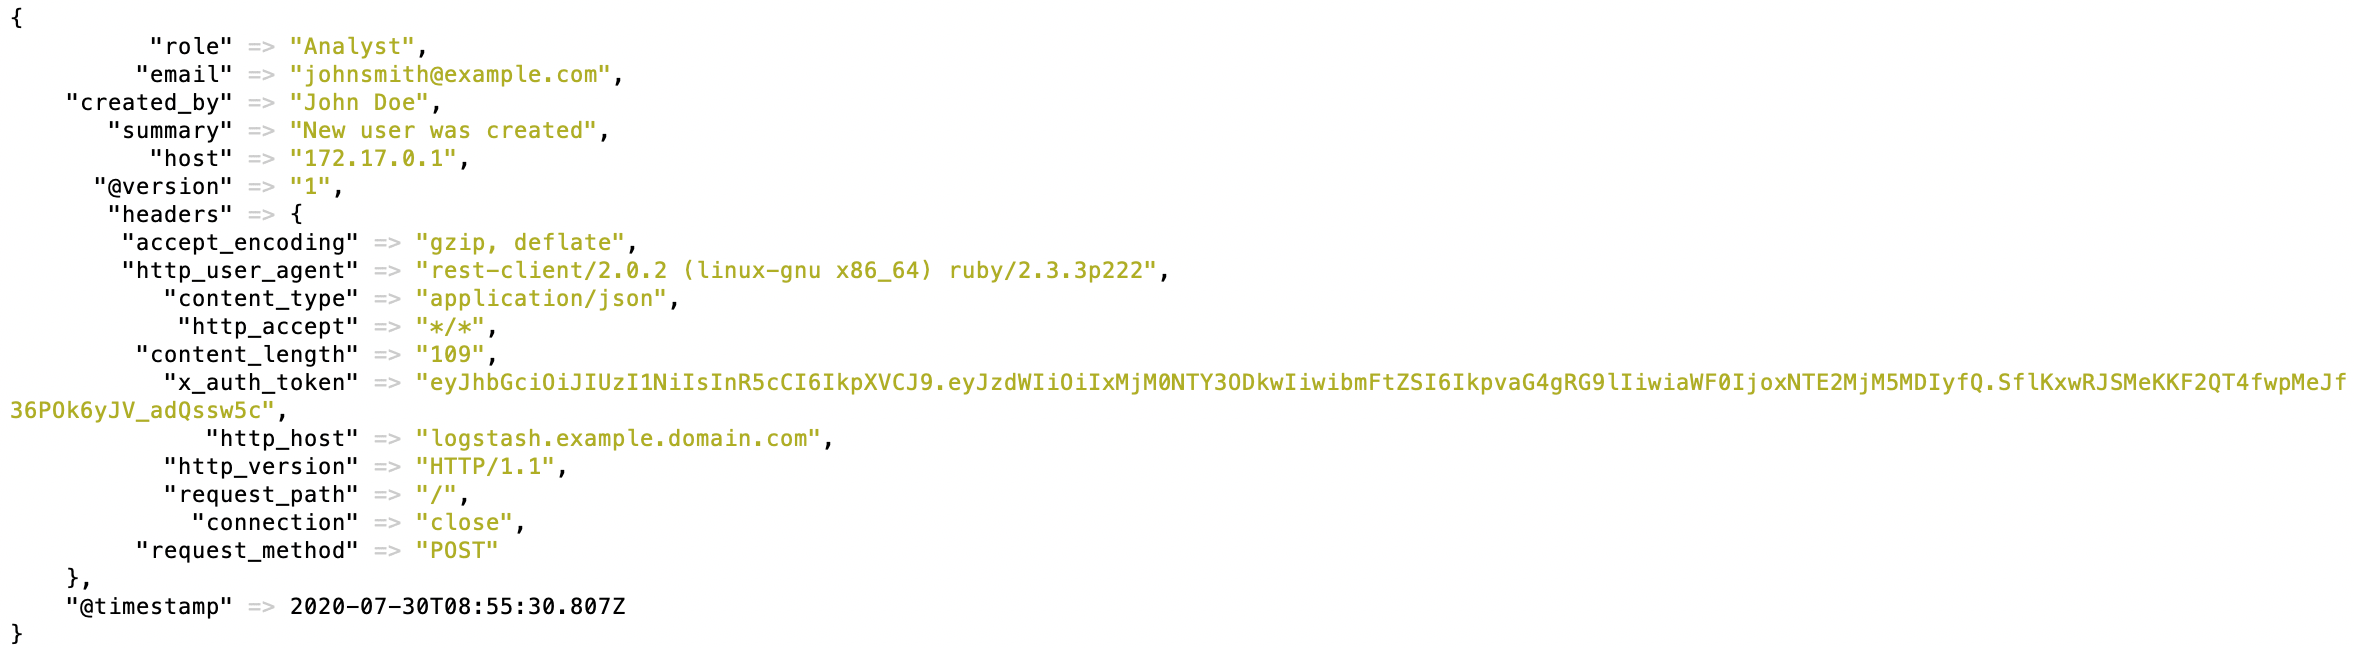
Logstash olayı aşağıdaki gibi günlüğe yazacaktır:
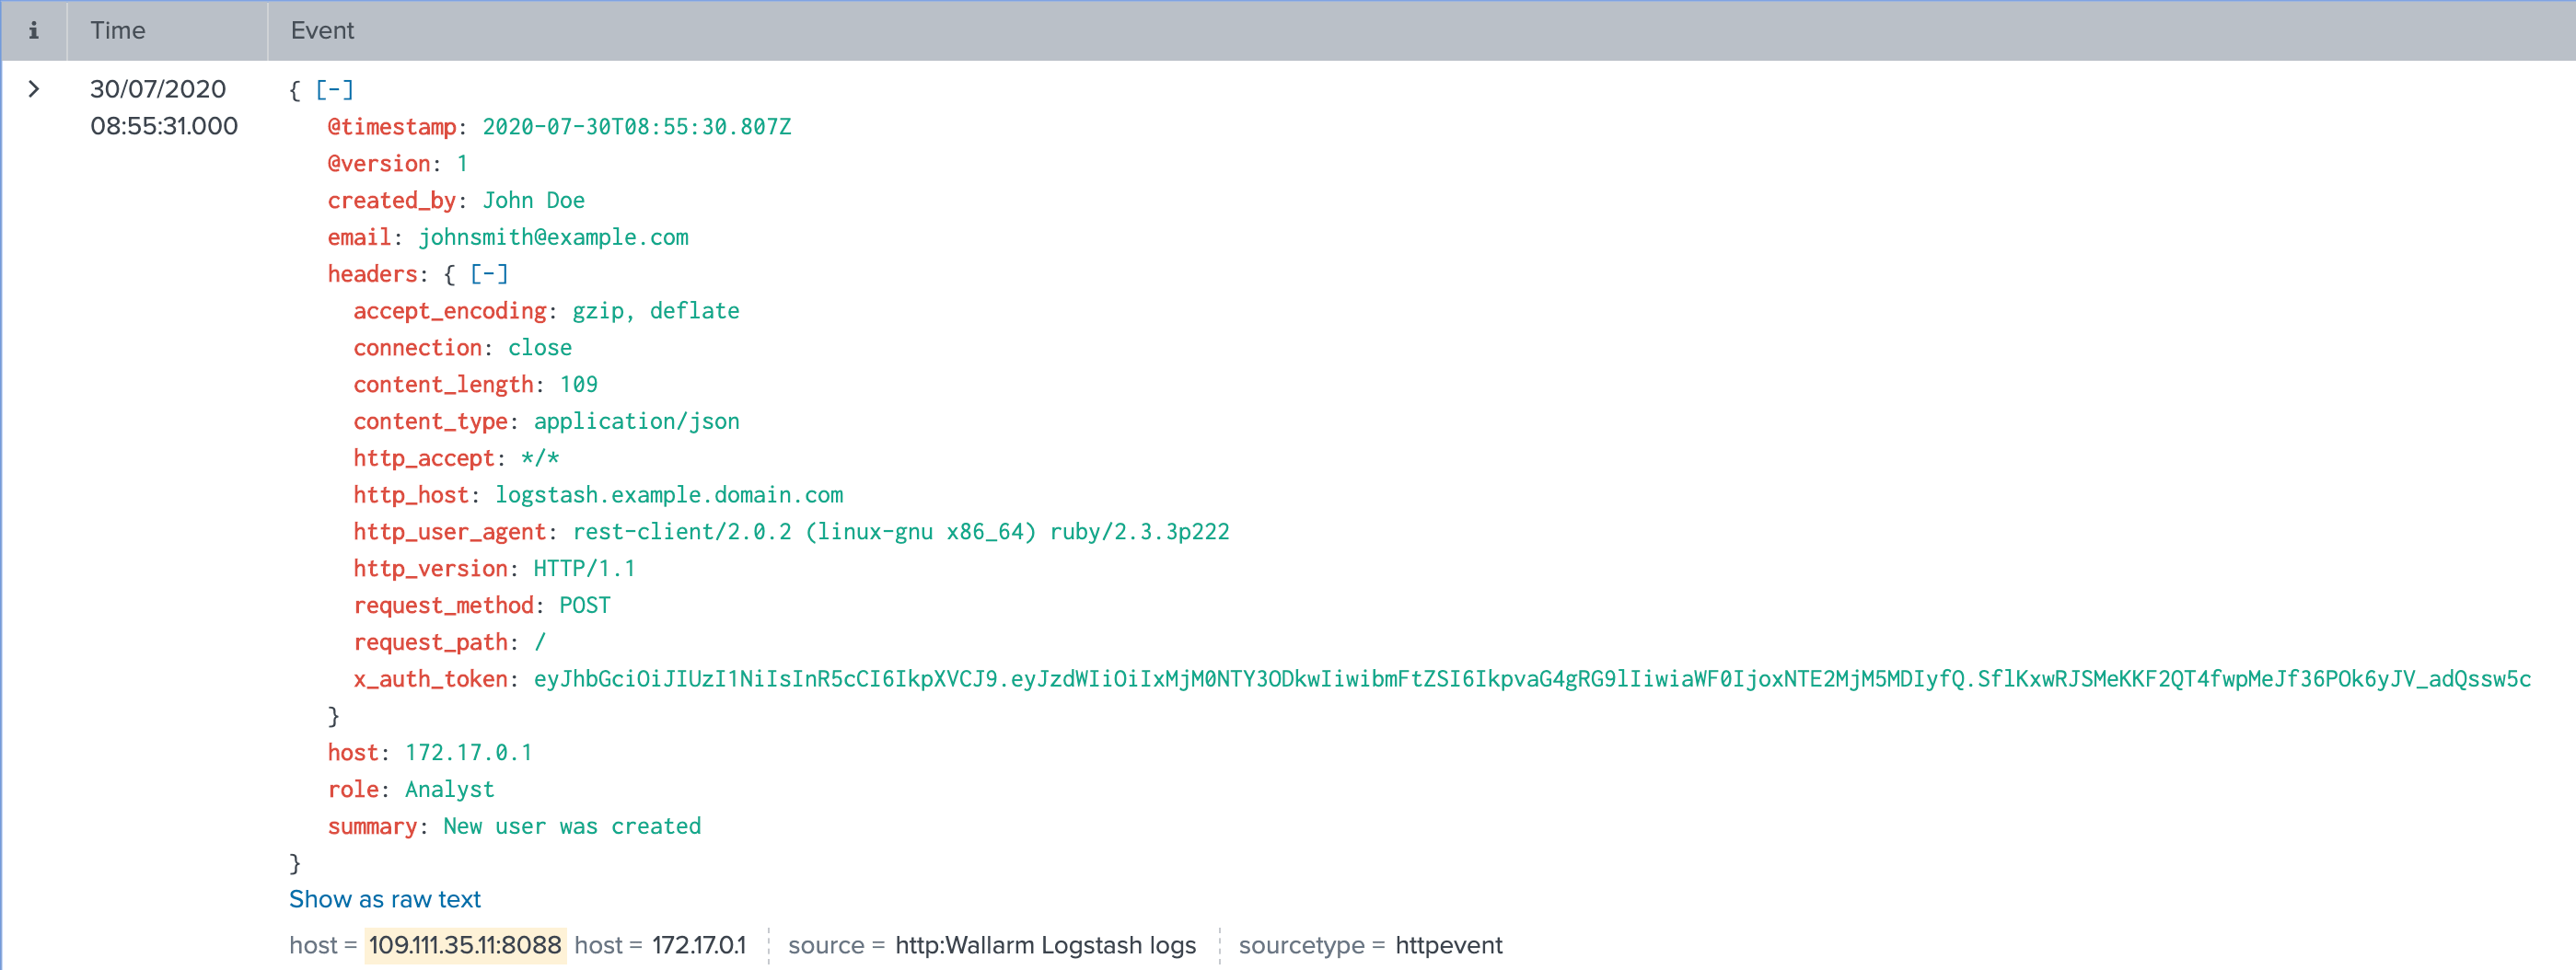
Splunk olaylarında aşağıdaki kayıt görüntülenecektir:
Olayları bir panoda düzenleme
To get Wallarm events organized into a ready-to-use dashboard in Splunk 9.0 or later, you can install the Wallarm application for Splunk.
This application provides you with a pre-configured dashboard that is automatically filled with the events received from Wallarm. In addition to that, the application enables you to proceed to detailed logs on each event and export the data from the dashboard.

To install the Wallarm application for Splunk:
-
In the Splunk UI ➝ Apps find the
Wallarm API Securityapplication. -
Click Install and input the Splunkbase credentials.
If some Wallarm events are already logged in Splunk, they will be displayed on the dashboard, as well as further events Wallarm will discover.
In addition, you can fully customize the ready-to-use dashboard, e.g. its view or search strings used to extract data from all Splunk records.