Splunk
Splunk, günlükler, olaylar ve diğer operasyonel ile iş verileri dahil olmak üzere makine tarafından üretilen verileri aramak, izlemek ve analiz etmek için tasarlanmış bir platformdur. Wallarm'ı Splunk'a uyarılar gönderecek şekilde yapılandırabilirsiniz.
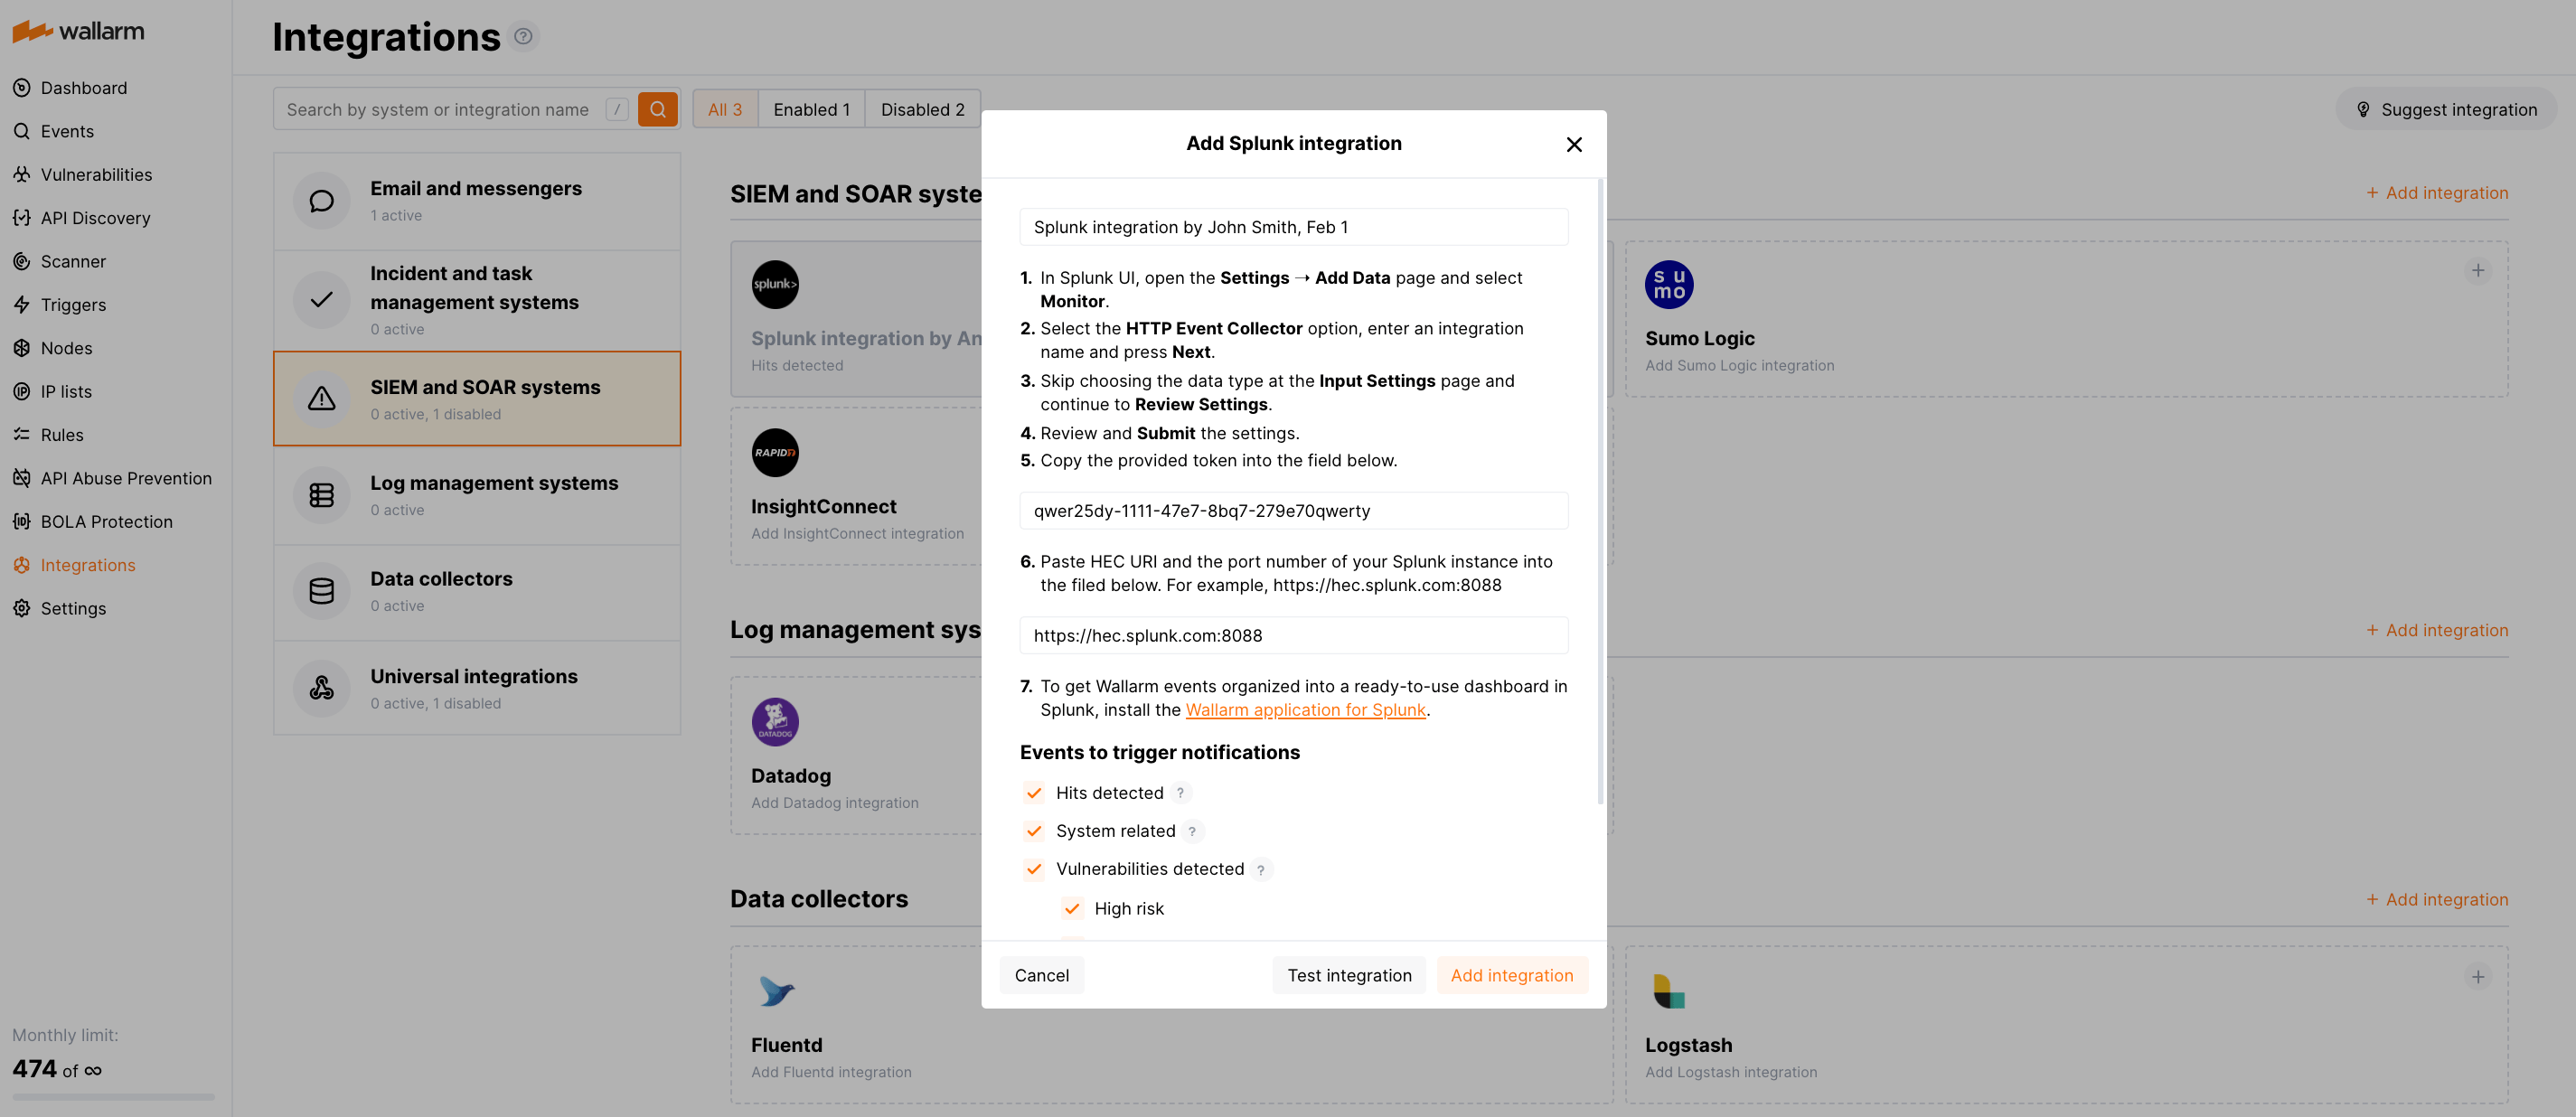
Entegrasyonun yapılandırılması
Splunk UI'de:
-
Settings ➝ Add Data ➝ Monitor'ü açın.
-
HTTP Event Collector seçeneğini seçin, bir entegrasyon adı girin ve Next'e tıklayın.
-
Input Settings sayfasında veri türü seçimini atlayın ve Review Settings'e ilerleyin.
-
Ayarları gözden geçirip Submit'e tıklayın.
-
Sağlanan token'ı kopyalayın.
Wallarm UI'de:
-
Integrations bölümünü açın.
-
Splunk bloğunu tıklayın veya Add integration düğmesine tıklayıp Splunk'u seçin.
-
Bir entegrasyon adı girin.
-
Kopyaladığınız token'ı HEC token alanına yapıştırın.
-
Splunk örneğinizin HEC URI'sini ve port numarasını HEC URI:PORT alanına yapıştırın. Örneğin:
https://hec.splunk.com:8088. -
Bildirimleri tetikleyecek olay türlerini seçin.
Kullanılabilir olaylara ilişkin ayrıntılar:
-
Hits detected except for:
- Experimental hits detected based on the custom regular expression. Non-experimental hits trigger notifications.
- Hits not saved in the sample.
Optionally include the
headersobject with hit headers in hit logs. If disabled, headers are not included in the logs. -
System related:
- User changes (newly created, deleted, role change)
- Integration changes (disabled, deleted)
- Application changes (newly created, deleted, name change)
- Errors during regular update of specifications used for rogue API detection or API specification enforcement
- Rules and triggers changed (creating, updating, or deleting the rule or trigger)
- Security issues detected by all methods, all or only for the selected risk levels:
- Critical risk
- High risk
- Medium risk
- Low risk
- Info risk
- On an hourly basis, you can get a notification with the number of requests processed during the previous hour
-
-
Yapılandırmanın doğruluğunu, Wallarm Cloud erişilebilirliğini ve bildirim formatını kontrol etmek için Test integration'a tıklayın.
JSON formatında Splunk test bildirimi:
{ summary:"[Test message] [Test partner(US)] New vulnerability detected", description:"Notification type: vuln New vulnerability was detected in your system. ID: Title: Test Domain: example.com Path: Method: Discovered by: Parameter: Type: Info Threat: Medium More details: https://us1.my.wallarm.com/object/555 Client: TestCompany Cloud: US ", details:{ client_name:"TestCompany", cloud:"US", notification_type:"vuln", vuln_link:"https://us1.my.wallarm.com/object/555", vuln:{ domain:"example.com", id:null, method:null, parameter:null, path:null, title:"Test", discovered_by:null, threat:"Medium", type:"Info" } } } -
Add integration'a tıklayın.
Wallarm Cloud IP addresses
To provide Wallarm Cloud access to your system, you may need a list of its public IP addresses:
Ek uyarıların yapılandırılması
Besides the notifications you have already set up through the integration card, Wallarm triggers allow you to select additional events for notifications:
-
Number of attacks, hits or incidents per time interval (day, hour, etc.) exceeds the set number
What is not counted
- For attacks:
- The experimental attacks based on the custom regular expressions.
- For hits:
- The experimental hits based on the custom regular expressions.
- Hits not saved in the sample.
- For attacks:
-
Changes in API took place
-
IP address was denylisted
-
New rogue API (shadow, zombie) was detected
-
New user was added to the company account
For condition detailing, you can add one or more filters. As soon, as condition and filters are set, select the integration through which the selected alert should be sent. You can select several integrations simultaneously.

Olayların bir gösterge panosunda düzenlenmesi
To get Wallarm events organized into a ready-to-use dashboard in Splunk 9.0 or later, you can install the Wallarm application for Splunk.
This application provides you with a pre-configured dashboard that is automatically filled with the events received from Wallarm. In addition to that, the application enables you to proceed to detailed logs on each event and export the data from the dashboard.

To install the Wallarm application for Splunk:
-
In the Splunk UI ➝ Apps find the
Wallarm API Securityapplication. -
Click Install and input the Splunkbase credentials.
If some Wallarm events are already logged in Splunk, they will be displayed on the dashboard, as well as further events Wallarm will discover.
In addition, you can fully customize the ready-to-use dashboard, e.g. its view or search strings used to extract data from all Splunk records.
Bir entegrasyonu devre dışı bırakma ve silme
You can delete or temporarily disable the integration. While deleting stops sending notificatioins and completely deletes all configuration, disabling just stops sending notifications which you can at any moment re-enable with the same settings.
If for the integration the System related events are selected to trigger notifications, Wallarm will notify about both of these actions.
Sistem kullanılamaması ve hatalı entegrasyon parametreleri
Notifications to the system are sent via requests. If the system is unavailable or integration parameters are configured incorrectly, the error code is returned in the response to the request.
If the system responds to Wallarm request with any code other than 2xx, Wallarm resends the request with the interval until the 2xx code is received:
-
The first cycle intervals: 1, 3, 5, 10, 10 seconds
-
The second cycle intervals: 0, 1, 3, 5, 30 seconds
-
The third cycle intervals: 1, 1, 3, 5, 10, 30 minutes
If the percentage of unsuccessful requests reaches 60% in 12 hours, the integration is automatically disabled. If you receive system notifications, you will get a message about automatically disabled integration.