# Comparing Wallarm to Other Solutions
When comparing Wallarm to other security or WAF solutions, it's essential to gather and present meaningful data. This article describes how to showcase Wallarm's performance effectively and use Wallarm's reporting features for teams and executives.
## Step 1: Compare WAF Capabilities with GoTestWAF
To get an objective, like-for-like comparison of Wallarm and another WAF (same tests, same conditions):
1. **Run the same tests in both environments**
Use [GoTestWAF](https://github.com/wallarm/gotestwaf) against a domain protected by Wallarm, then run the same test set against a domain protected by the other WAF. Using the same tool and test set in both runs makes the results comparable.
2. **Compare outcomes**
For each run, review what was blocked or detected. Differences in coverage (e.g., which attack types each WAF blocked or missed) give you a concrete basis for comparing capabilities.
3. **Use the results in reporting**
Summarize these findings for executives as a practical, evidence-based comparison of WAF capabilities.
## Step 2: Utilize Wallarm Reporting Features
Wallarm offers several dashboards and data export options to create detailed reports.
**For all sections below:**
* Where possible, filter data by dates to match the period when you ran the GoTestWAF test attacks, so the report reflects the same timeframe.
* To save a view as PDF, use provided save to PDF capabilities or your browser's **Print to PDF** option.
### Threat Prevention dashboard
**How to navigate:** In Wallarm Console, go to **Dashboards** → **Threat Prevention Dashboard**.
**What to include in reports:**
* Speed of request encountering
* Normal and malicious traffic
* Summary for a period
* Attack sources
* Attack targets
* Attack types
* CVEs
* Attacks on API protocols
* Authentication in attacks
See [Threat Prevention dashboard](https://docs.wallarm.com/user-guides/dashboards/threat-prevention.md) for details.
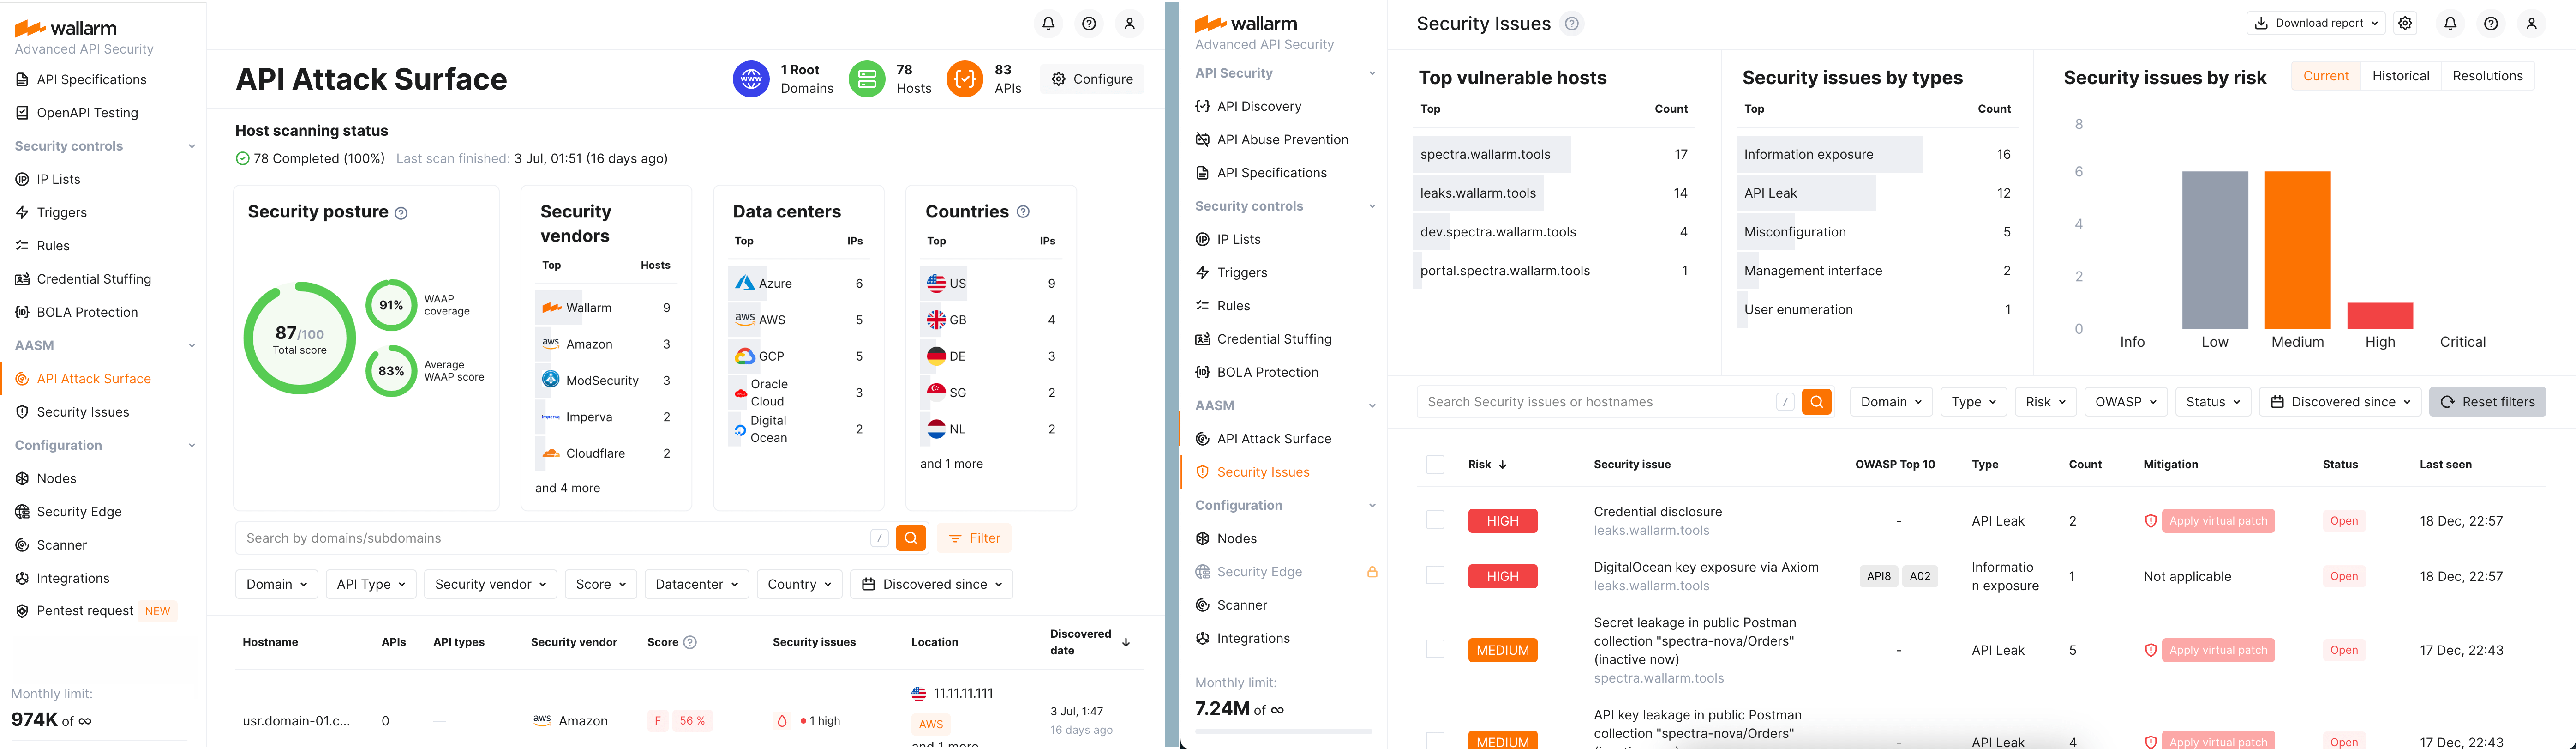
### API Discovery dashboard
**How to navigate:** In Wallarm Console, go to **Dashboards** → **API Discovery Dashboard**.
**What to include in reports:**
* Number of root domains, hosts, and APIs detected
* Top vendors, data centers, and countries hosting traffic
See [API Discovery Dashboard](https://docs.wallarm.com/api-discovery/dashboard.md) for details.
### OWASP API Top 10 dashboard
**How to navigate:** In Wallarm Console, go to **Dashboards** → **OWASP API Top 10 Dashboard**.
Use this dashboard to generate a report showcasing Wallarm's coverage and detections aligned with the [OWASP API Security Top 10](https://docs.wallarm.com/user-guides/dashboards/owasp-api-top-ten.md).
### Security issues and credential stuffing
**How to navigate:** In Wallarm Console, go to **Security Issues** for vulnerability counts; use the search (e.g. in **Attacks**) for credential stuffing.
You can pull the following into your reports:
* **Security issues (vulnerabilities) by risk level** — start/new/closed/end. Get these counts from the [**Security Issues**](https://docs.wallarm.com/user-guides/vulnerabilities.md) section.
* **Number of [credential stuffing](https://docs.wallarm.com/about-wallarm/credential-stuffing.md) detections with 200 responses** — In Wallarm Console search, use:
```
attacks statuscode:200 DD/MM/YYYY 0:00 - DD/MM/YYYY 23:59 credential_stuffing
```
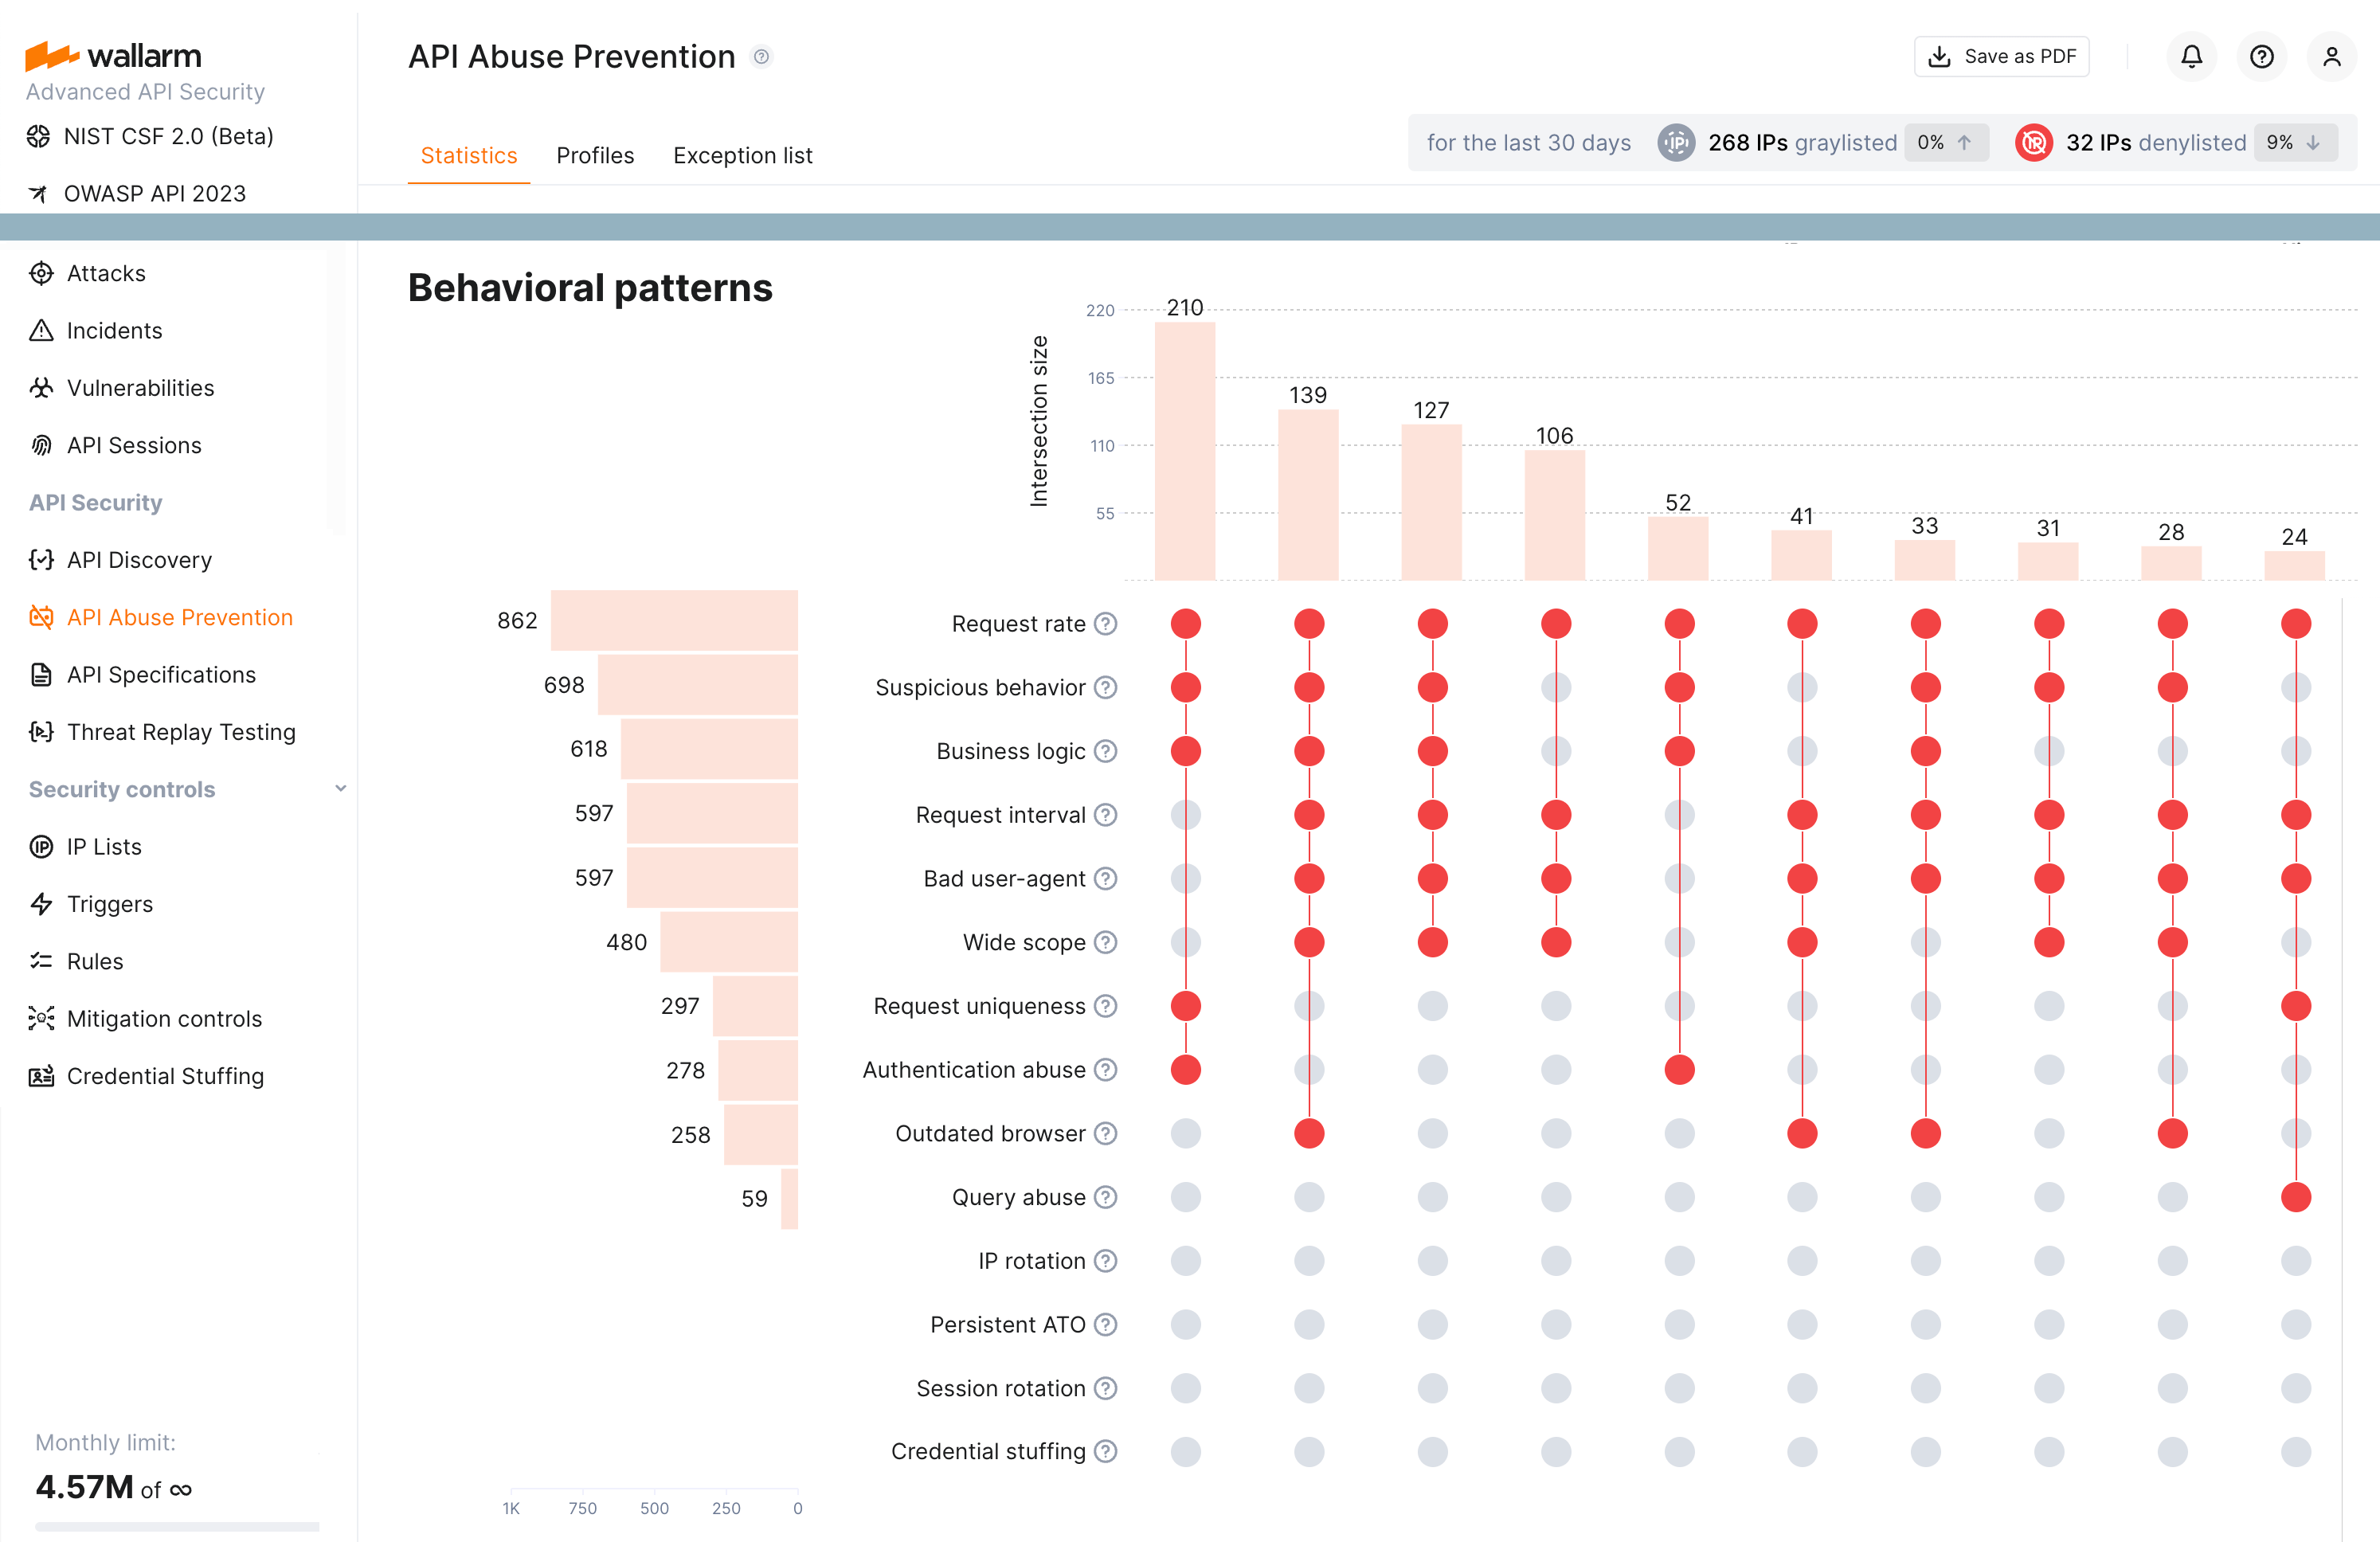
### API Abuse Prevention
**How to navigate:** In Wallarm Console, go to **API Abuse Prevention**.
Use this section to document incidents, trends, and areas of [API abuse prevention](https://docs.wallarm.com/api-abuse-prevention/overview.md) in your report.
### AASM (Advanced API Security Metrics)
**How to navigate:** In Wallarm Console, go to **API Attack Surface**.
**What to include in reports:**
* Score totals for API security posture
* Trends and analysis on detected vulnerabilities and protections