Business Intelligence Dashboards  
In Wallarm, you have the ability to build and customize your own dashboards. This allows you to collect, present, and share security data in a way that is most relevant to your business, helping you make more informed decisions about security measures. This article describes how to create, use, and share such dashboards.
Requirements
BI dashboards require:
-
The Advanced API Security subscription plan
-
Properly configured API Sessions (data source for all dashboards)
Use cases
BI dashboards help you solve concrete tasks, for example:
-
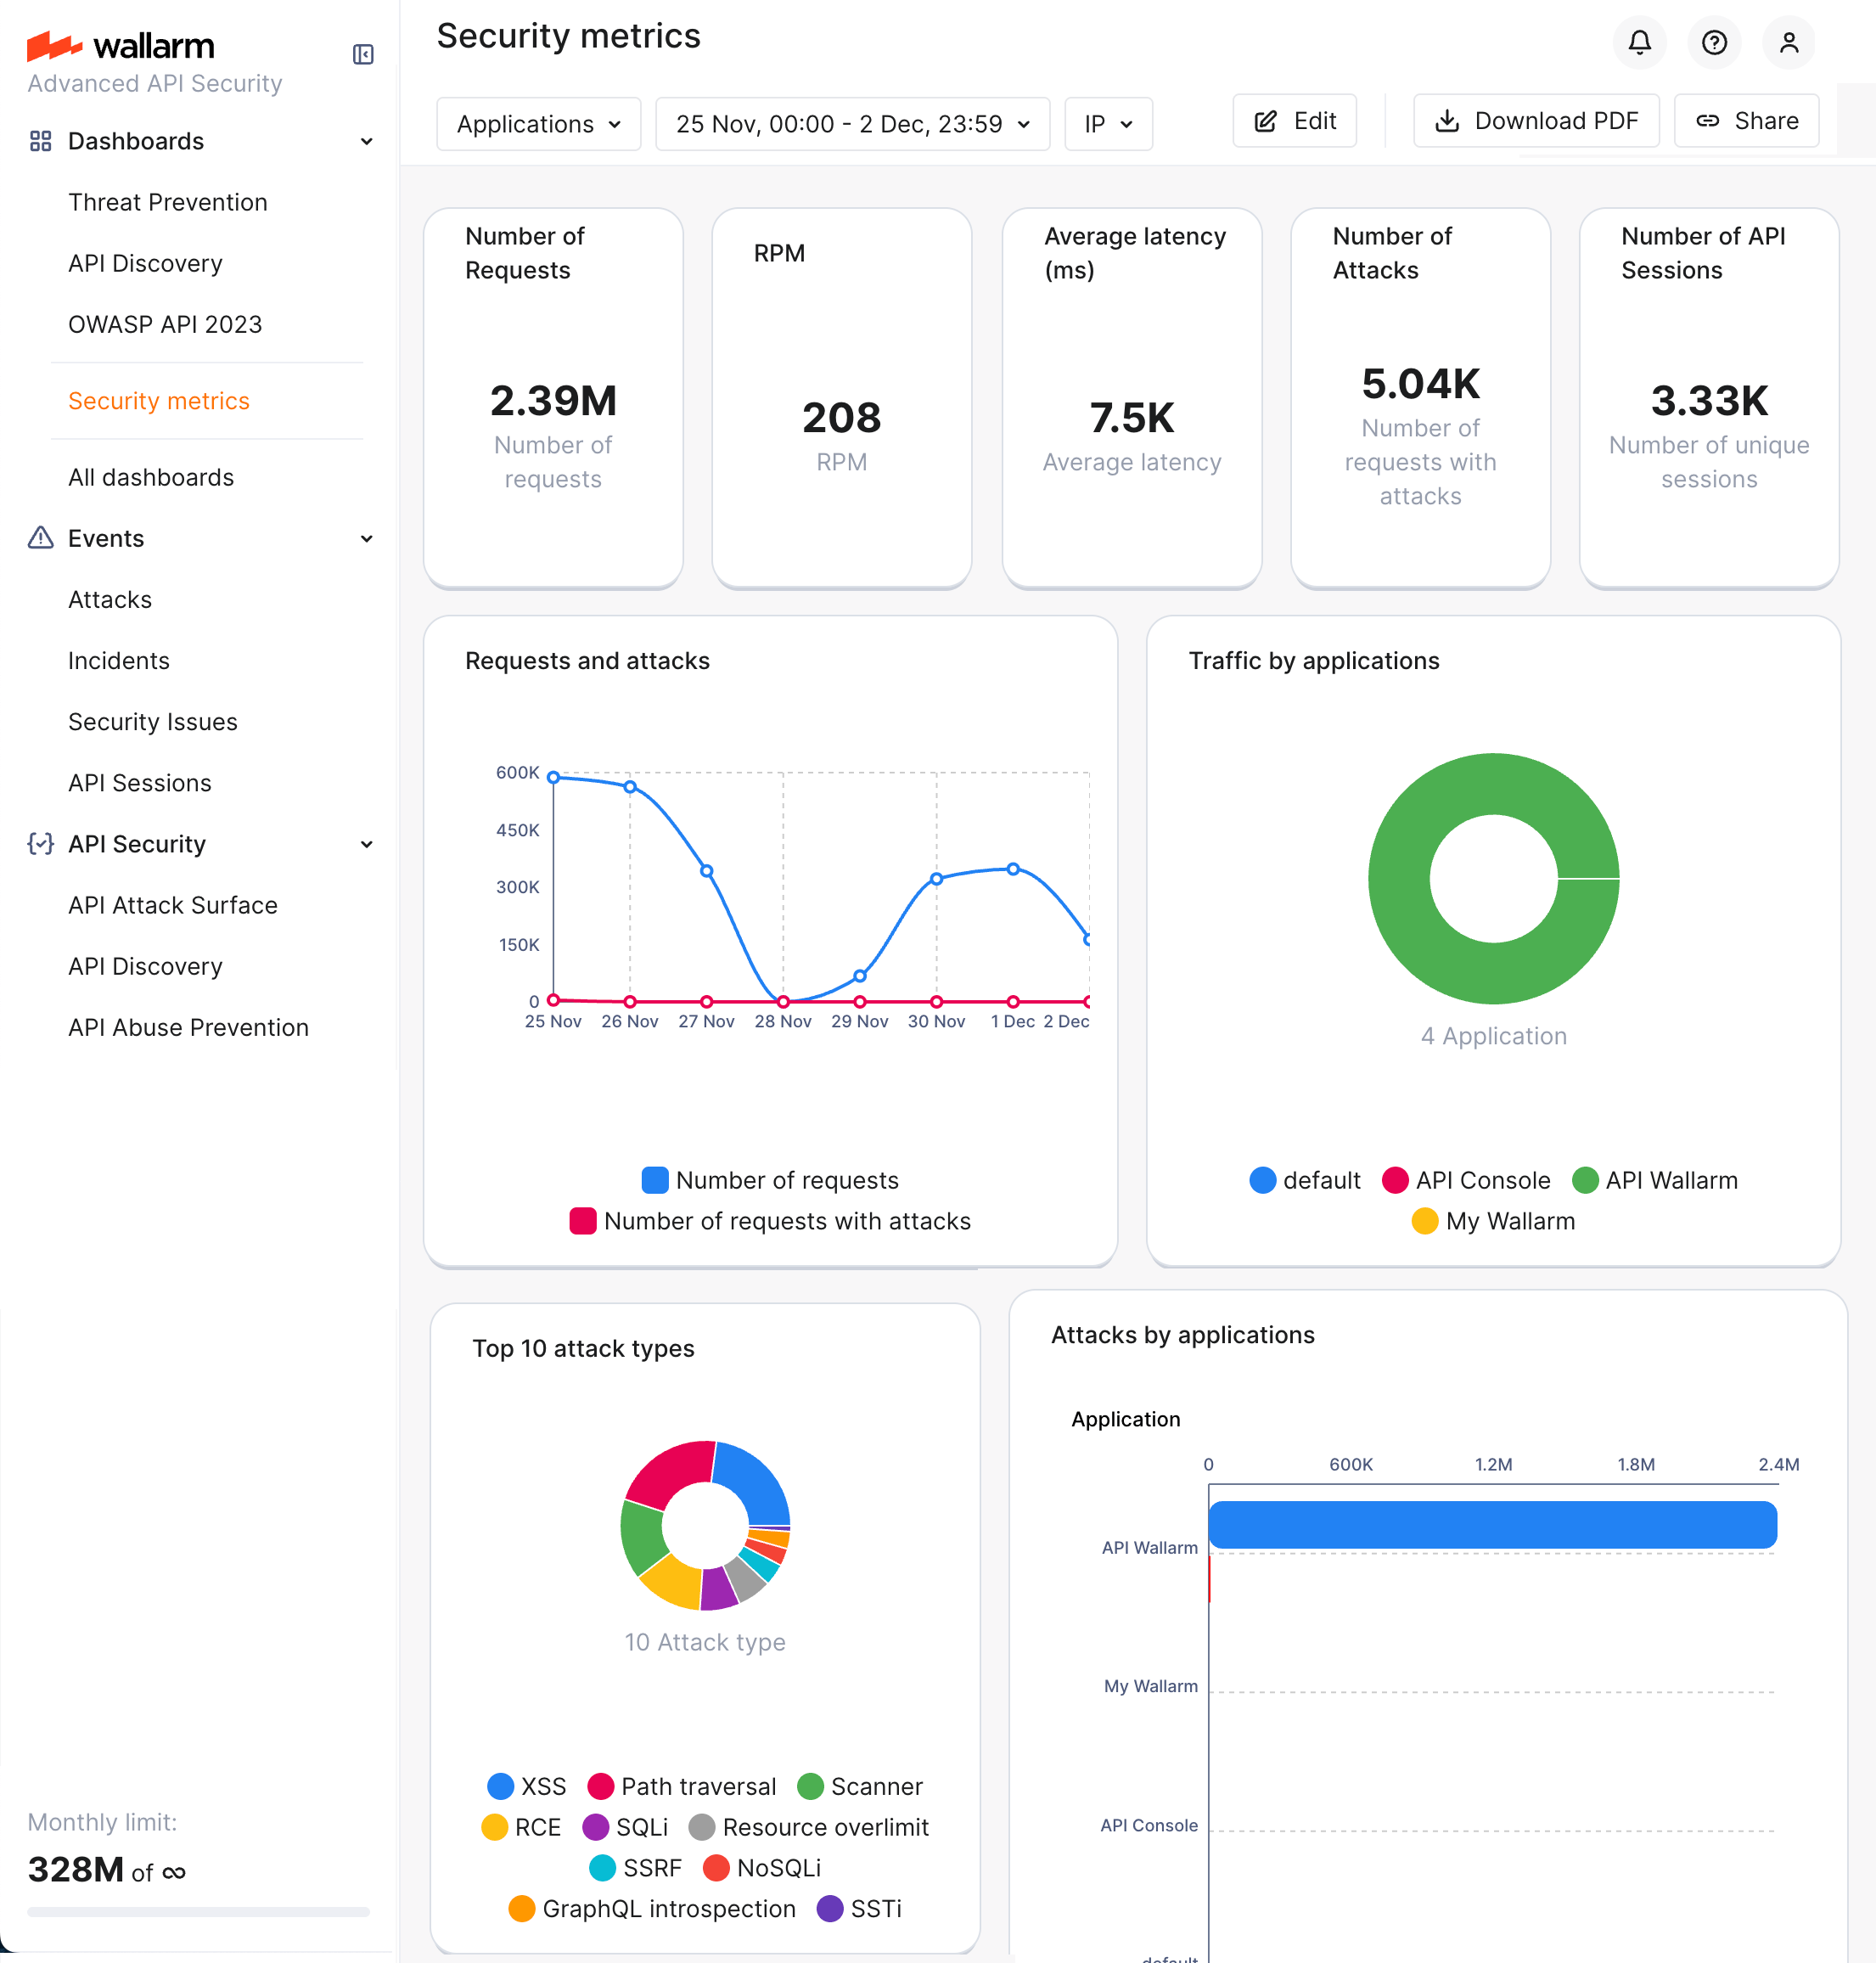
Present security data to stakeholders — Build a dashboard with the metrics that matter for your business (e.g. request volume, blocked traffic, trends) and share a live link or PDF snapshot with leadership or partners.
-
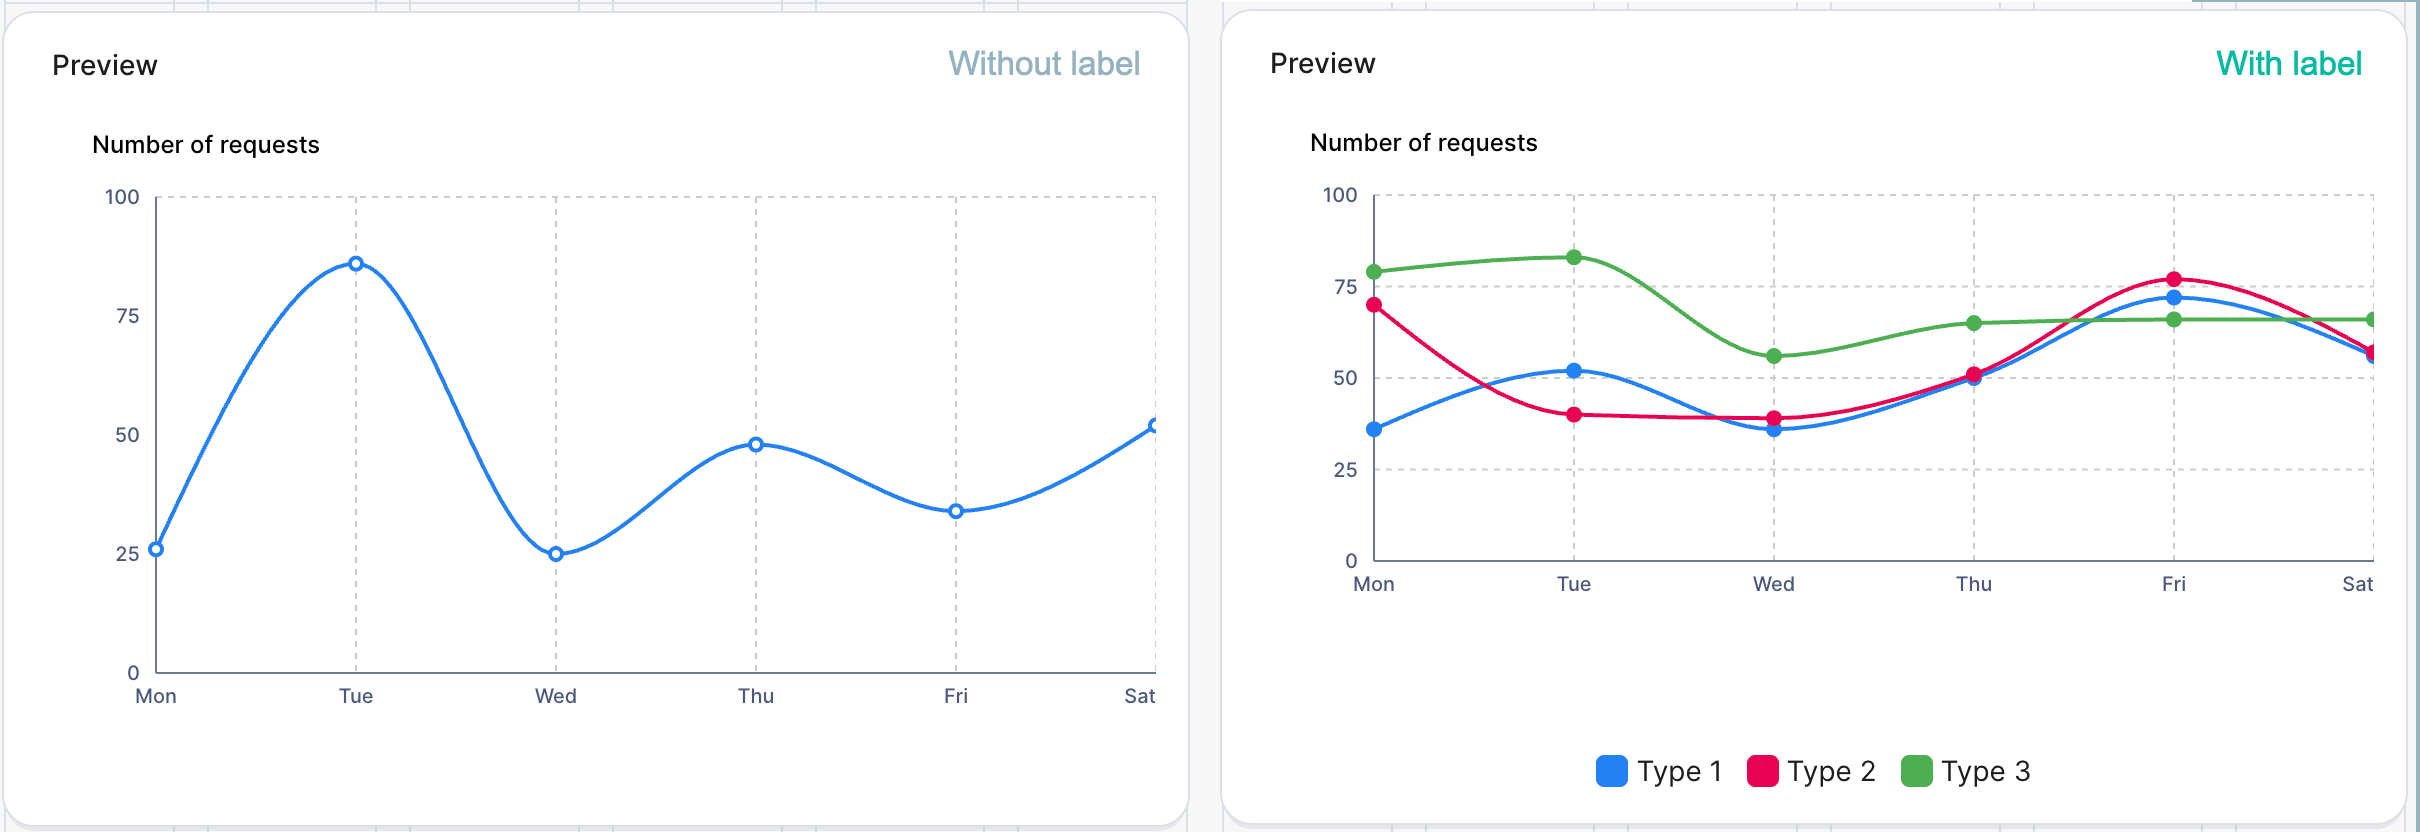
Track security trends over time — Use line or area charts to see how metrics change week-over-week or month-over-month, and spot anomalies or the impact of changes.
-
Drill down by application or other dimensions — Use labels and filters to see per-application or per-environment data, so different teams can focus on their scope.
To see a ready-made example, explore the Financial metrics dashboard in Wallarm Playground (read-only).
Adding dashboards
You can:
-
Create any number of dashboards.
-
Populate your dashboards with multiple charts of different types.
-
Resize and change chart positions by drag-and-drop.
-
Add a dashboard to favorites; this will display it in Wallarm's dashboard menu on the left.
To add a BI dashboard:
-
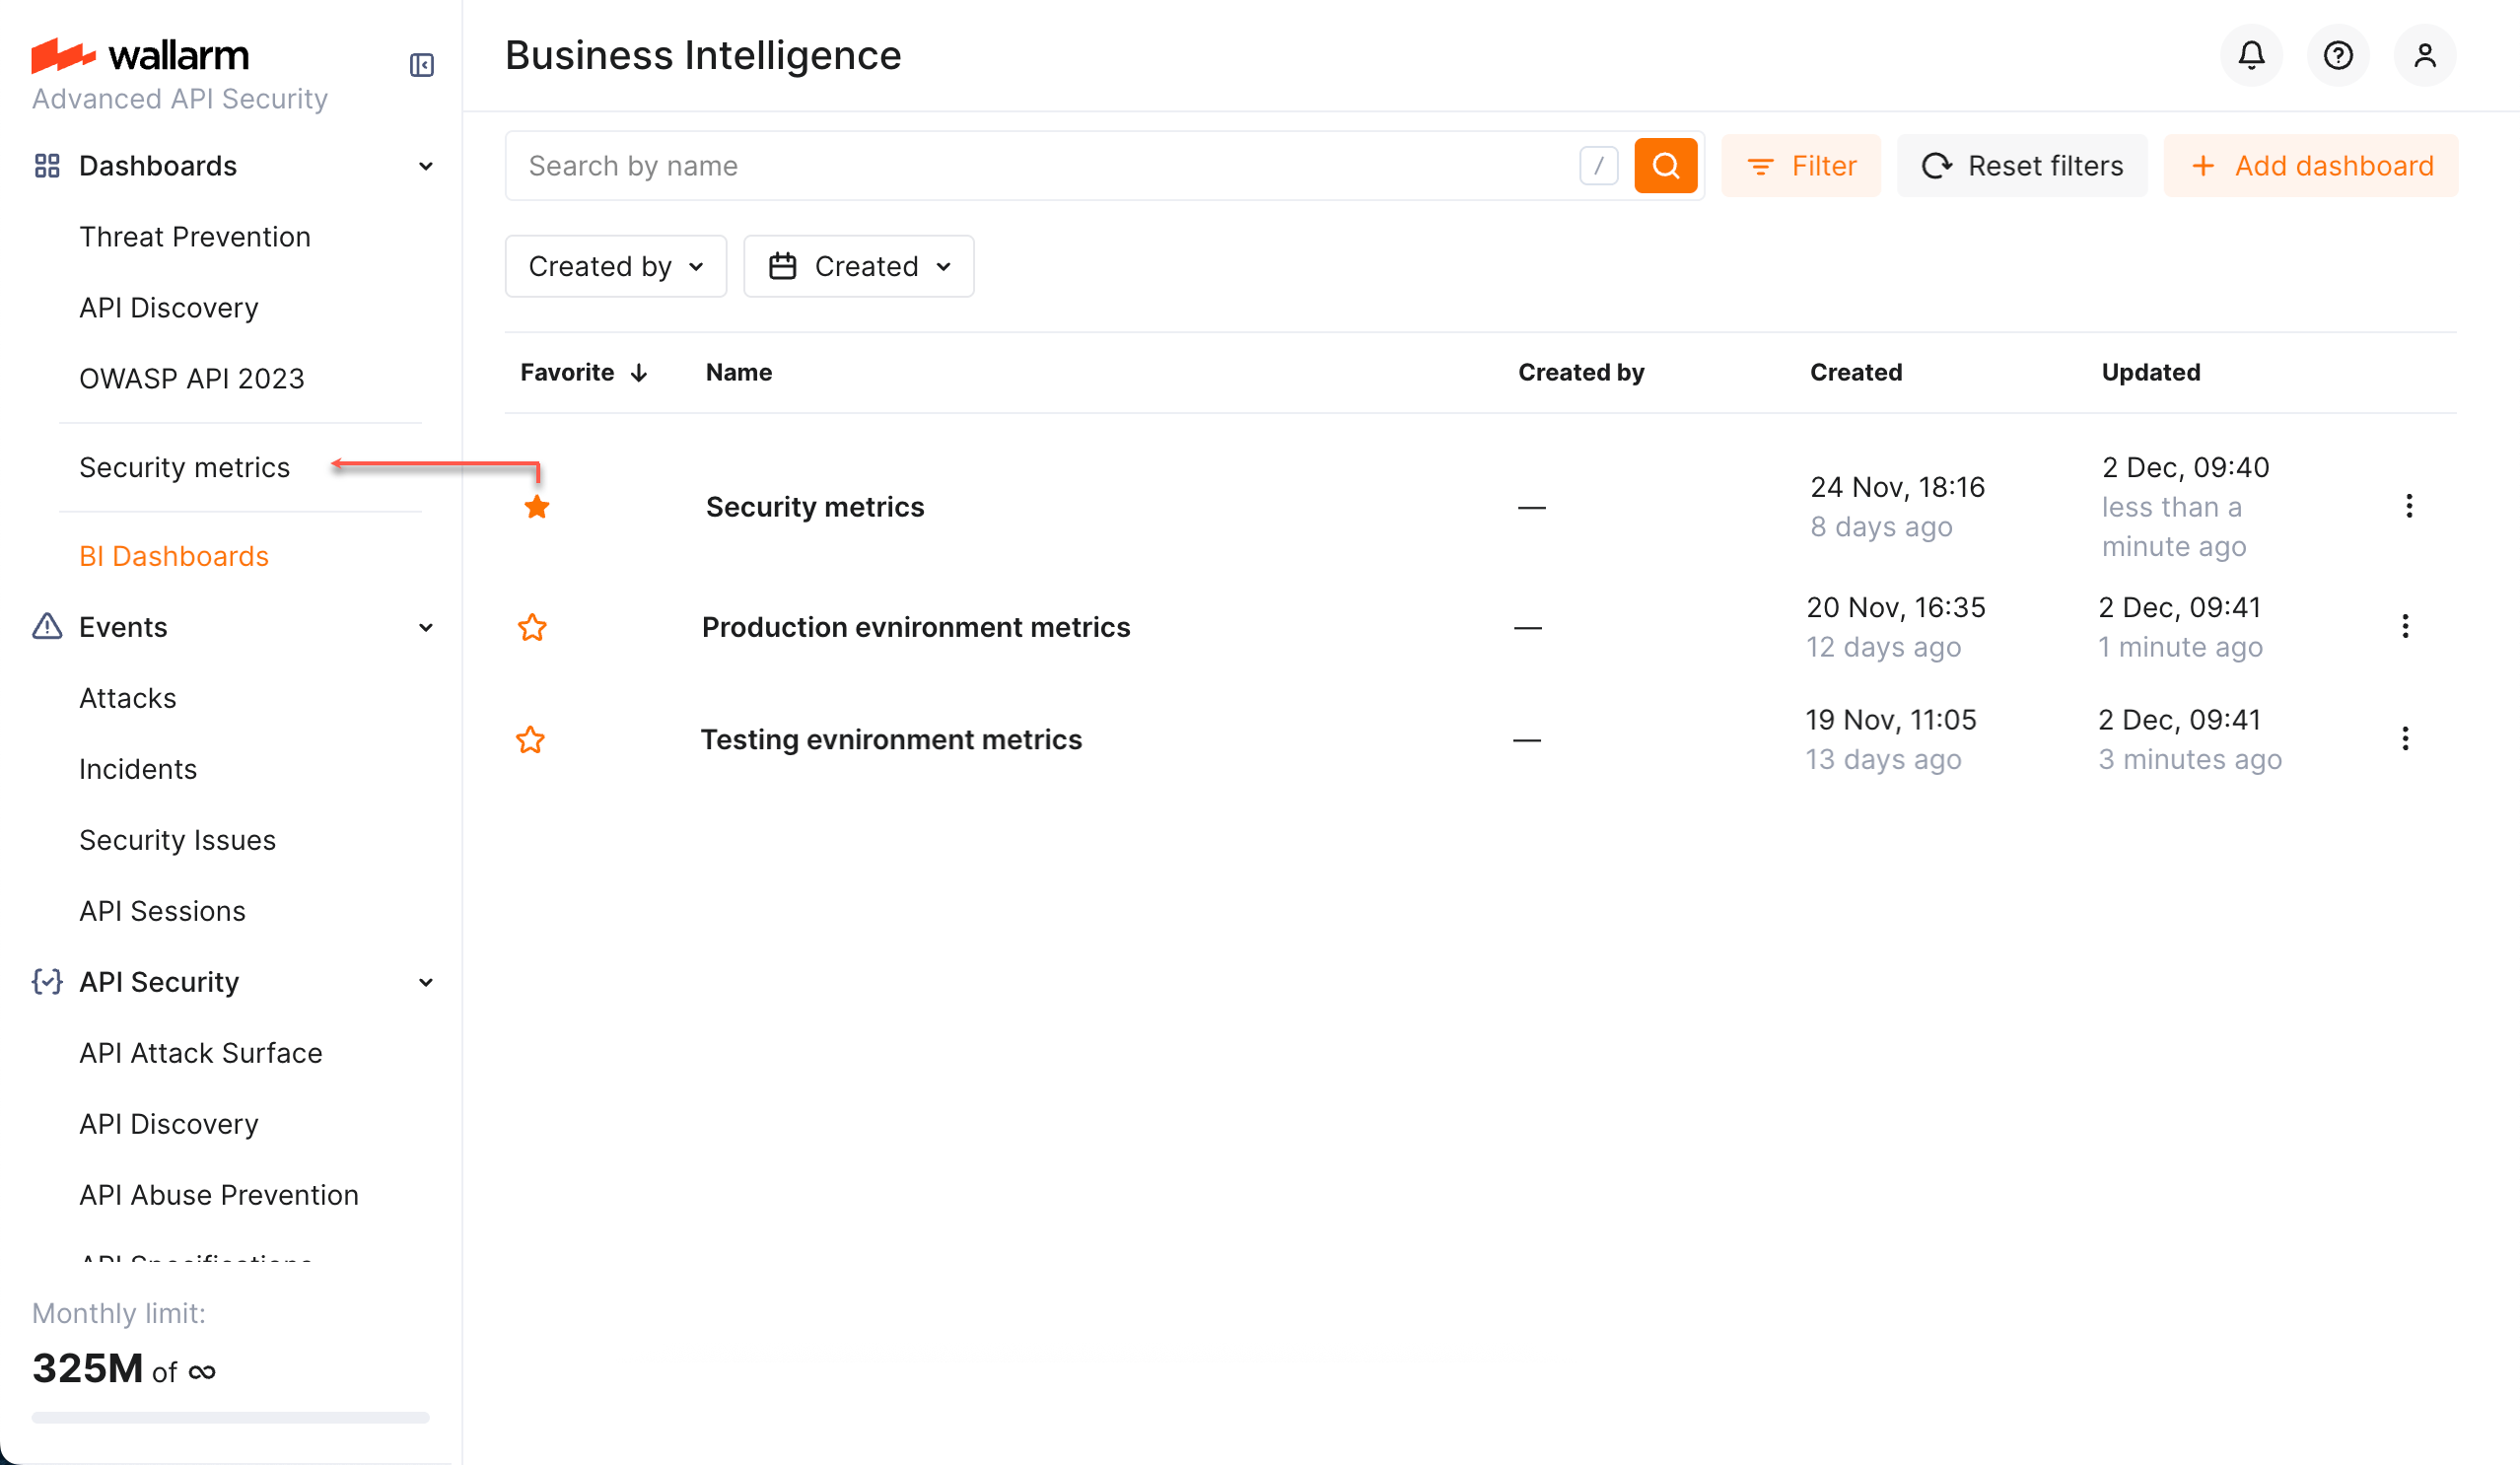
Go to Wallarm Console → BI Dashboards.
-
Click Add dashboard. The Dashboard Builder is displayed.
-
Set the dashboard name.
-
Add and position charts.
-
Save changes. The new dashboard is added to the list. Click to view.
Setting up charts
Depending on the chart type, settings may vary. Available types:
-
Bar chart
-
Line chart
-
Area chart
-
Donut chart
-
Single metric
Generally, to set up a chart, you need to select a metric and how it will be presented on the chart. Note that:
-
Charts use API Sessions as the default data source (so far, only one available).
-
Chart title is required.
-
You can use labels to split data of a single metric "by label". For example, add the "Number of requests" metric, then add the "Application" label to see the number of requests for each application.
-
You can use filters. Filters are chart-wide, so if you have several metrics in the chart, they will all be affected by the selected filters. Consider the interaction between chart and dashboard filters.
Using and sharing
You can:
-
If added to favorites—click the dashboard name in Wallarm's left menu.
-
Access the dashboard by clicking its name in Wallarm Console → BI Dashboards.
-
Redefine dashboard filters:
- Default period is the last week
- All applications' data is displayed by default
- Traffic from all IPs is considered by default; change this by including or excluding IPs or CIDR notations
- Consider dashboard filters interacting with chart filters.
-
To share the dashboard's live state, click Share on its page and send the copied link.
-
To share the dashboard's snapshot, apply filters, then click Download PDF.
Limitations
BI dashboards use API Sessions data and may differ by up to 5% from the Threat Prevention dashboard or billing counts in edge cases, such as:
-
Sampling during traffic spikes
-
Limited processing-node resources causing missed exports