Portal Inline Overview with Logs
This article describes one of the two dashboards in the Security Edge Inline telemetry portal, called Portal Inline Overview with Logs.
The dashboard contains the following rows:
Overview row
The Overview row provides a summary of the health, performance, and security activity of the Wallarm Security Edge cluster. It includes key metrics about nodes, NGINX, upstream services, and Wallarm request statistics.
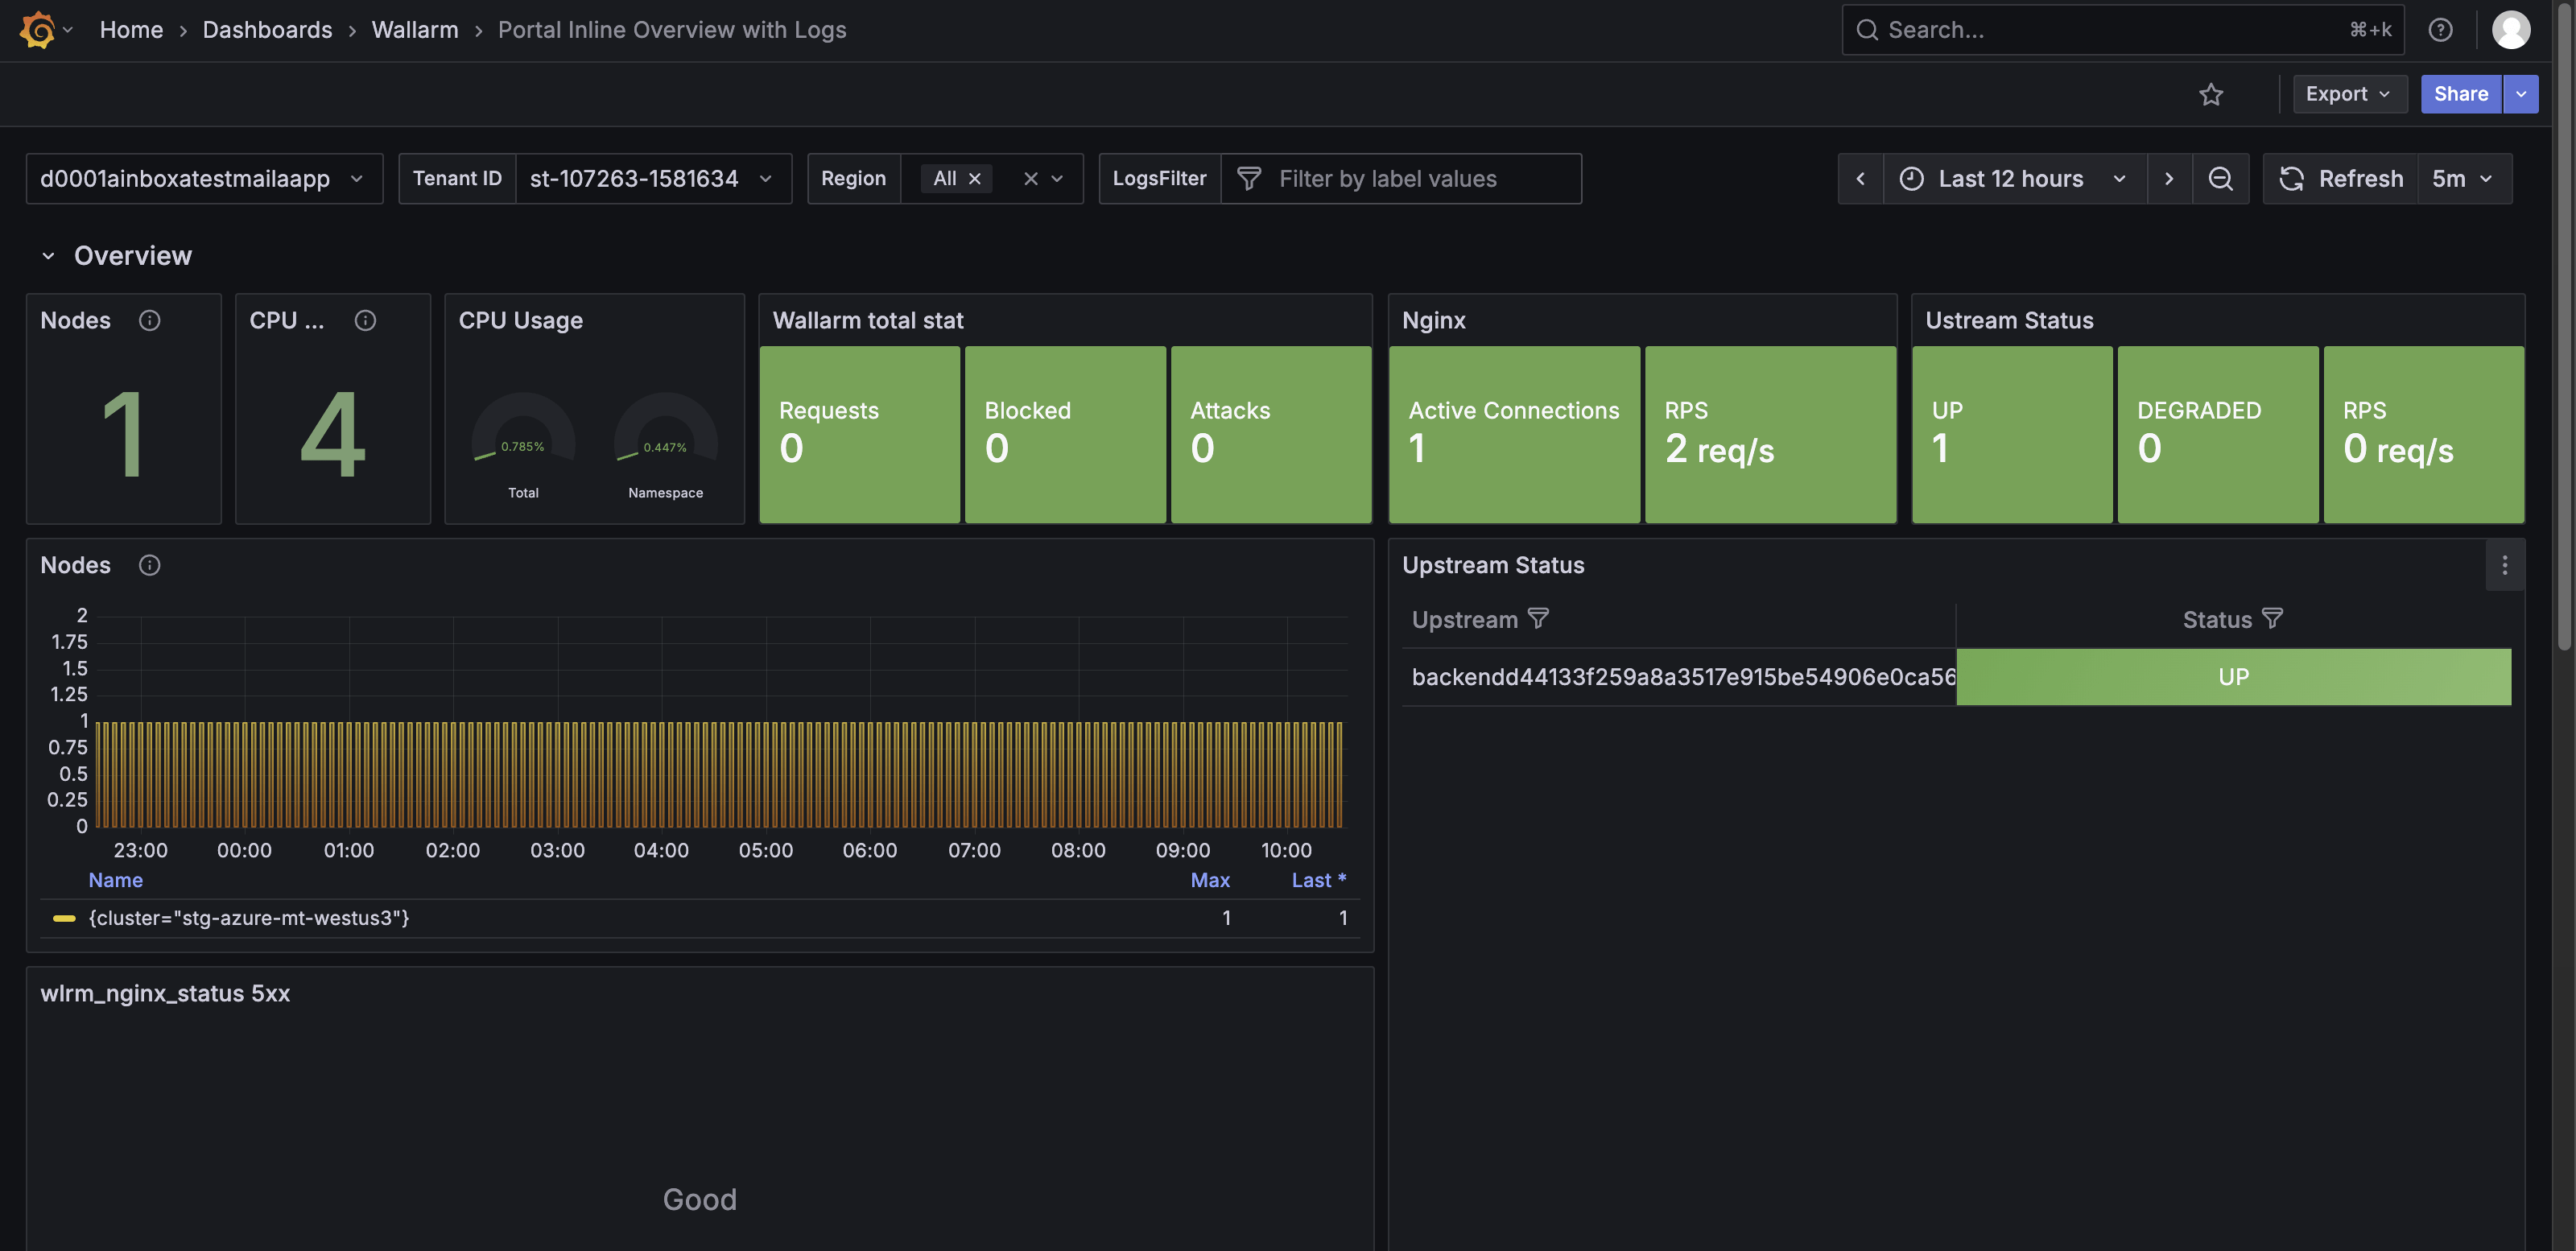
The Overview row features the following panels:
-
Nodes (count of nodes) – Shows the total number of active nodes in the cluster, providing insight into cluster scale.
-
CPU cores – Shows the total number of CPU cores across all nodes, indicating available processing capacity.
-
CPU usage - Shows two gauge-style indicators that display current CPU consumption.
-
Wallarm total stat – Shows totals for incoming requests, blocked requests, and detected attacks.
-
Nginx – Shows requests per second (RPS) handled by NGINX.
-
Upstream status – Shows the health of upstream services (for example, up or degraded) and their RPS.
-
Nodes – Shows node-specific metrics over time for the selected cluster.
-
5xx per minute – Shows the number of NGINX 5xx responses, which may indicate upstream or configuration issues.
-
Wallarm (requests, attacks, blocked, rejected, buffered) – Shows traffic filtered by Wallarm over time, with a summary table for each category.
RPS Detailed Row
The RPS Detailed row shows detailed request traffic per URI, categorized by response codes. It helps identify the most frequently accessed endpoints and spot unusual request patterns.
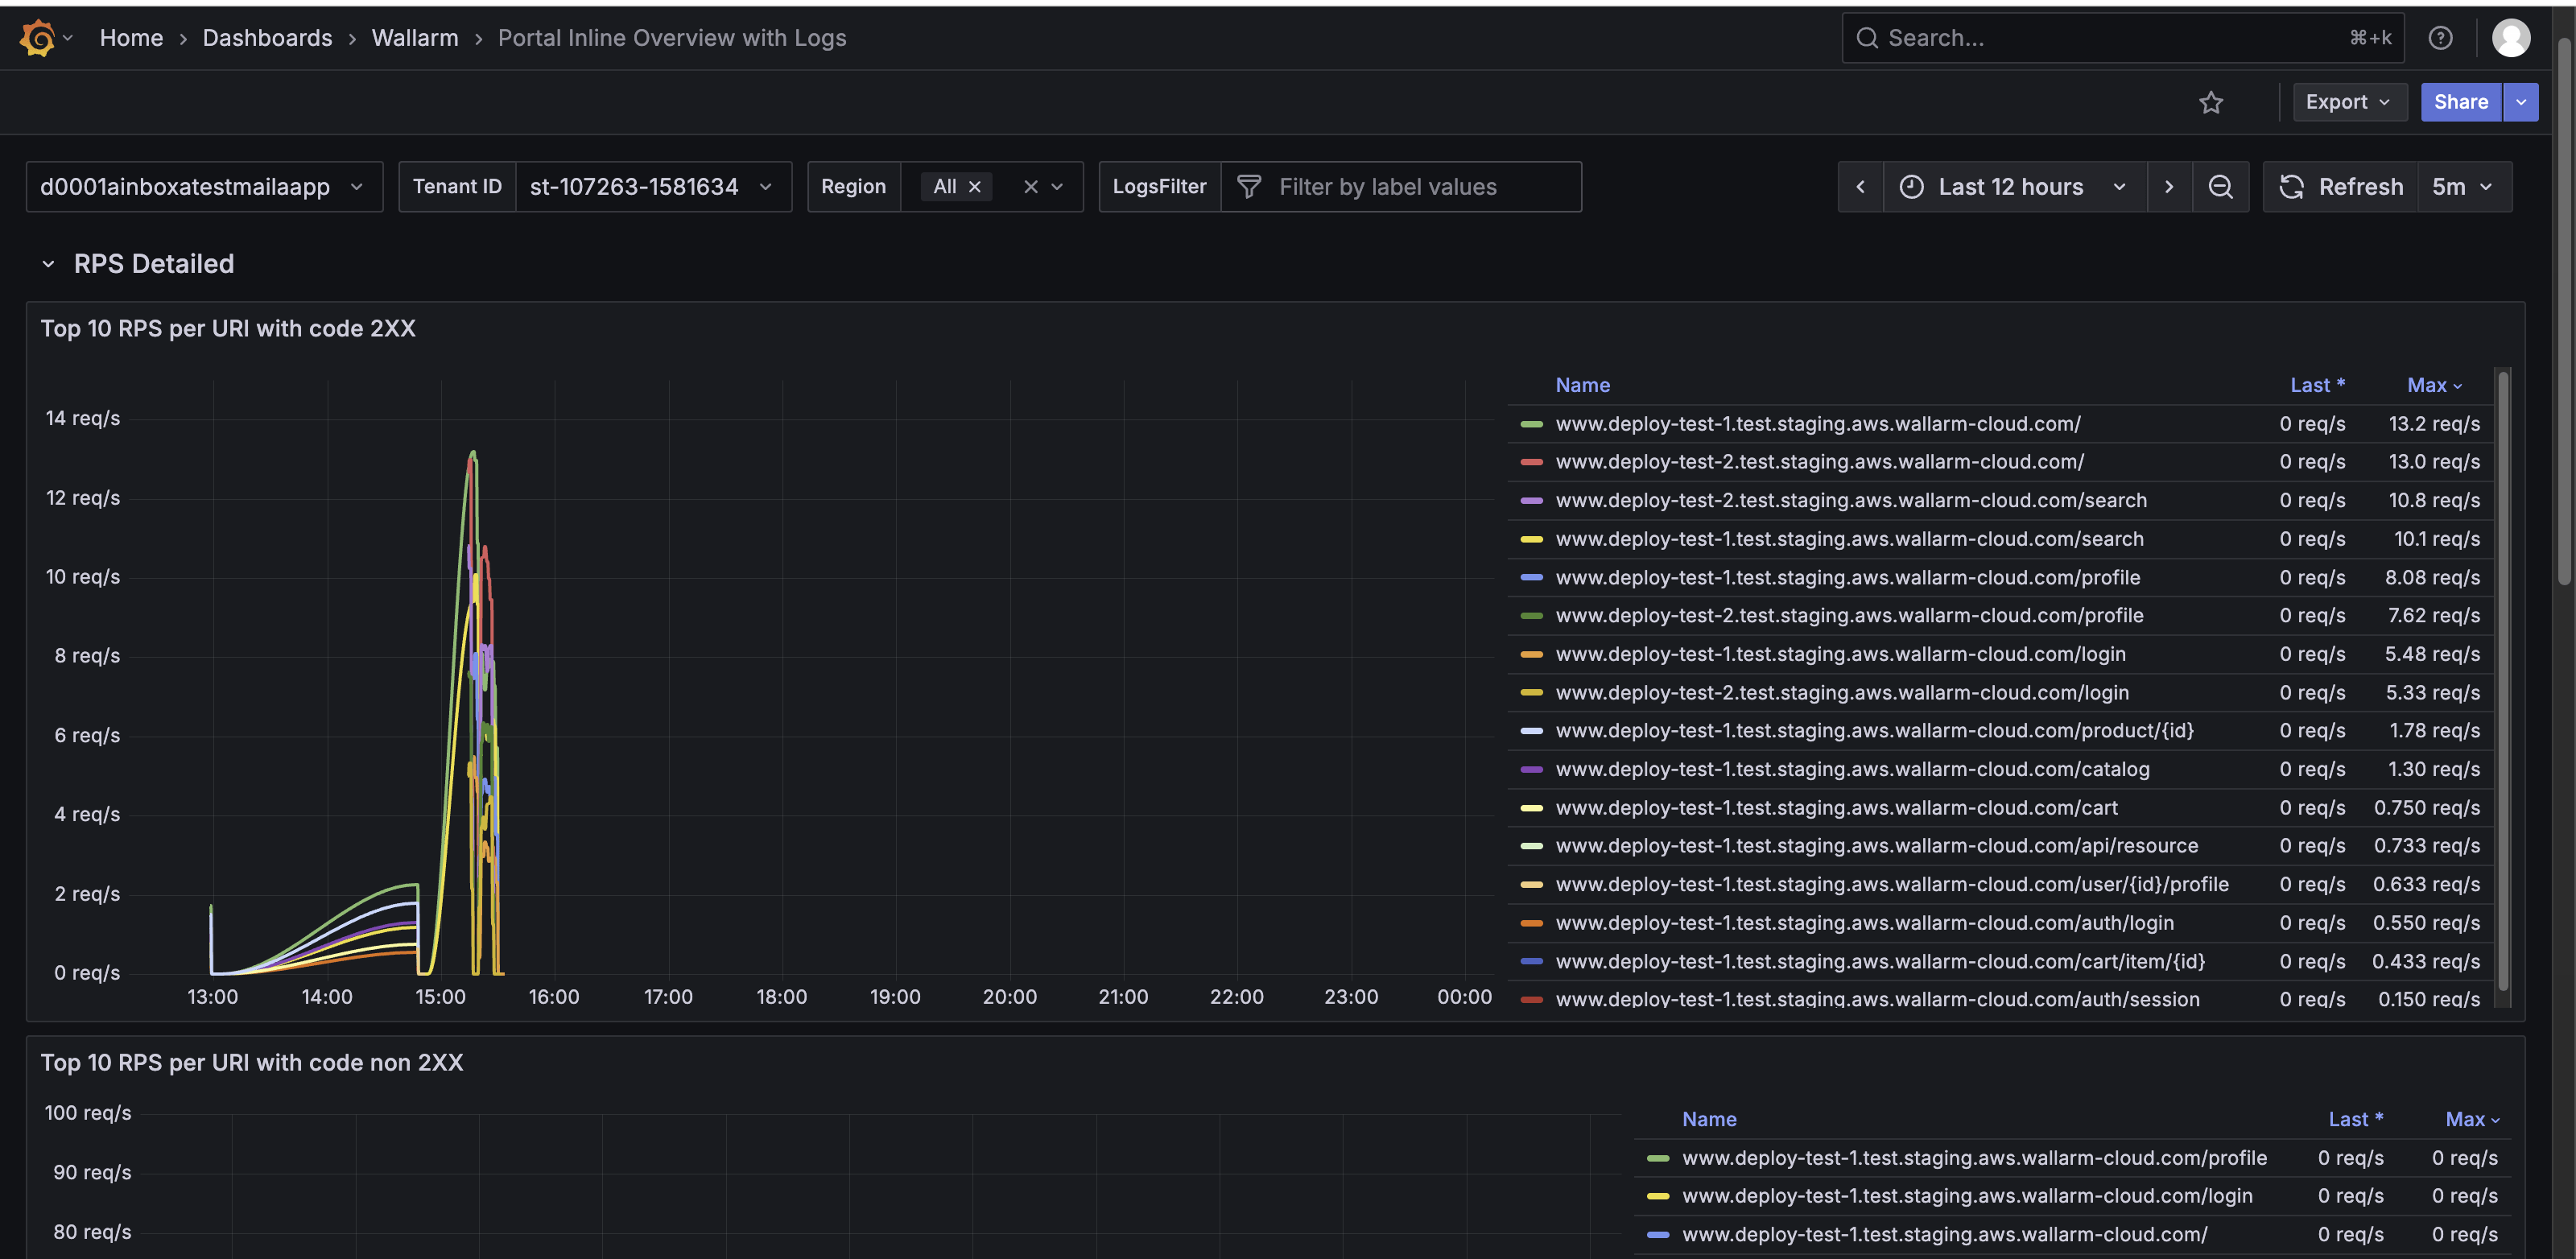
The RPS Detailed row features the following panels:
-
Top 10 RPS per URI with code 2XX – Shows URIs with the highest number of successful requests (HTTP 2XX).
-
Top 10 RPS per URI with code non-2XX – Shows URIs generating client or server errors (any HTTP code other than 2XX).
-
wlrm_nginx_status 200|400-405|500-505 – Shows RPS per URI grouped by status code ranges (200 successful, 400–405 client errors, 500–505 server errors).
Response Time row
The Response Time row shows request and upstream latency, helping monitor performance and detect potential bottlenecks.
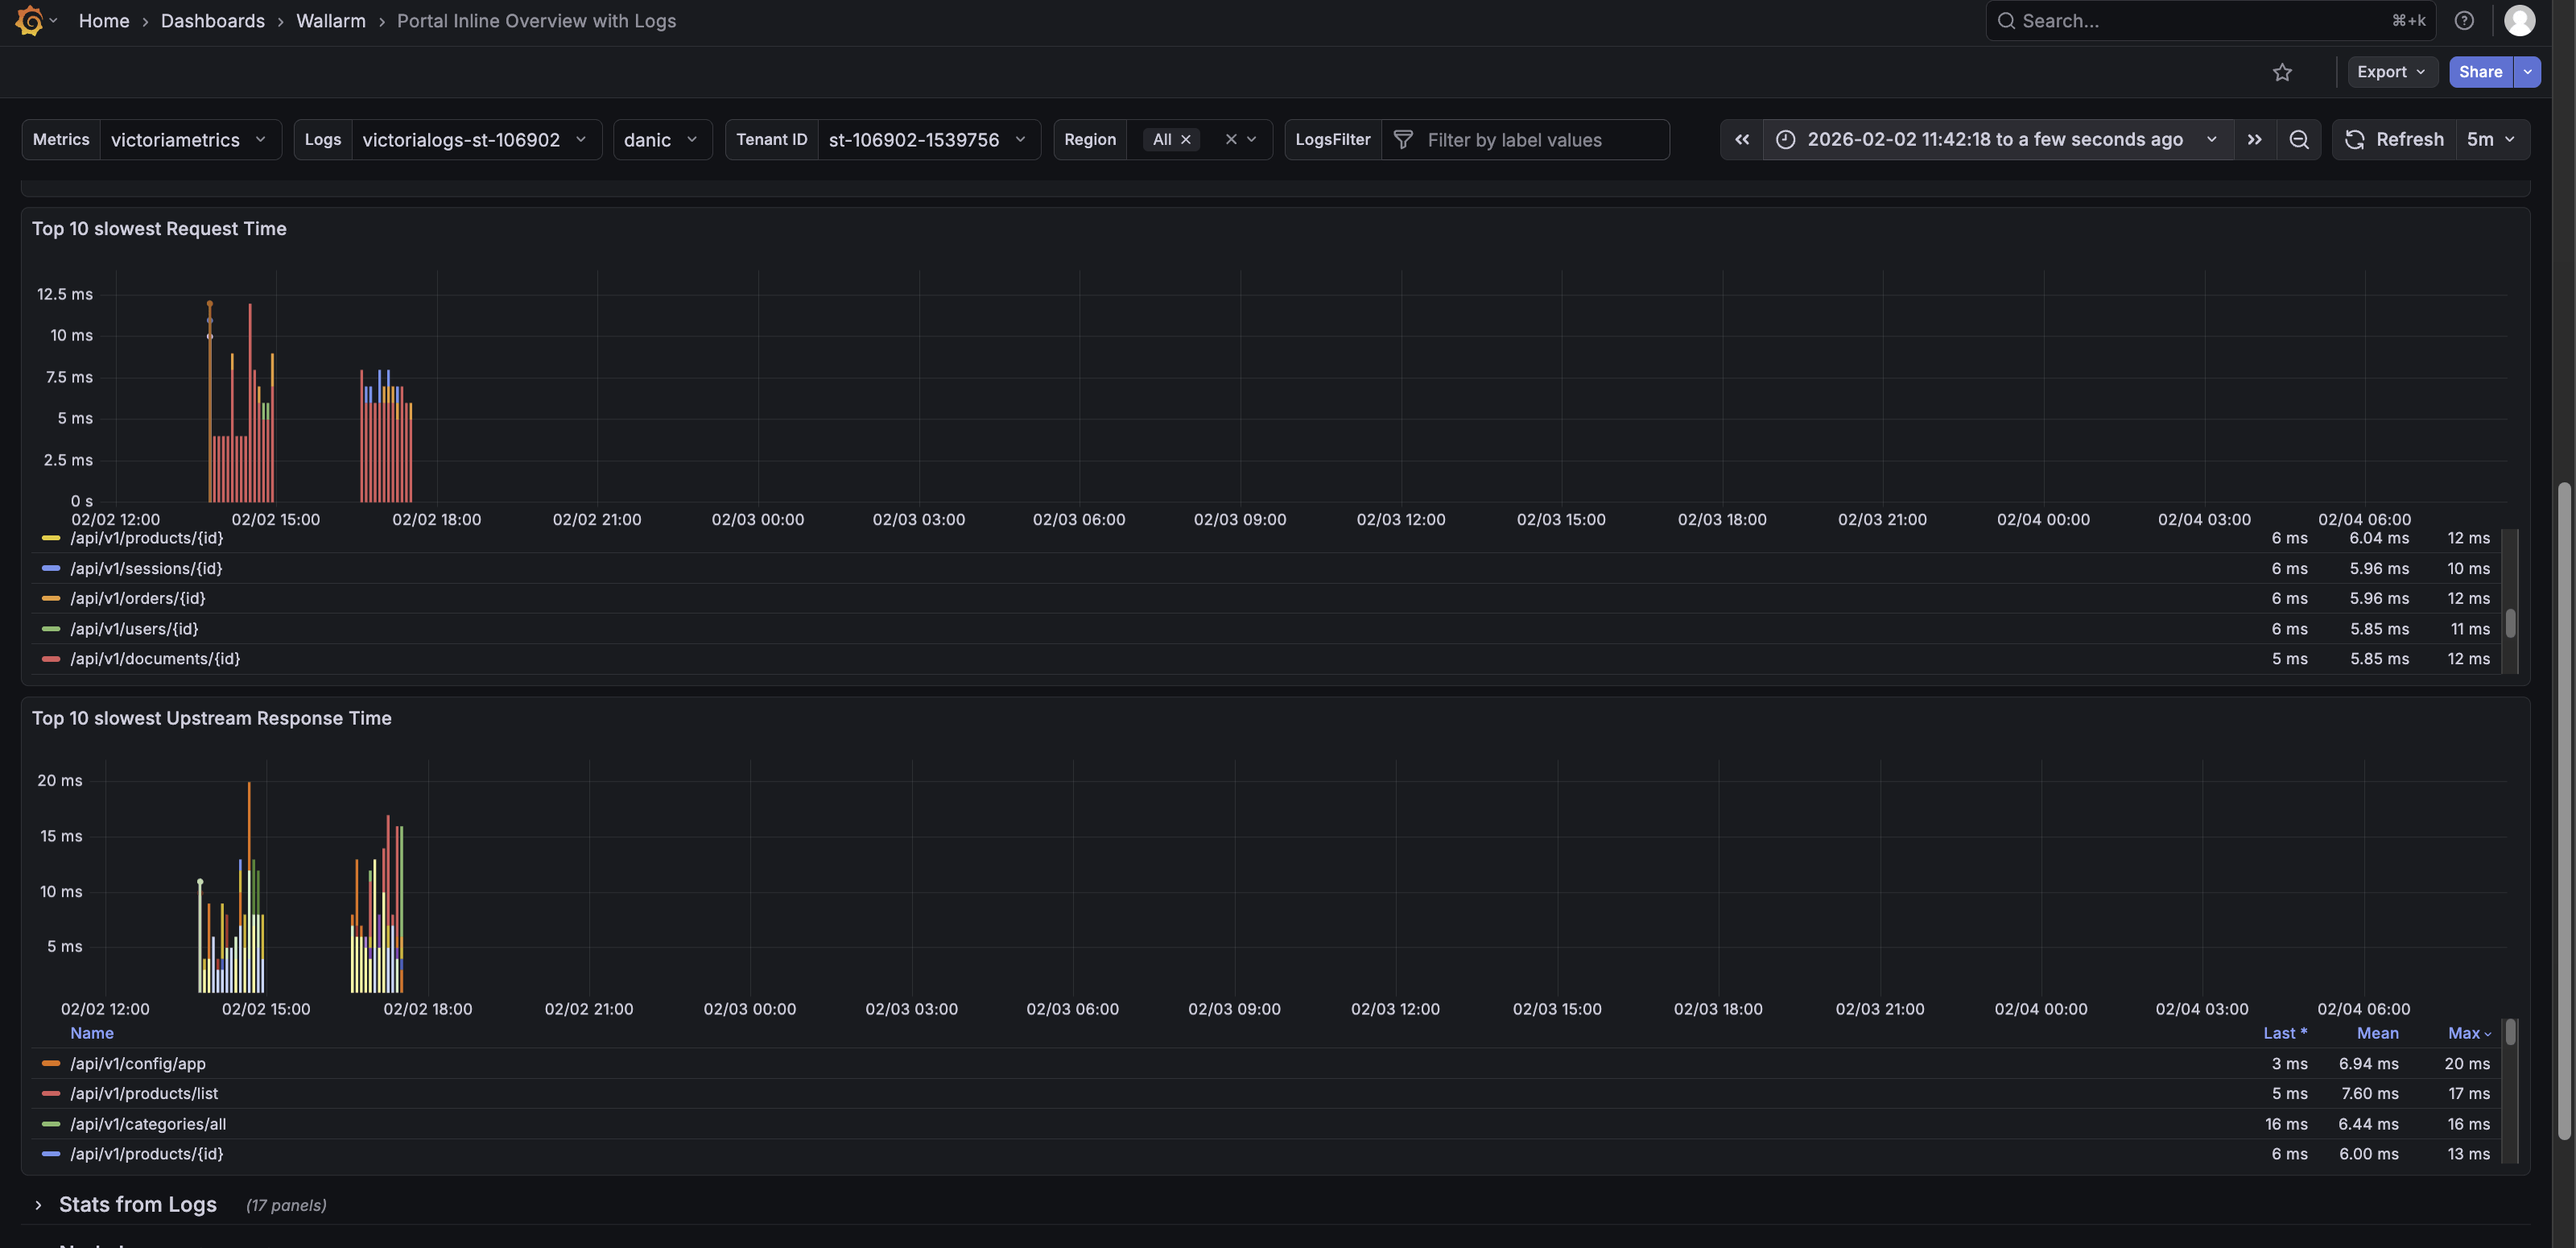
The Response Time row features the following panels:
-
Upstrem Response time last minute – Shows the 95th-percentile response time (P95 RT) for the top 10 URIs by request volume in the last minute.
-
Request Time last minute – Shows the 95th-percentile overall request response time for the last minute.
-
Top 10 slowest Request Time - Shows the slowest requests by total processing time.
-
Top 10 slowest Upstream Response Time - Shows the slowest by total processing time.
Stats from Logs row
The Stats from Logs row shows aggregated NGINX log data. It helps monitor traffic patterns, detect anomalies, and investigate potential performance or security issues.
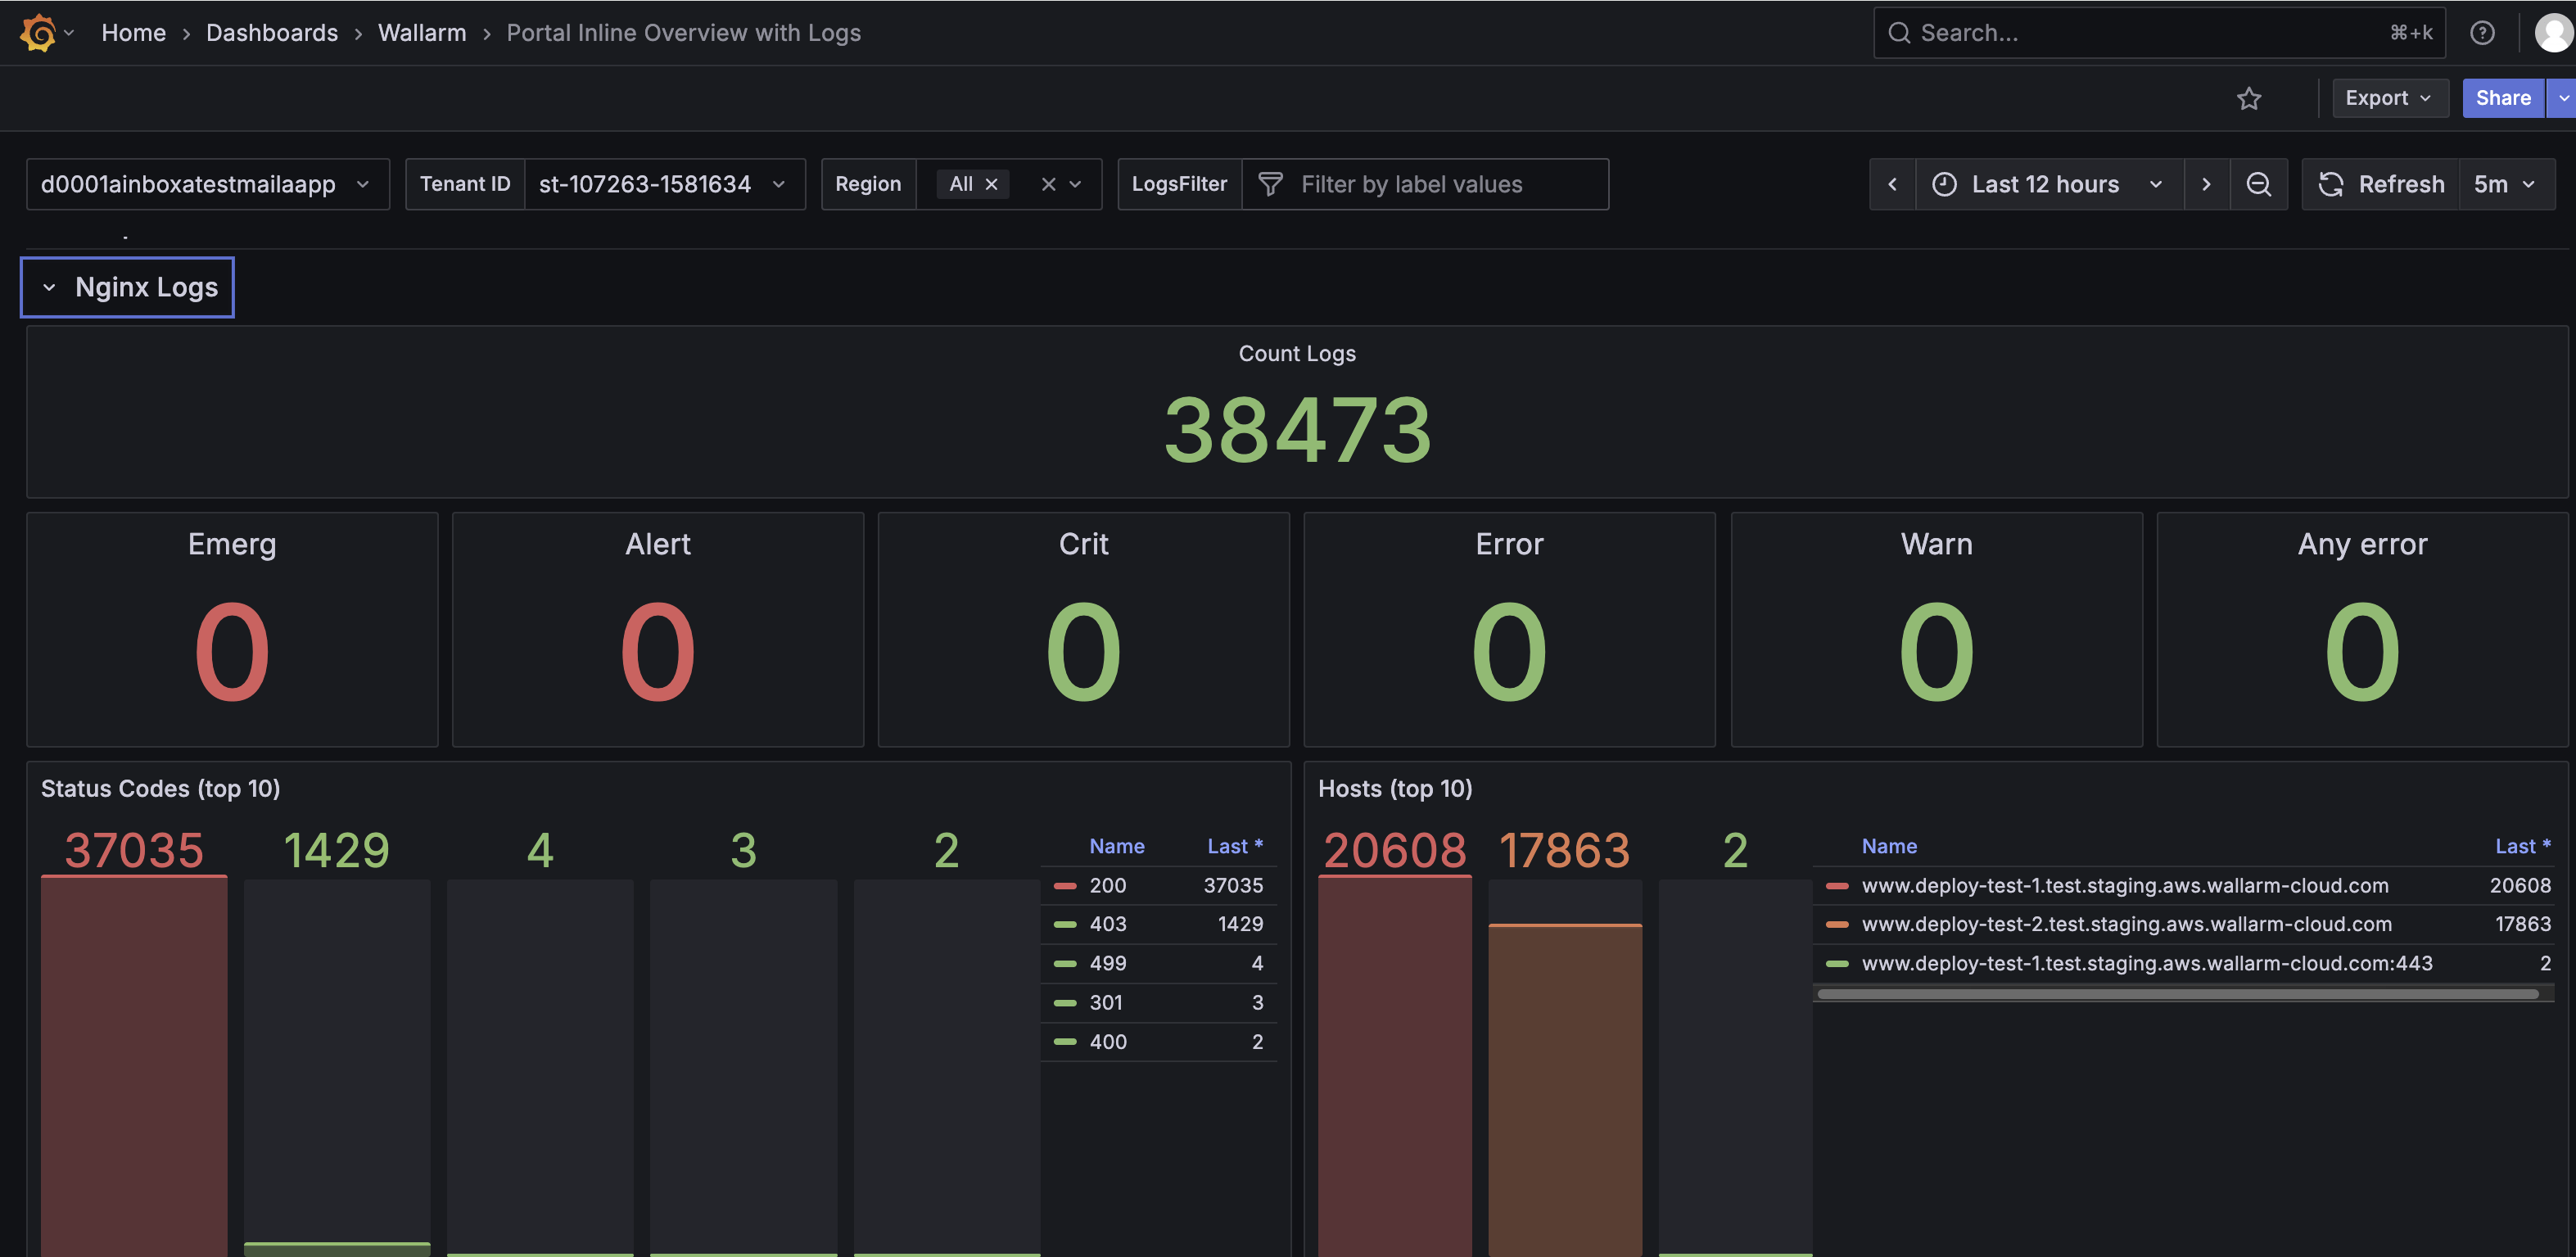
The Stats from Logs row features the following panels:
-
Count Log – Shows the total number of recorded log entries.
-
Emerg, Alert, Crit, Error, Warn – Shows the number of log entries by severity, from emergency-level events to warnings.
-
Any error – Shows all error-level logs combined to highlight potential problems.
-
Status Codes (top 10) – Displays the distribution of HTTP response codes, including 2XX, 3XX, 4XX, and 5XX responses, helping identify common status codes returned by NGINX.
-
Hosts (top 10) – Shows the hosts with the highest number of log entries.
-
5XX / 4XX / 3XX / 2XX HTTP codes – Show counts for server errors, client errors, redirects, and successful responses.
-
Regions (top 10) – Shows log counts per region.
-
Remote addr (top 10) – Shows the top client IP addresses sending requests.
-
Methods (top 10) – Shows the most used HTTP methods (GET, POST, PUT, etc.).
-
URI (top 10) – Shows the most accessed URIs.
Node Logs row
The Node Logs row shows NGINX error and access logs from the Node, helping you investigate failures, slow requests, and abnormal traffic.
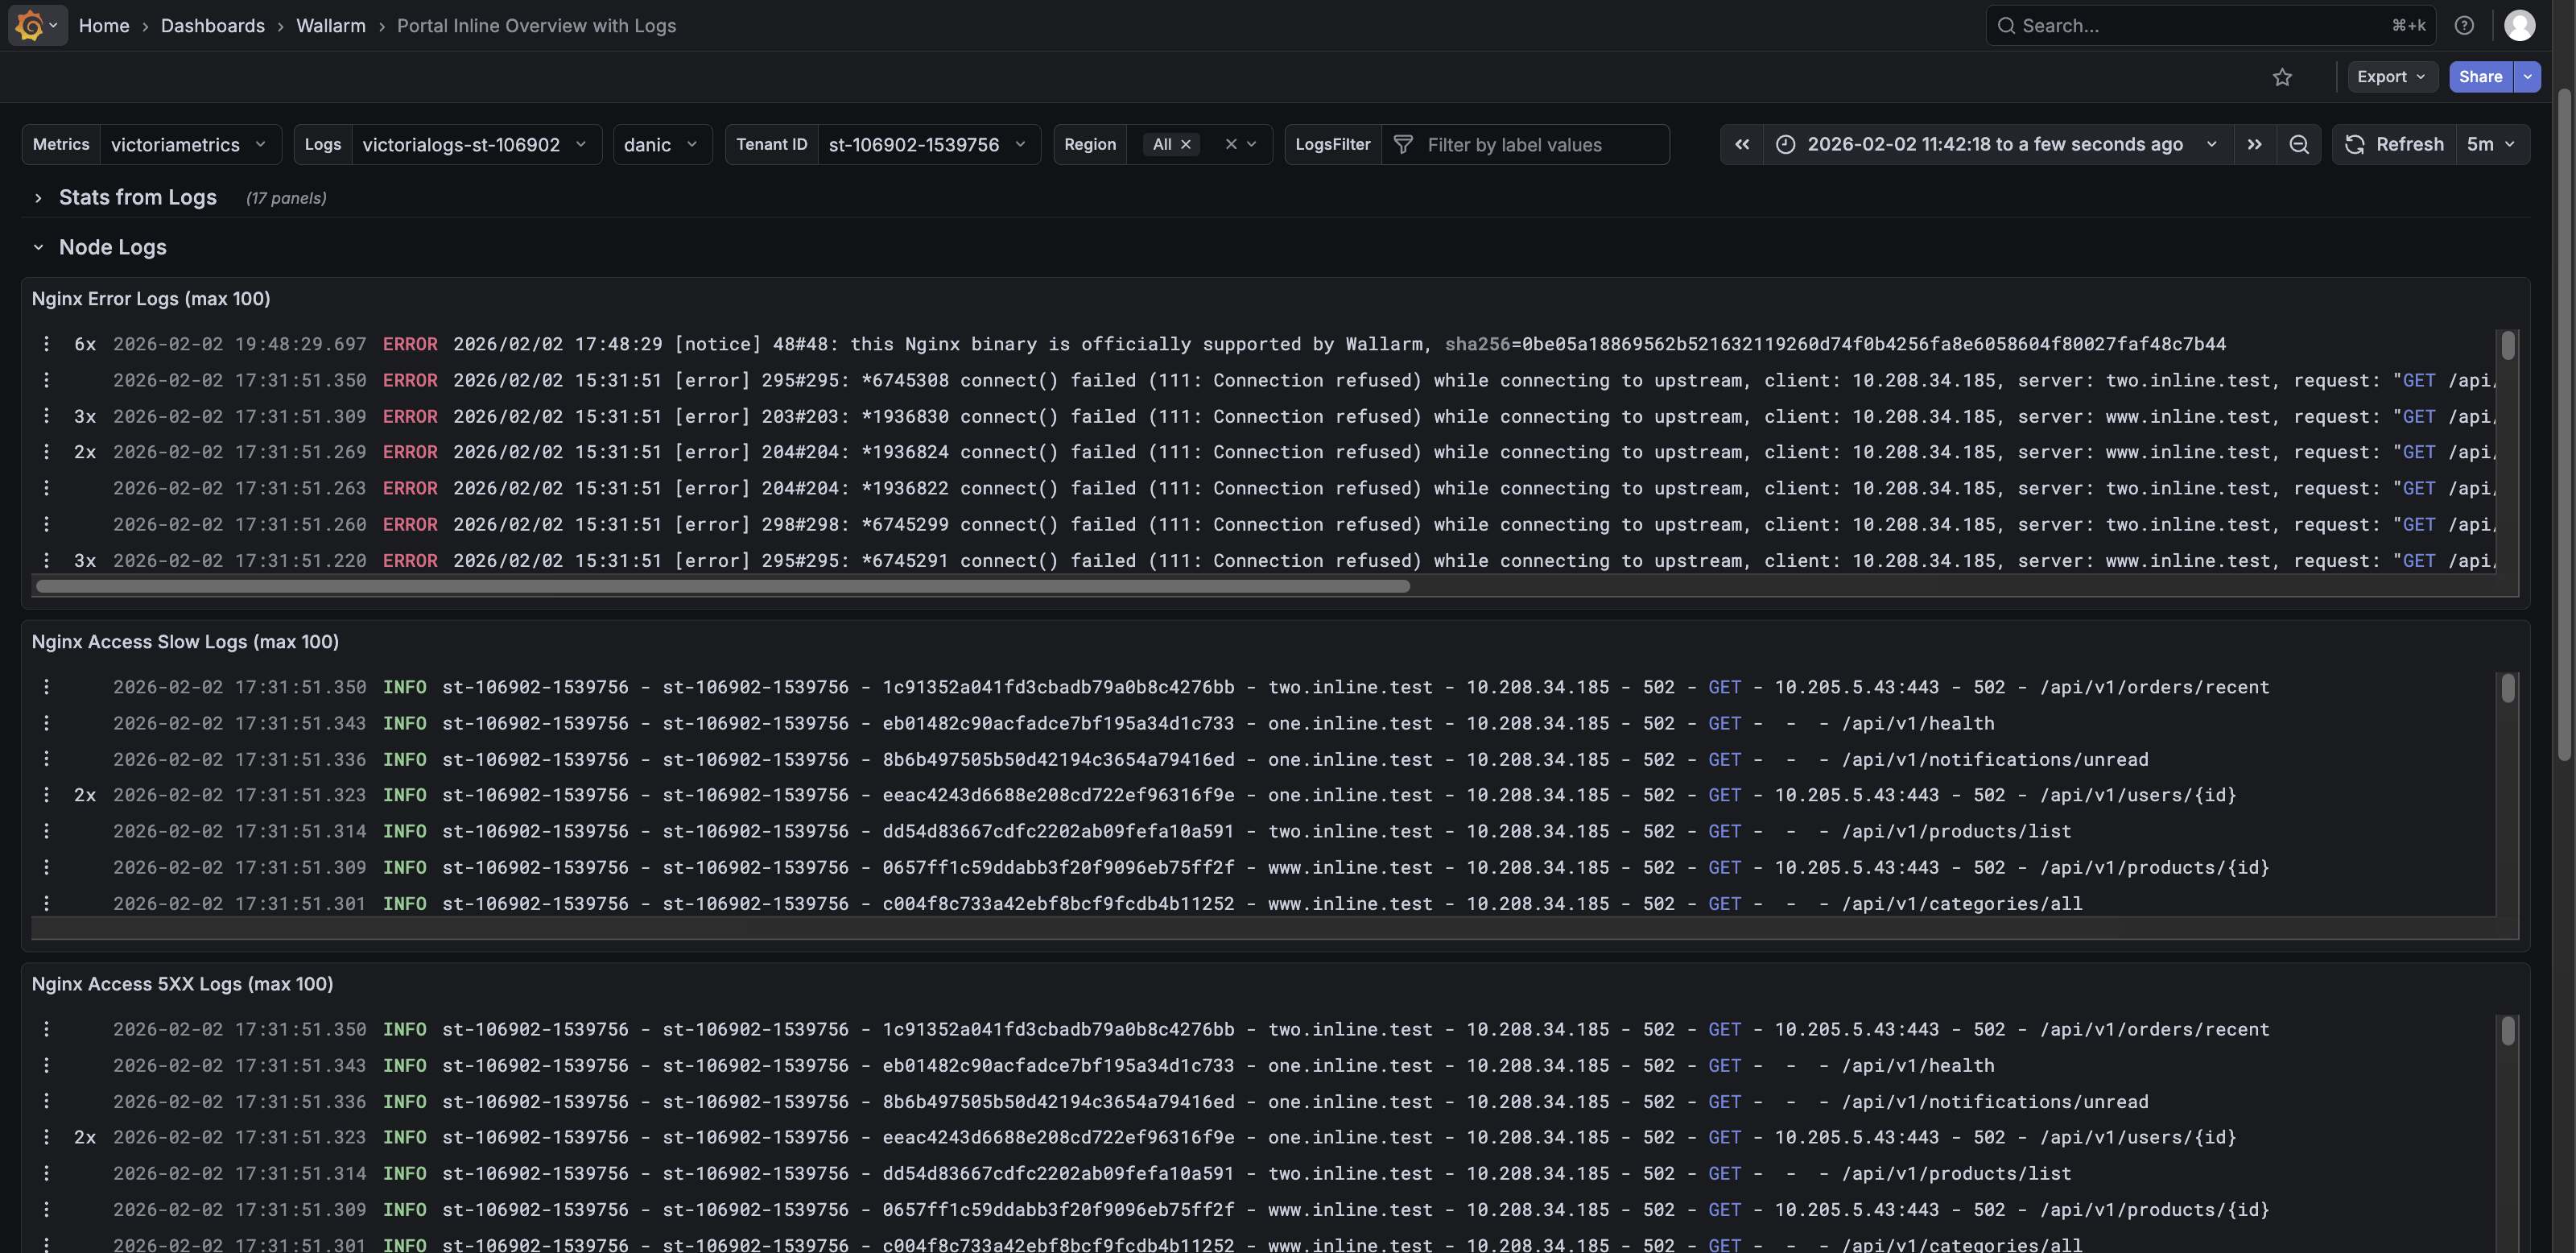
The Node Logs row features the following panels:
-
NGINX Error Logs (max 1000) – Shows the most recent NGINX error logs.
-
NGINX Access Slow Logs (max 1000) – Shows recent slow request logs.
-
NGINX Access 5XX Logs (max 1000) – Shows recent logs of requests that returned 5XX errors.
-
Access Logs (max 1000) – Shows recent access logs, including timestamp, host, client IP, response code, method, and URI.
Unlike the dedicated Portal Inline NGINX Logs dashboard, which shows only NGINX error and access logs, the Node Logs row presents these logs alongside other key node and Wallarm metrics. This way you can monitor NGINX traffic in context, correlate errors with overall performance, and detect potential issues more efficiently.
To quickly view NGINX error and access logs without additional metrics, use the dedicated Portal Inline NGINX Logs dashboard.
Wallarm Metrics row
The Wallarm Metrics row shows operational status, performance, and internal statistics of the Wallarm Nodes. It helps monitor request handling, rule application, error conditions, and resource use.
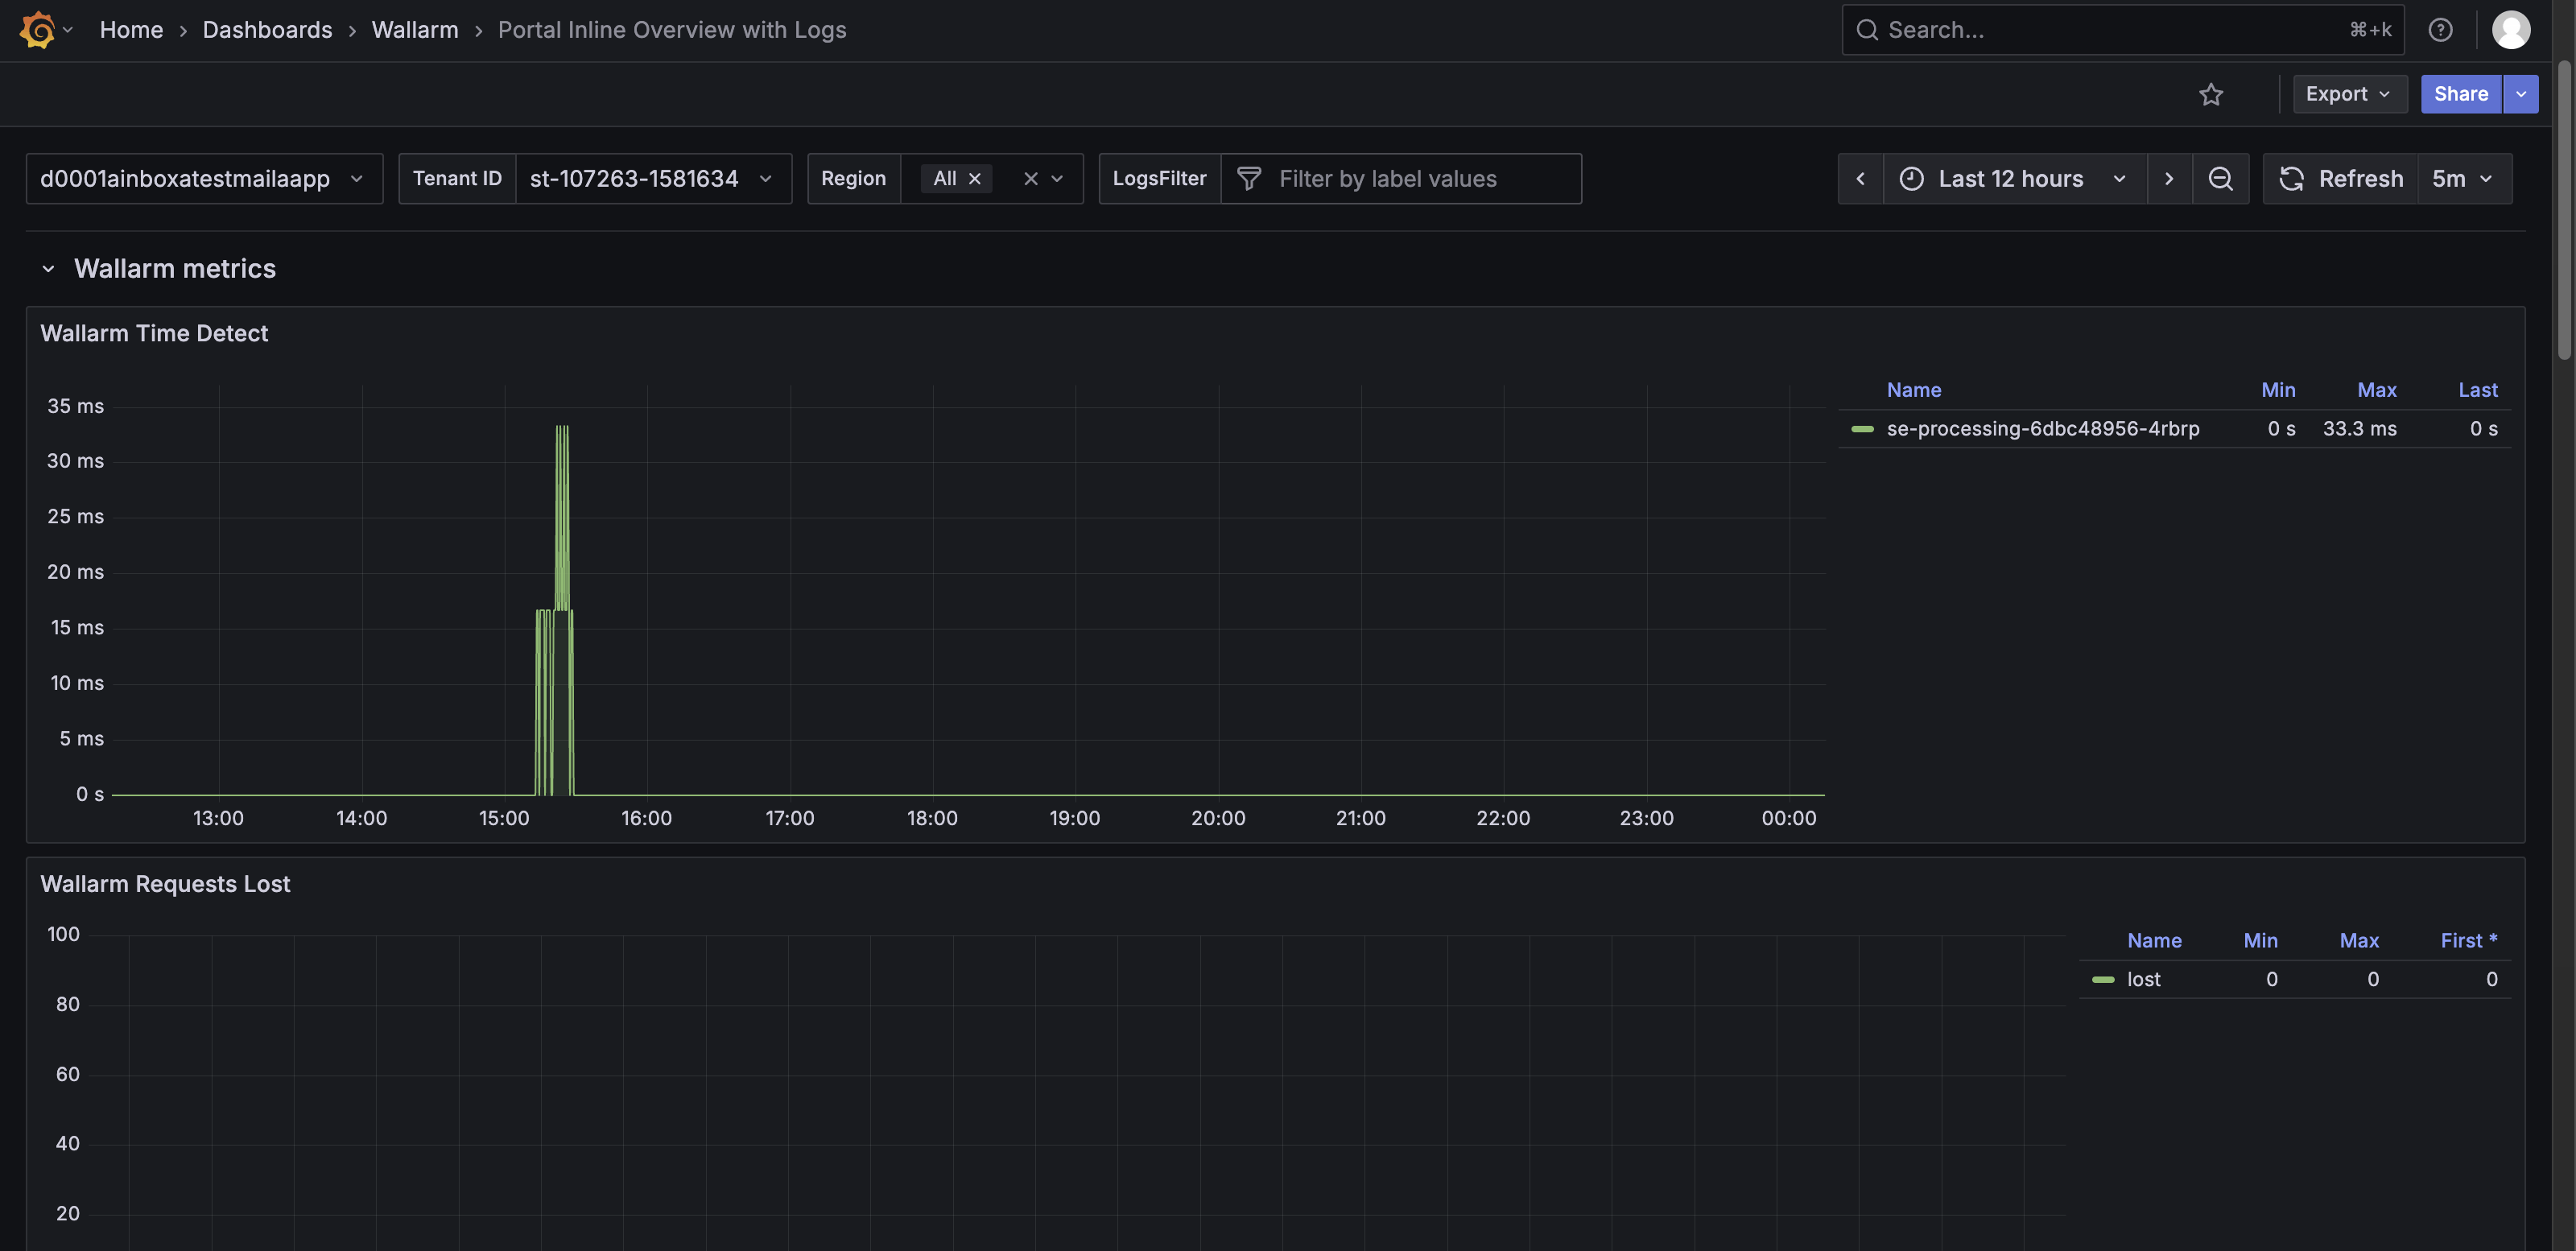
The Wallarm Metrics row features the following panels:
-
Wallarm Time Detect – Shows the time Wallarm takes to detect threats for requests, with a timeline graph and Min/Max/Last values.
-
Wallarm Requests Lost – Shows the number of requests lost due to processing issues.
-
Wallarm Proton Instances – Shows information about downloaded proton.db + LOM pairs:
- total – The total number of pairs.
- success – The number of pairs successfully downloaded from the Wallarm Cloud.
- failed – The number of pairs that failed to initialize, meaning NGINX was unable to download the proton.db + LOM either from the Cloud or the backup directory. If
wallarm_fallbackis enabled and this occurs, the Wallarm module will be disabled, leaving only the NGINX module operational. To diagnose the issue, check the NGINX logs or contact Wallarm support. - fallback – The number of pairs downloaded from the backup directory. This indicates that there were issues downloading the latest proton.db + LOM from the Cloud, but NGINX was still able to load older versions of proton.db + LOM from the backup directory as the
wallarm_fallbackdirective is set to on.
-
Wallarm Overlimits Time – Shows the number of attacks detected by the Node classified as overlimiting of computational resources.
-
Wallarm Errors – Shows total errors detected across TNT, API, and Proton modules.
-
Wallarm Rate Limit Entries – Shows the number of unique request keys tracked for rate limiting.
-
Wallarm Rate Limit Expired – Shows the number of rate-limit keys removed automatically after expiration.
-
Wallarm Rate Limit Removed – Shows the number of rate-limit keys removed abruptly. A high value may indicate the need to increase
wallarm_rate_limit_shm_size. -
Wallarm Segfaults – Shows the number of worker process crashes caused by fatal errors.
-
Wallarm Rate Limit Shared Memory – Shows total memory allocated for the Wallarm rate limiting module.
-
Wallarm Rate Limit No Free Nodes – Shows nonzero values if there is insufficient memory for rate limiting, suggesting to increase
wallarm_rate_limit_shm_size. -
Wallarm Custom Ruleset ID – Shows the version of the currently applied custom ruleset.
-
Wallarm Ruleset Apply Time – Shows the time of the last update of the custom ruleset file.
-
Wallarm Start ID – Shows the randomly generated unique ID of the Node.
-
Wallarm DB Apply Time – Shows the time of the last update of the
proton.dbfile.
Resource Overview row
The Resource Overview row provides a detailed view of resource usage, container performance, and pod status. It helps monitor efficiency, capacity, and stability of the Wallarm Security Edge deployment.
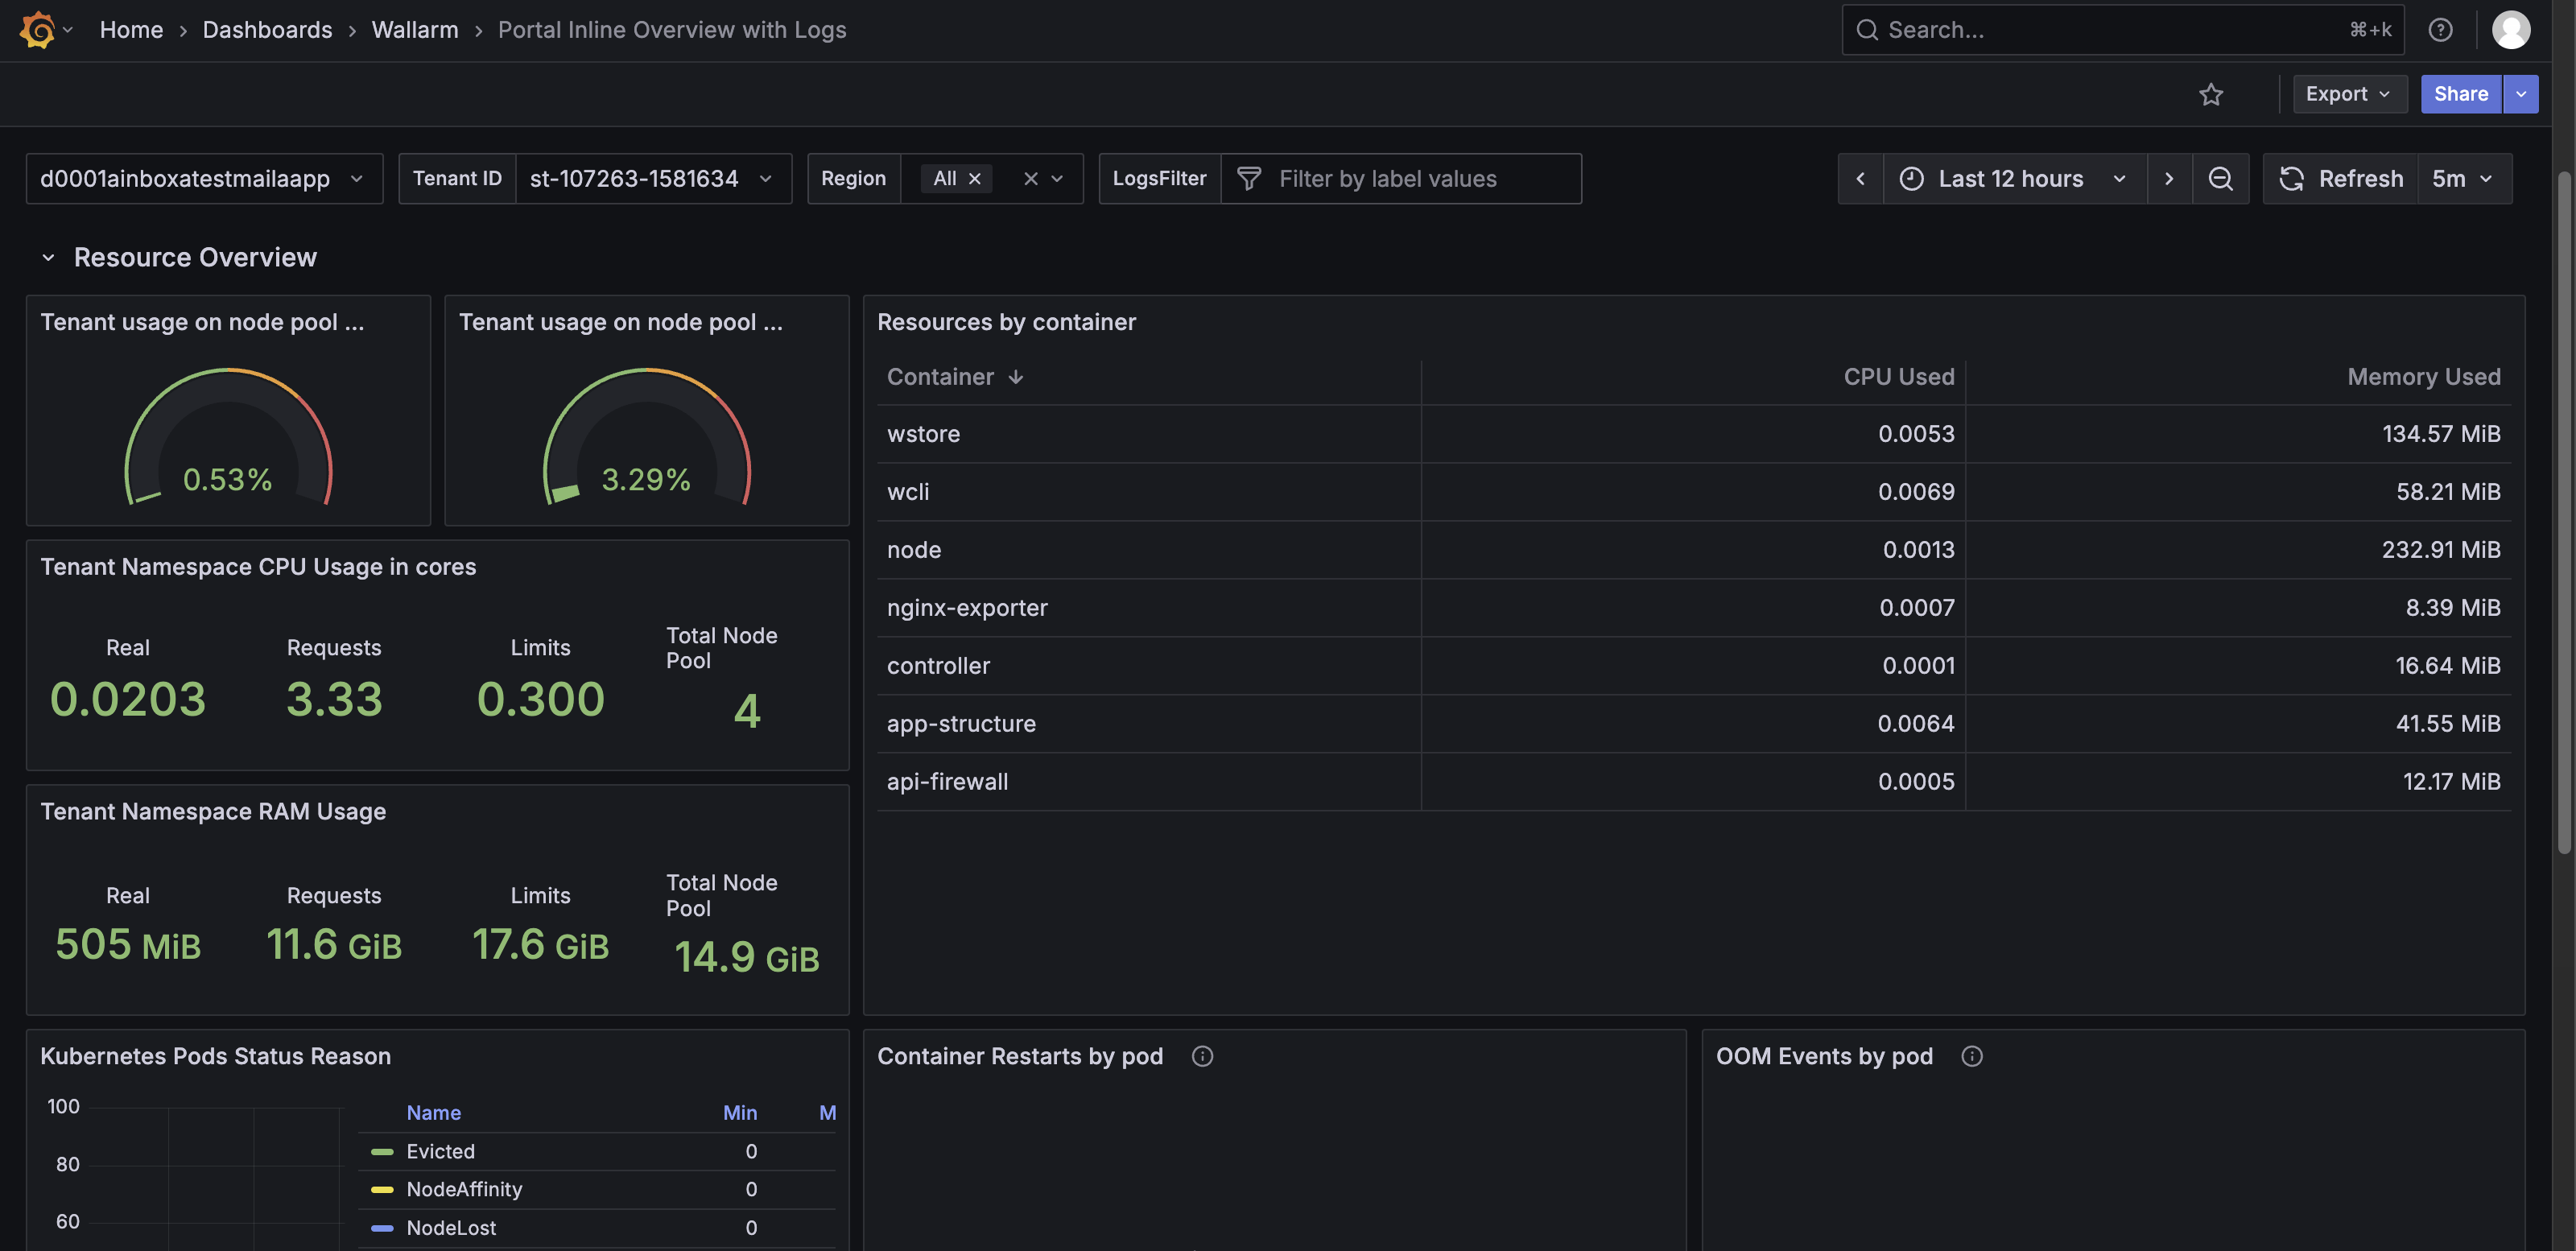
The Resource Overview row features the following panels:
-
Tenant usage on node pool CPU (%) – Shows the percentage of CPU used by the tenant across the Node pool.
-
Tenant usage on node pool RAM (%) – Shows the percentage of RAM used by the tenant across the Node pool.
-
Tenant Namespace CPU Usage in cores – Shows CPU usage per namespace, including real usage, requested resources, limits, and total Node pool capacity.
-
Tenant Namespace RAM Usage – Shows RAM usage per namespace, including real usage, requested resources, limits, and total Node pool memory.
-
Resources by container – Shows CPU and memory usage per container, including used, requested, and limit values.
-
Kubernetes Pods Status Reason – Shows pod status reasons (e.g.,
Evicted,NodeAffinity,NodeLost,Shutdown,UnexpectedAdmissionError) in a timeline graph with minimum, maximum, and mean values. -
Container Restarts by pod – Shows container restart events per pod. No data generally indicates stability.
-
OOM Events by pod – Shows out-of-memory events per pod. No data generally indicates no memory-related failures.
-
Nb of containers by state – Shows container states (
Ready,Running,Waiting,Restarts Total,Terminated) in a timeline graph and table values. -
Container Image Used – Shows container images deployed in a graph and table, with minimum, maximum, and last values.
Nginx Cache Status row
The Nginx Cache Status row shows NGINX cache efficiency and behavior across hosts and request paths. It helps assess cache effectiveness, identify cache bypasses or misses, and troubleshoot cache-related performance issues.
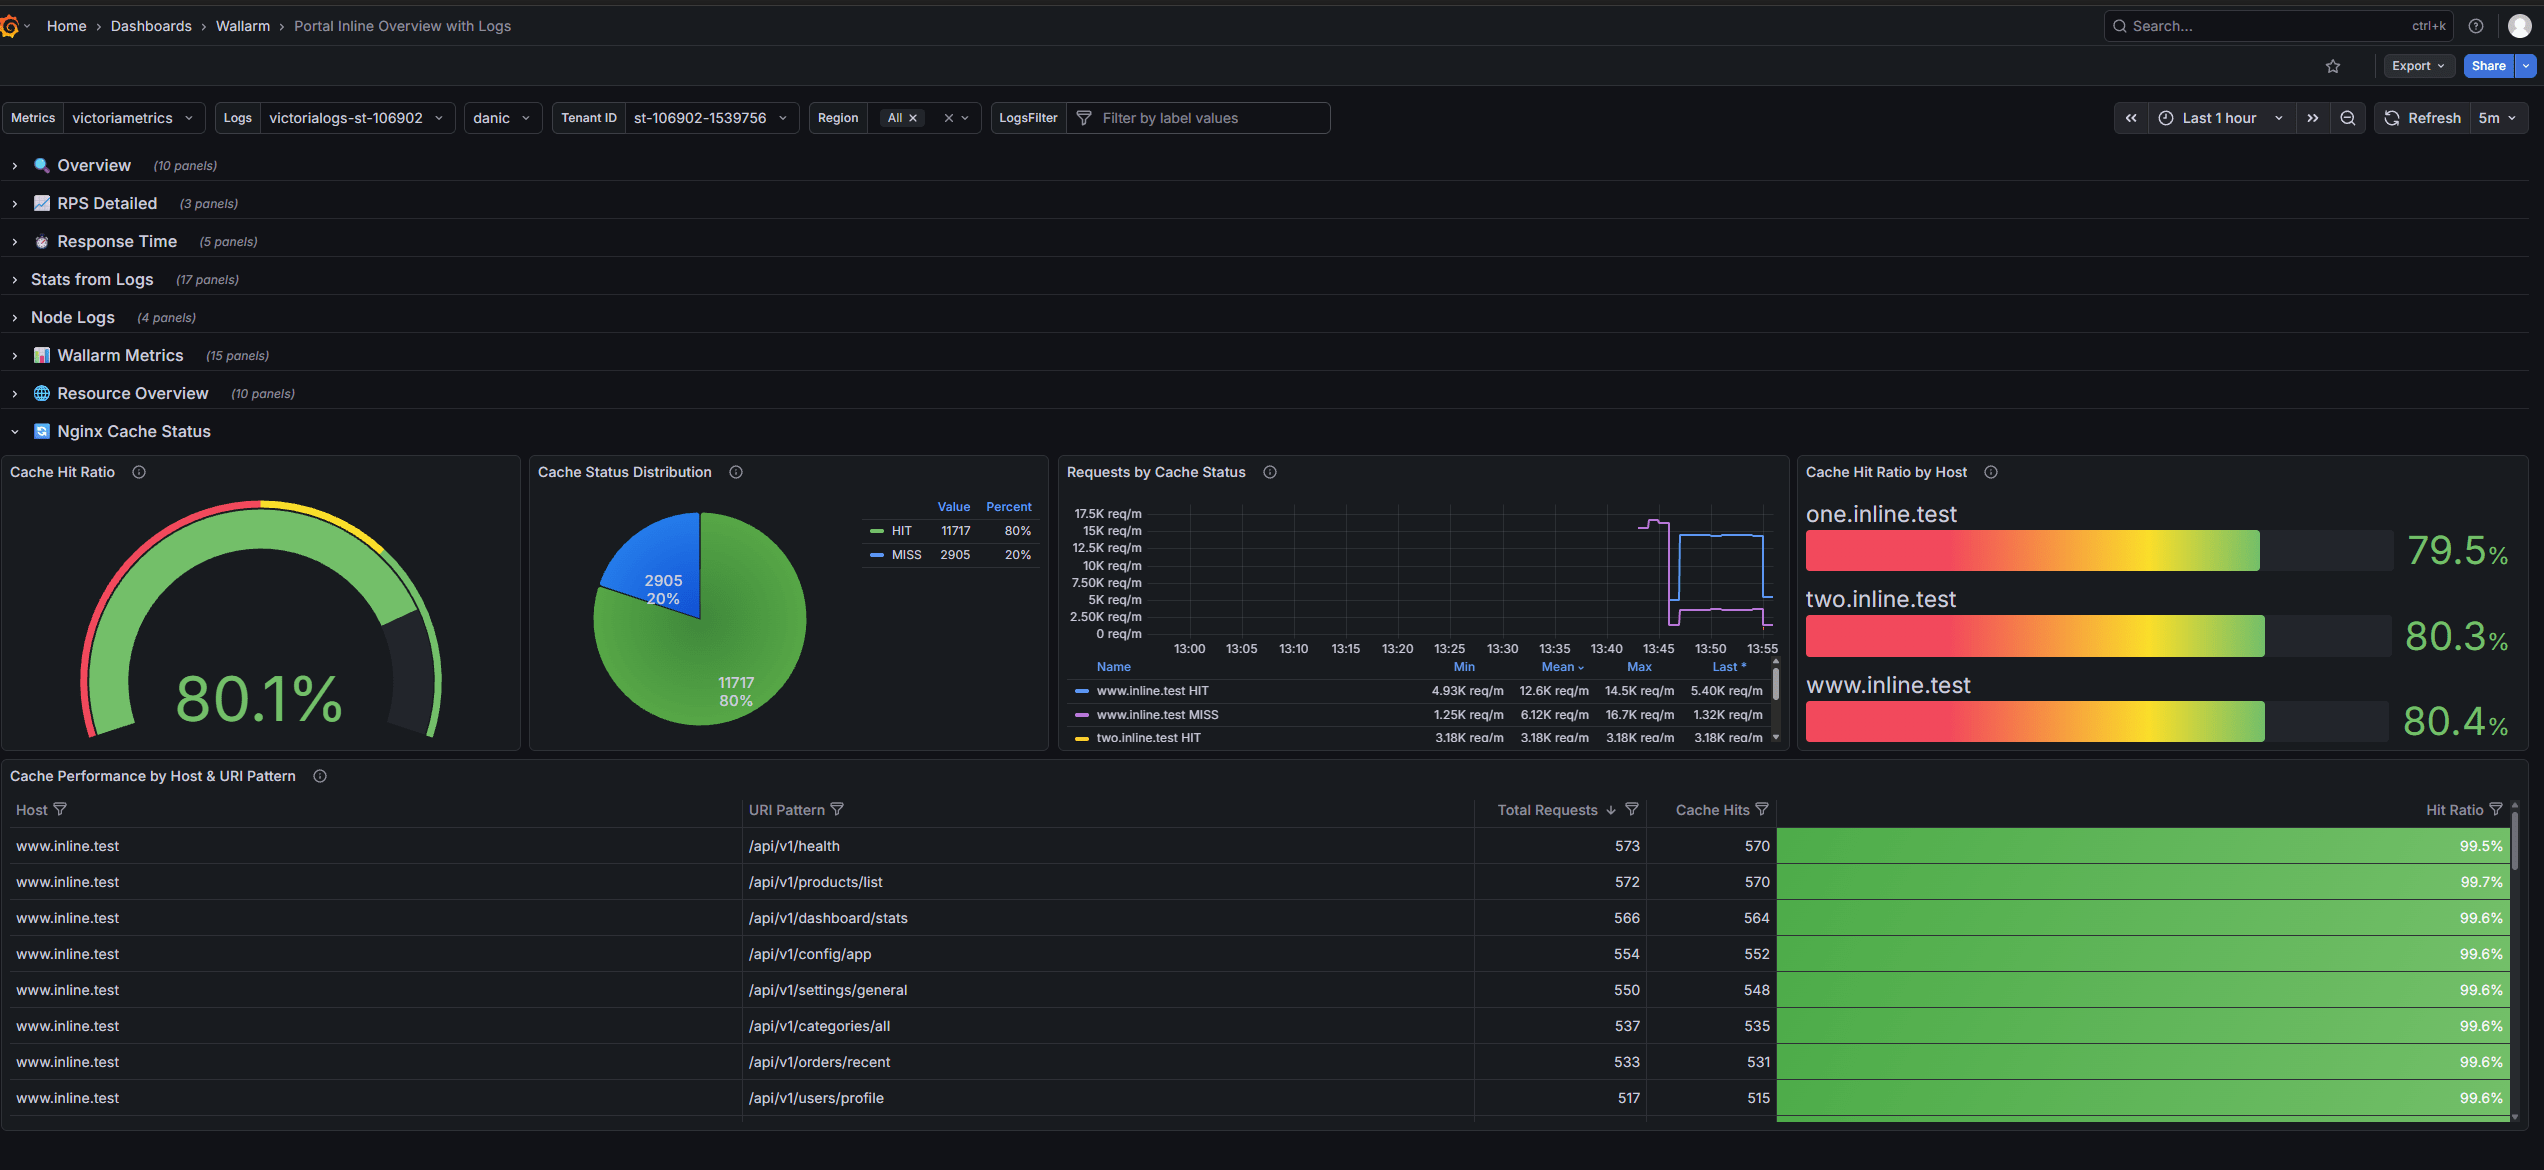
The Nginx Cache Status row features the following panels:
-
Cache Hit Ratio - Shows overall cache effectiveness as a single gauge.
-
Cache Status Distribution - Shows the distribution of cache statuses, including
HIT,MISS,BYPASS,EXPIRED,STALE, andDISABLED. -
Requests by Cache Status - Shows cache status trends over time.
-
Cache Hit Ratio by Host - Shows cache hit ratios per host, helping identify hosts with low cache efficiency.
-
Cache Performance by Host & URI Pattern - Shows cache performance for specific hosts and endpoints.