Fluentd経由のSplunk Enterprise
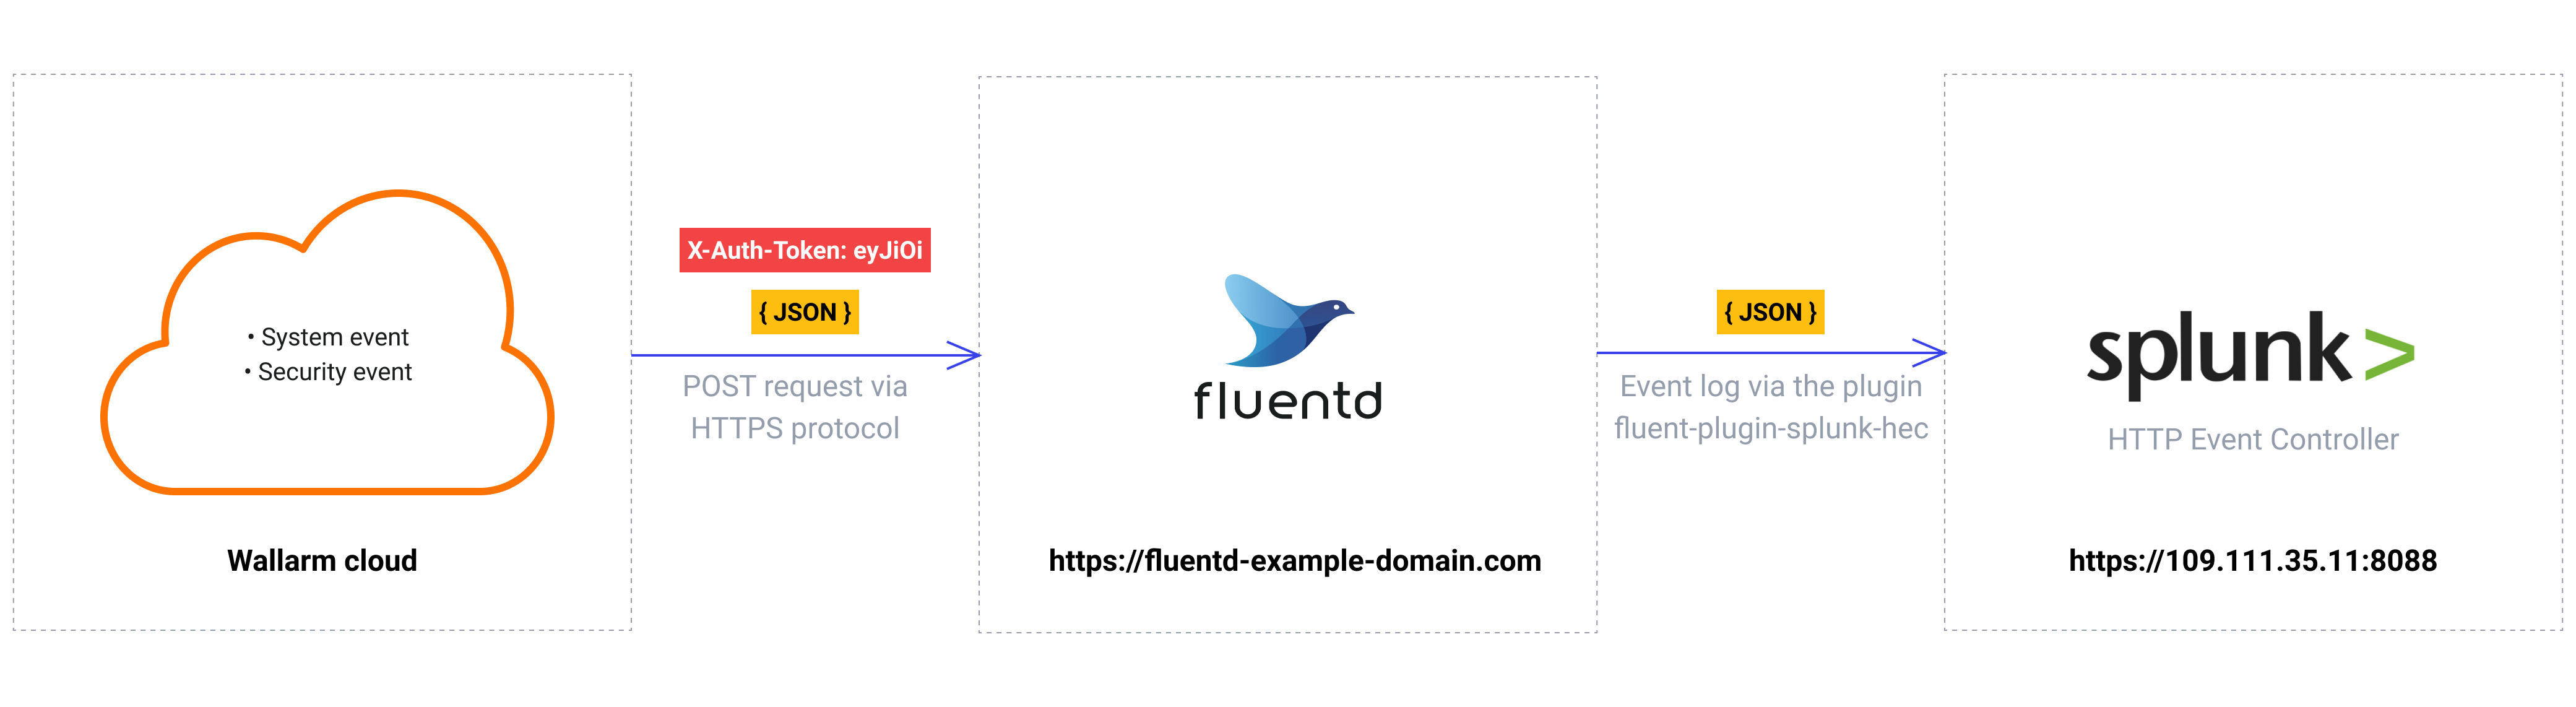
本書では、WallarmをデータコレクターのFluentdと連携し、イベントをSplunk SIEMシステムへ転送するためのインテグレーション例を示します。
The most common logging scheme in complex systems consists of the following components:
-
Data collector: accepts logs from several sources and forwards logs to the SIEM system
-
SIEM system or log management systems: used to analyze logs and monitor the system status
使用リソース
-
WEB URL
https://109.111.35.11:8000とAPI URLhttps://109.111.35.11:8088を持つSplunk Enterpriseを使用します -
Debian 11.x (bullseye)にインストールされ、
https://fluentd-example-domain.comで利用可能なFluentdを使用します -
EUクラウドのWallarm Consoleへの管理者アクセスを使用して、Fluentdインテグレーションを構成します
Wallarm Cloud IP addresses
To provide Wallarm Cloud access to your system, you may need a list of its public IP addresses:
Splunk EnterpriseおよびFluentdサービスへのリンクはサンプルとして記載しているため、応答しません。
Splunk Enterpriseの構成
Fluentdのログは、名前をWallarm Fluentd logsとし、その他のデフォルト設定でSplunk HTTP Event Controllerへ送信します:
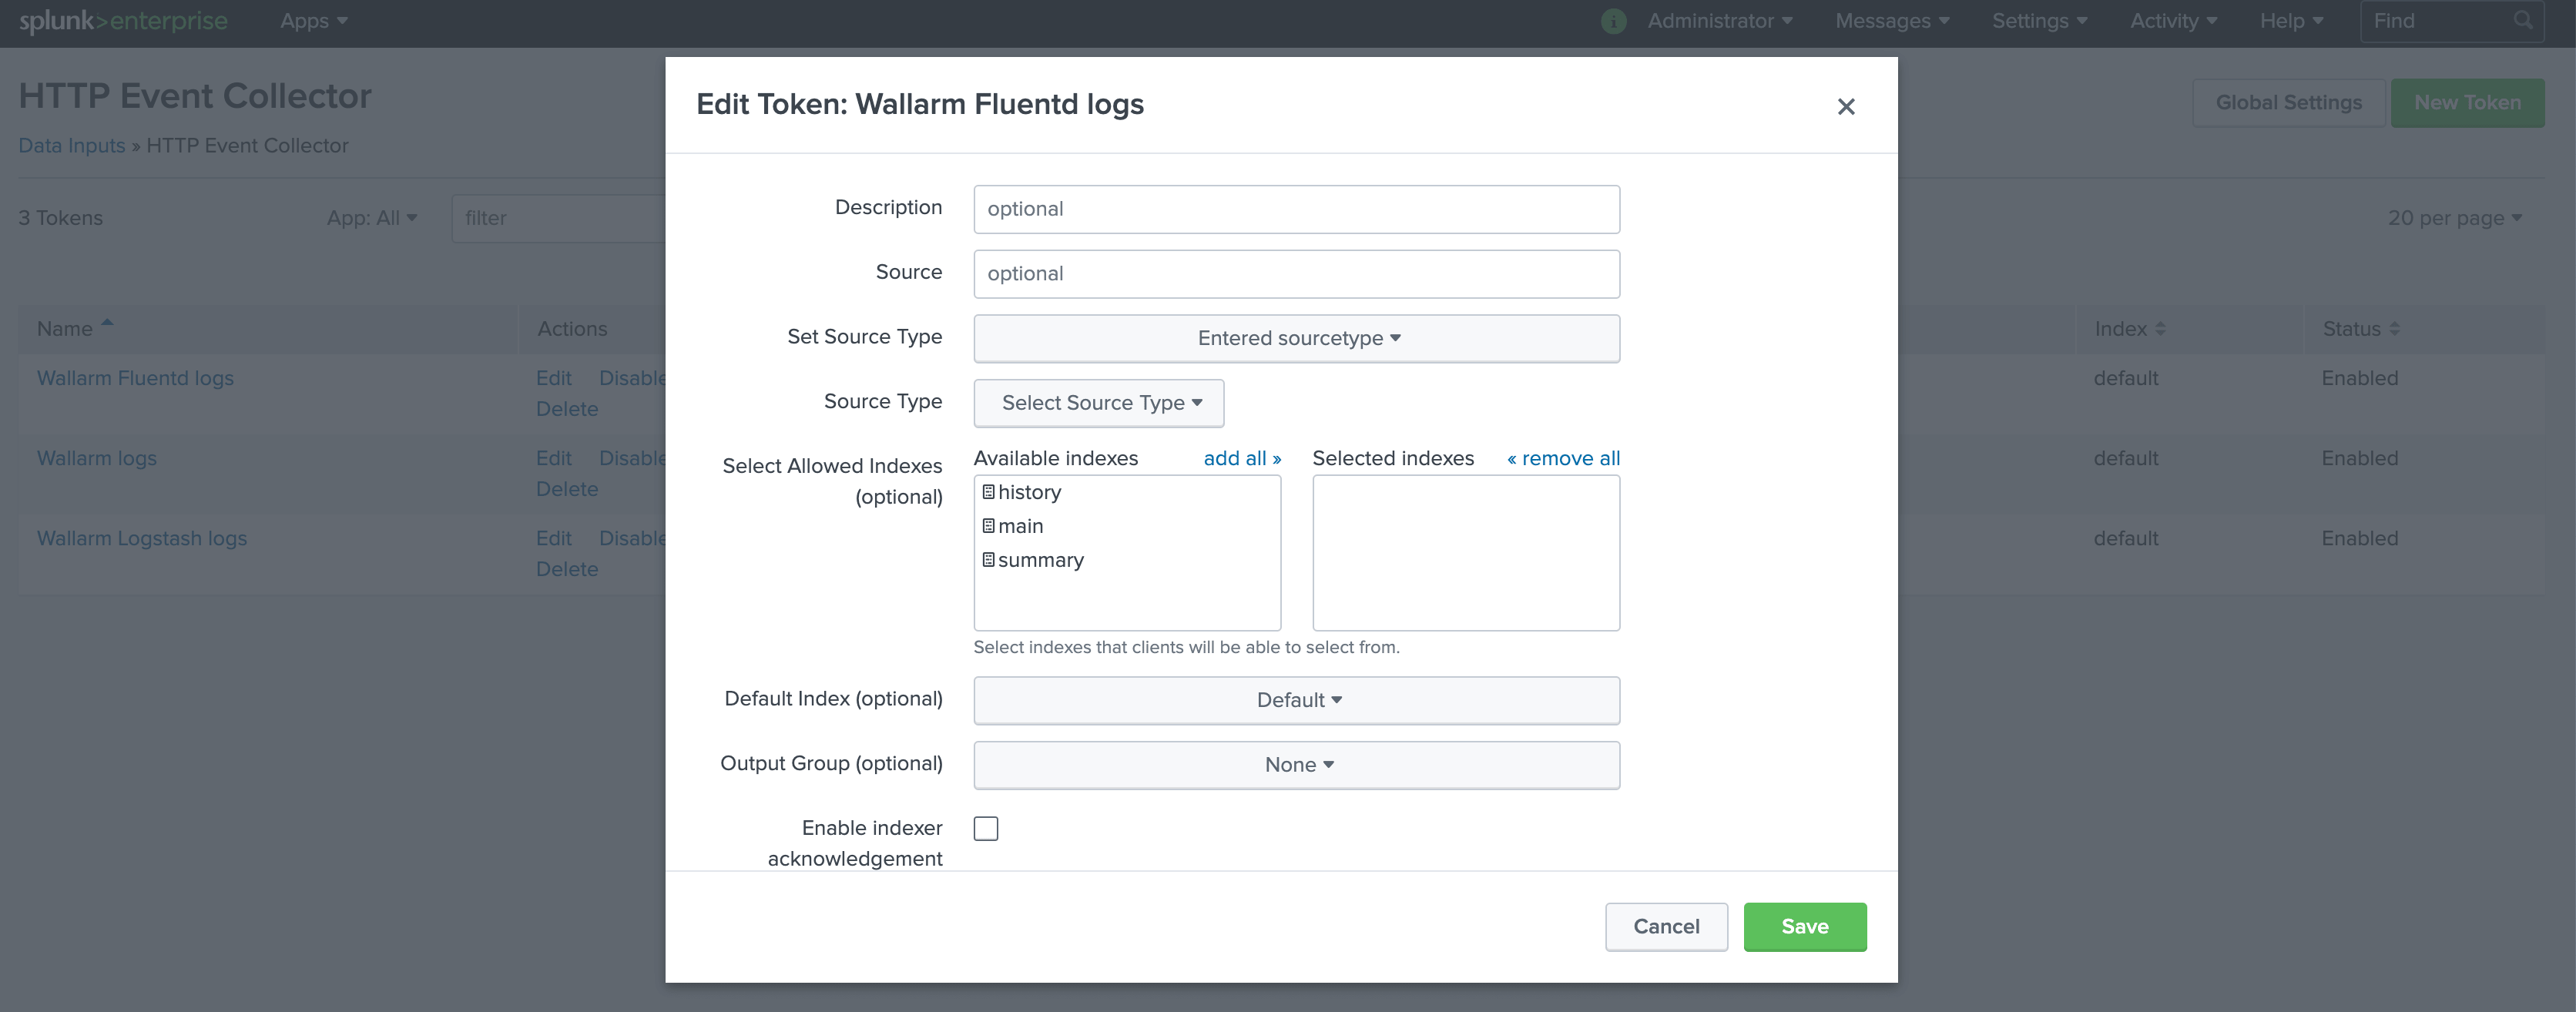
HTTP Event Controllerへのアクセスには、生成されたトークンf44b3179-91aa-44f5-a6f7-202265e10475を使用します。
Splunk HTTP Event Controllerの設定の詳細はSplunk公式ドキュメントにあります。
Fluentdの構成
WallarmはWebhook経由で中間のデータコレクターであるFluentdへログを送信するため、Fluentdの構成は次の要件を満たす必要があります:
-
POSTまたはPUTリクエストを受け付けます
-
HTTPSリクエストを受け付けます
-
公開URLでアクセス可能です
-
ログをSplunk Enterpriseへ転送します。この例では、ログ転送に
splunk_hecプラグインを使用します
Fluentdはtd-agent.confファイルで次のように構成します:
-
受信Webhookの処理は
sourceディレクティブで設定します:- トラフィックはポート9880へ送信します
- FluentdはHTTPS接続のみを受け付けるように構成します
- 公的に信頼されたCAが署名したFluentdのTLS証明書は
/etc/ssl/certs/fluentd.crtに配置します - TLS証明書の秘密鍵は
/etc/ssl/private/fluentd.keyに配置します
-
ログのSplunkへの転送とログ出力は
matchディレクティブで設定します:- すべてのイベントログをFluentdからコピーし、出力プラグインfluent-plugin-splunk-hec経由でSplunk HTTP Event Controllerへ転送します
- Fluentdのログは、追加でコマンドラインにJSON形式で出力します(コードの19〜22行目)。この設定は、イベントがFluentd経由で記録されていることを検証するために使用します
設定ファイルのより詳細な説明はFluentdの公式ドキュメントにあります。
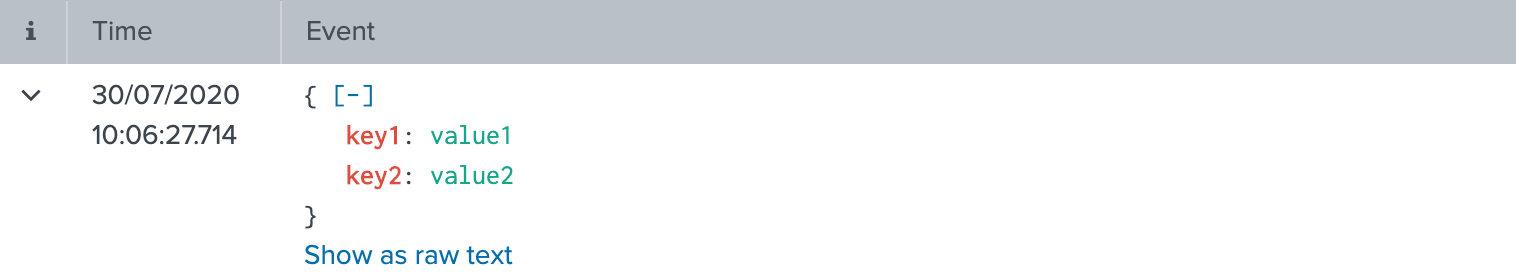
Fluentdの構成のテスト
Fluentdのログが作成されSplunkへ転送されていることを確認するには、FluentdにPUTまたはPOSTリクエストを送信できます。
リクエスト例:
curl -X POST 'https://fluentd-example-domain.com' -H "Content-Type: application/json" -H "Authorization: Splunk f44b3179-91aa-44f5-a6f7-202265e10475" -d '{"key1":"value1", "key2":"value2"}'
Fluentdのログ:

Splunkのログ:
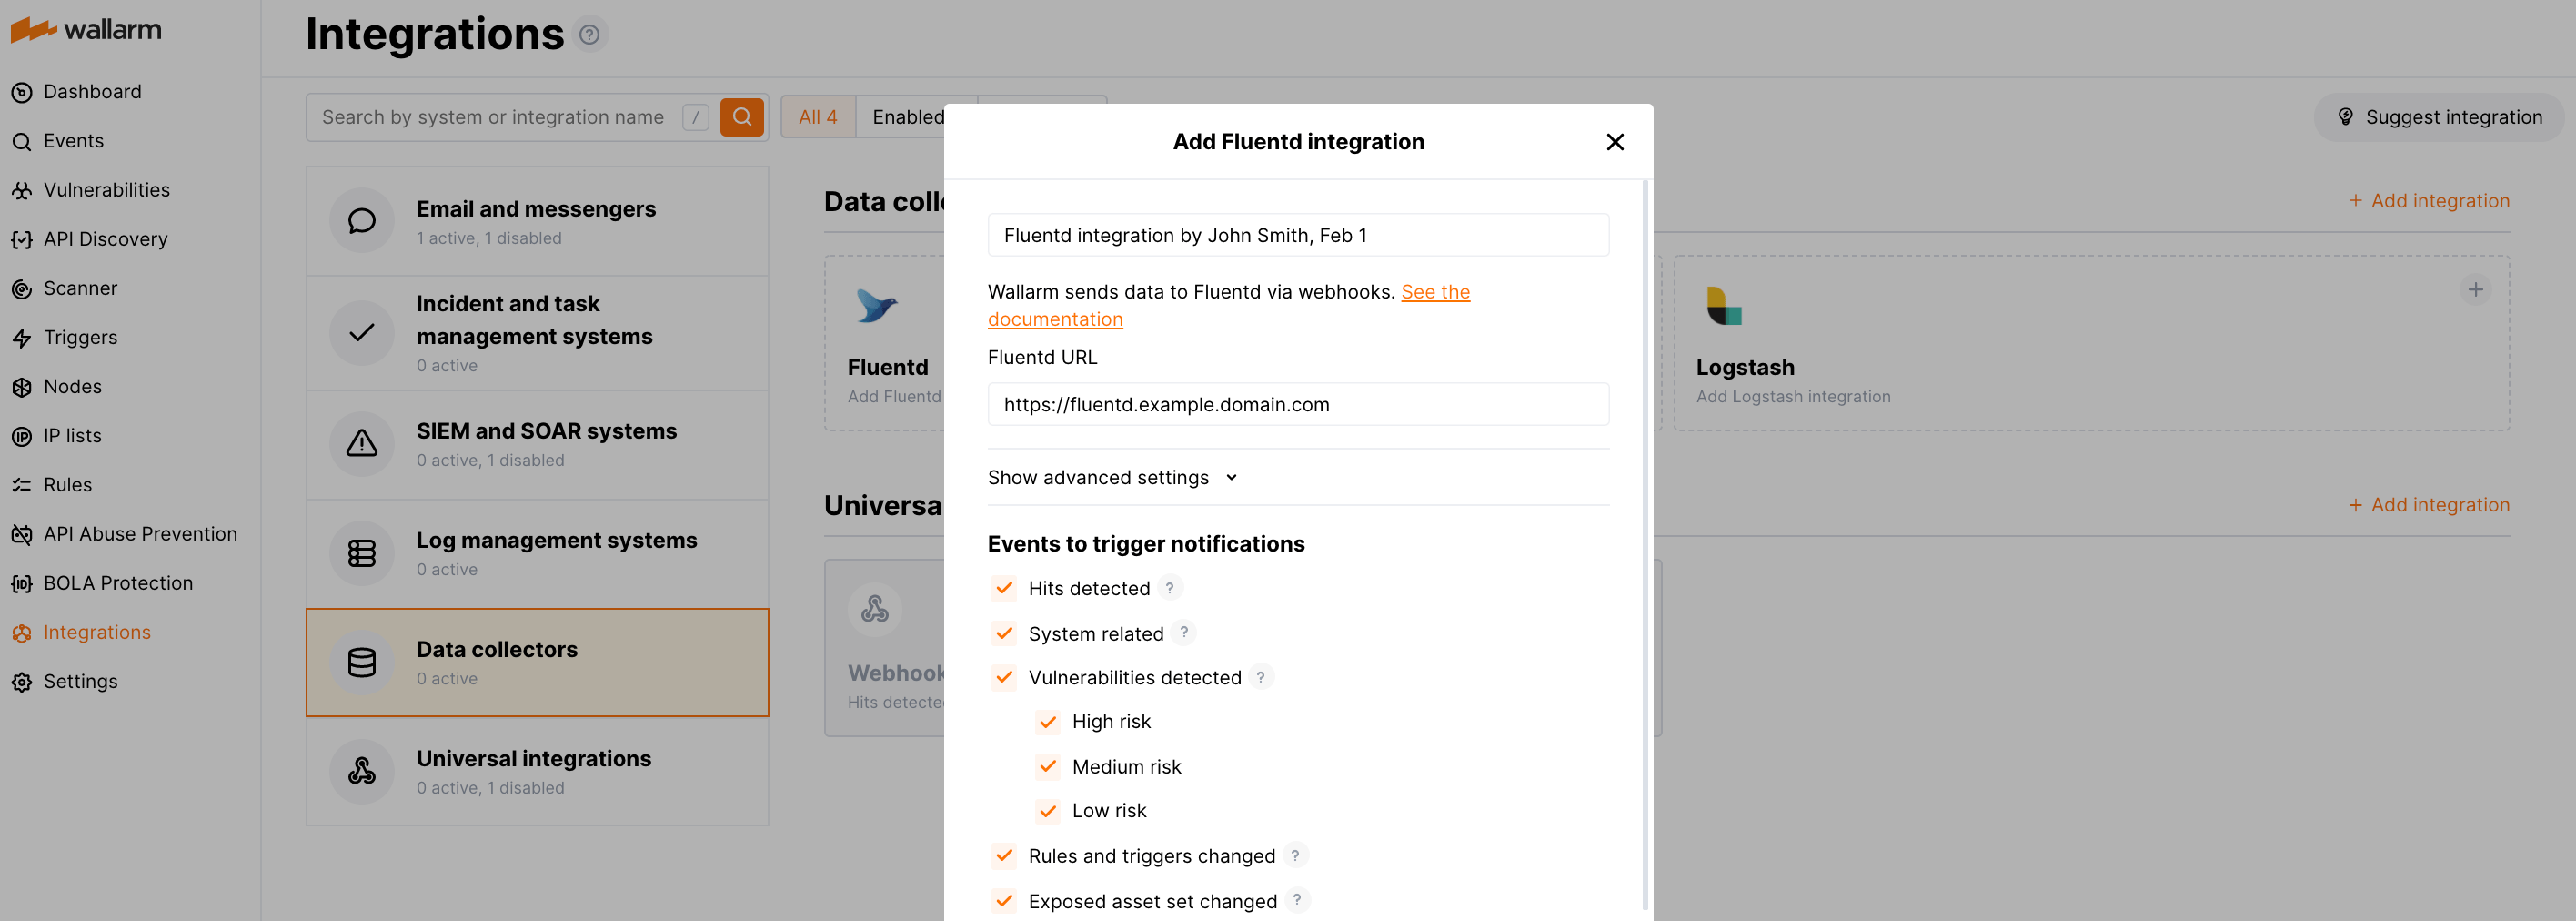
Fluentdインテグレーションの構成
-
Webhooks are sent to
https://fluentd-example-domain.com -
Webhooks are sent via POST requests
-
The webhook integration has default advanced settings
-
Webhooks sent to Webhook URLs are all available events: hits, system events, vulnerabilities, scope changes
テスト例
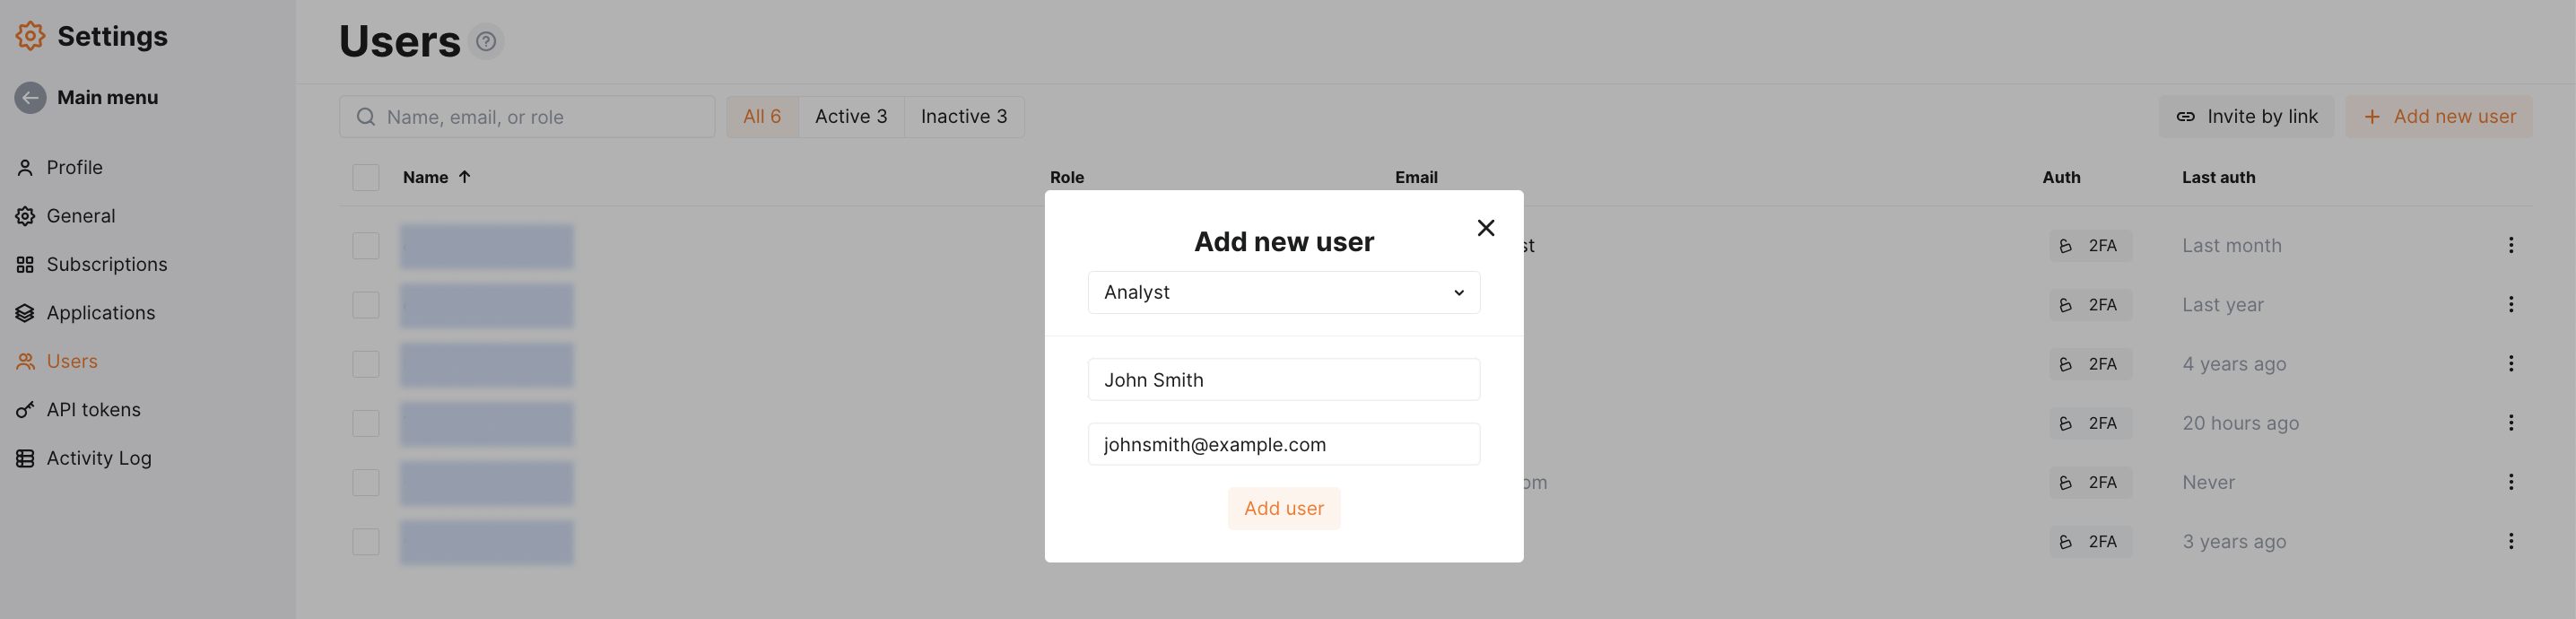
To test the configuration, a new user is added in Wallarm Console:
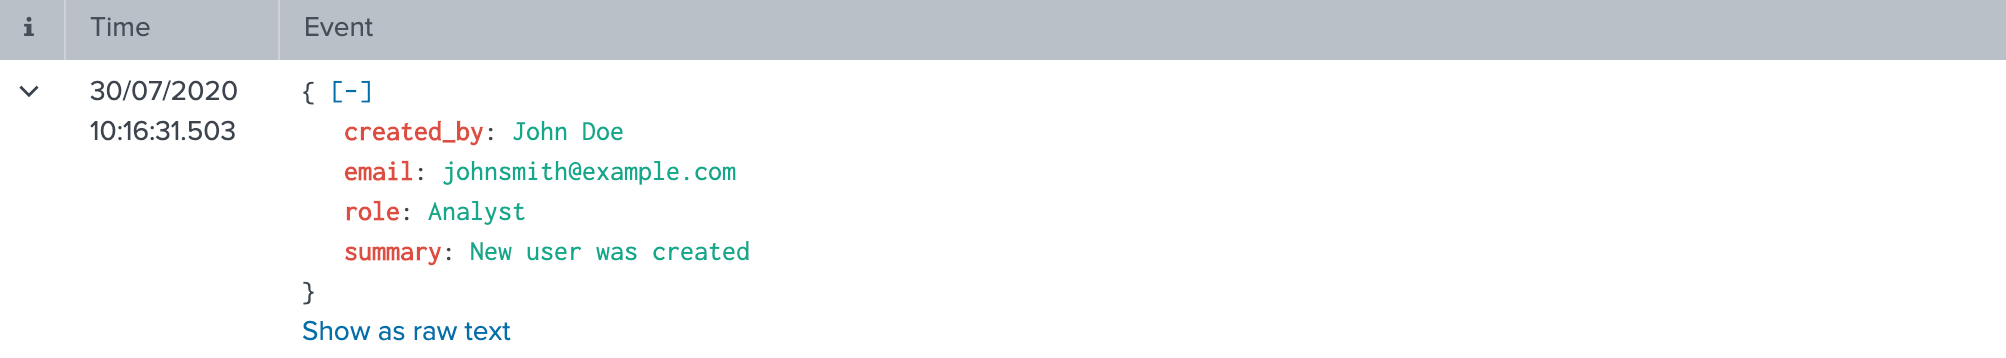
Fluentdはイベントを次のように記録します:

Splunkのイベントに以下のエントリが表示されます:
Splunk Enterpriseでイベントをダッシュボードに整理して表示する
To get Wallarm events organized into a ready-to-use dashboard in Splunk 9.0 or later, you can install the Wallarm application for Splunk.
This application provides you with a pre-configured dashboard that is automatically filled with the events received from Wallarm. In addition to that, the application enables you to proceed to detailed logs on each event and export the data from the dashboard.

To install the Wallarm application for Splunk:
-
In the Splunk UI ➝ Apps find the
Wallarm API Securityapplication. -
Click Install and input the Splunkbase credentials.
If some Wallarm events are already logged in Splunk, they will be displayed on the dashboard, as well as further events Wallarm will discover.
In addition, you can fully customize the ready-to-use dashboard, e.g. its view or search strings used to extract data from all Splunk records.