Splunk
Splunkは、ログ、イベント、その他の運用・業務データなどの機械生成データを検索、監視、分析するために設計されたプラットフォームです。Wallarmを設定してSplunkにアラートを送信できます。
インテグレーションの設定
Splunk UIで:
-
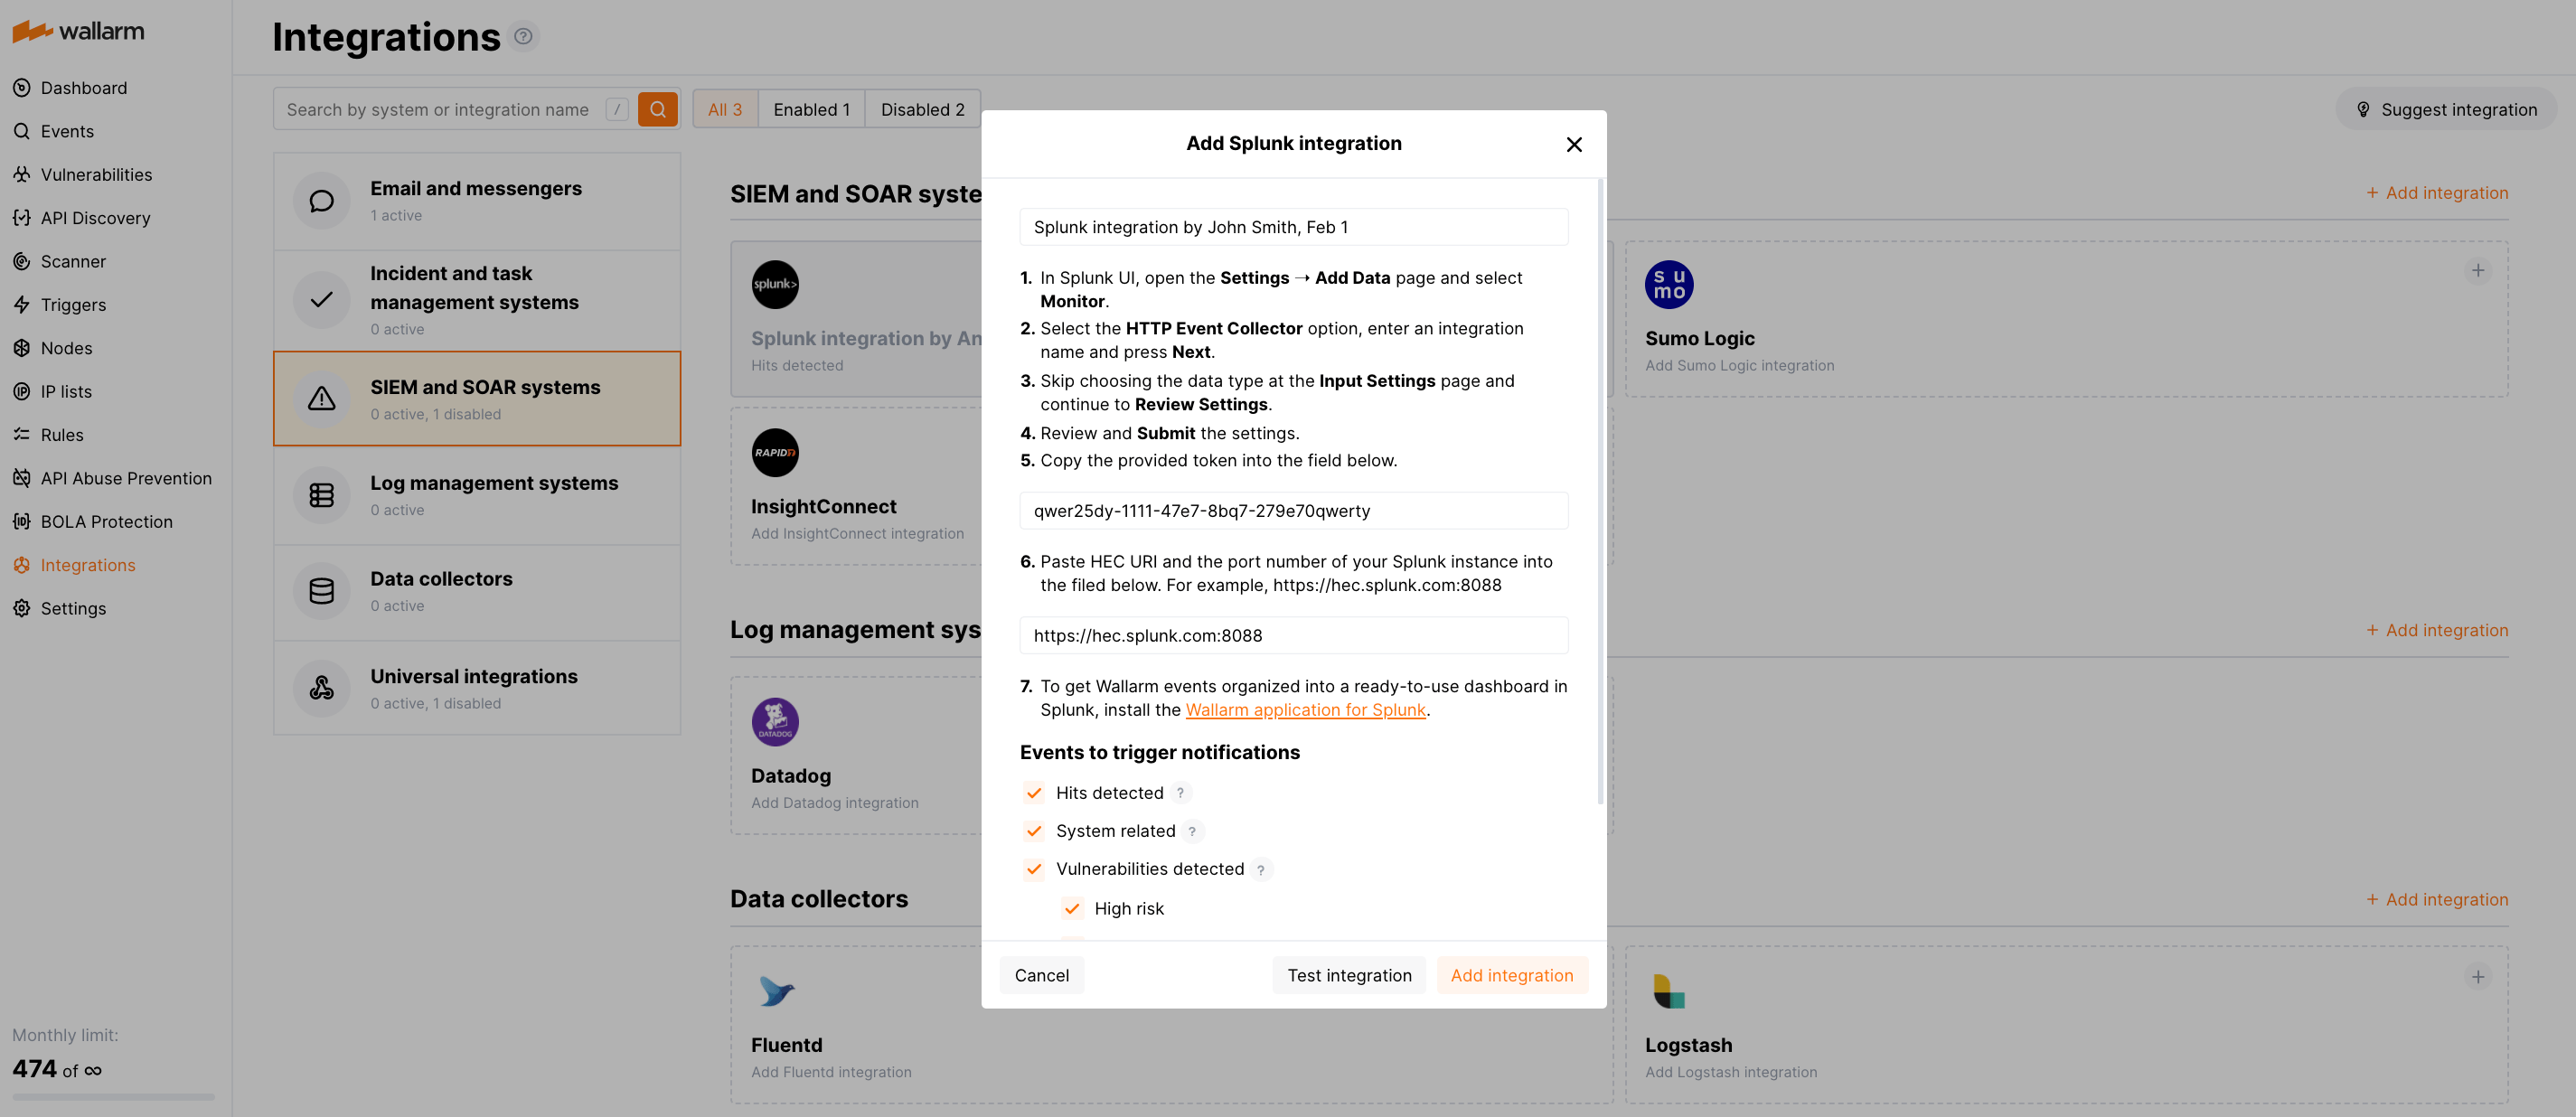
Settings ➝ Add Data ➝ Monitorを開きます。
-
HTTP Event Collectorオプションを選択し、インテグレーション名を入力してNextをクリックします。
-
Input Settingsページではデータタイプの選択をスキップし、Review Settingsへ進みます。
-
設定内容を確認してSubmitします。
-
表示されたトークンをコピーします。
Wallarm UIで:
-
Integrationsセクションを開きます。
-
Splunkブロックをクリックするか、Add integrationボタンをクリックしてSplunkを選択します。
-
インテグレーション名を入力します。
-
コピーしたトークンをHEC tokenフィールドに貼り付けます。
-
SplunkインスタンスのHEC URIとポート番号をHEC URI:PORTフィールドに貼り付けます。例えば:
https://hec.splunk.com:8088。 -
通知をトリガーするイベントタイプを選択します。
利用可能なイベントの詳細:
-
Hits detected except for:
- Experimental hits detected based on the custom regular expression. Non-experimental hits trigger notifications.
- Hits not saved in the sample.
Optionally include the
headersobject with hit headers in hit logs. If disabled, headers are not included in the logs. -
System related:
- User changes (newly created, deleted, role change)
- Integration changes (disabled, deleted)
- Application changes (newly created, deleted, name change)
- Errors during regular update of specifications used for rogue API detection or API specification enforcement
- Rules and triggers changed (creating, updating, or deleting the rule or trigger)
- Security issues detected by all methods, all or only for the selected risk levels:
- Critical risk
- High risk
- Medium risk
- Low risk
- Info risk
- On an hourly basis, you can get a notification with the number of requests processed during the previous hour
-
-
構成の正しさ、Wallarm Cloudへの接続可否、通知形式を確認するには、Test integrationをクリックします。
JSON形式のSplunk通知のテスト:
{ summary:"[Test message] [Test partner(US)] New vulnerability detected", description:"Notification type: vuln New vulnerability was detected in your system. ID: Title: Test Domain: example.com Path: Method: Discovered by: Parameter: Type: Info Threat: Medium More details: https://us1.my.wallarm.com/object/555 Client: TestCompany Cloud: US ", details:{ client_name:"TestCompany", cloud:"US", notification_type:"vuln", vuln_link:"https://us1.my.wallarm.com/object/555", vuln:{ domain:"example.com", id:null, method:null, parameter:null, path:null, title:"Test", discovered_by:null, threat:"Medium", type:"Info" } } } -
Add integrationをクリックします。
Wallarm Cloud IP addresses
To provide Wallarm Cloud access to your system, you may need a list of its public IP addresses:
追加アラートの設定
Besides the notifications you have already set up through the integration card, Wallarm triggers allow you to select additional events for notifications:
-
Number of attacks, hits or incidents per time interval (day, hour, etc.) exceeds the set number
What is not counted
- For attacks:
- The experimental attacks based on the custom regular expressions.
- For hits:
- The experimental hits based on the custom regular expressions.
- Hits not saved in the sample.
- For attacks:
-
Changes in API took place
-
IP address was denylisted
-
New rogue API (shadow, zombie) was detected
-
New user was added to the company account
For condition detailing, you can add one or more filters. As soon, as condition and filters are set, select the integration through which the selected alert should be sent. You can select several integrations simultaneously.

ダッシュボードにイベントを整理する
To get Wallarm events organized into a ready-to-use dashboard in Splunk 9.0 or later, you can install the Wallarm application for Splunk.
This application provides you with a pre-configured dashboard that is automatically filled with the events received from Wallarm. In addition to that, the application enables you to proceed to detailed logs on each event and export the data from the dashboard.

To install the Wallarm application for Splunk:
-
In the Splunk UI ➝ Apps find the
Wallarm API Securityapplication. -
Click Install and input the Splunkbase credentials.
If some Wallarm events are already logged in Splunk, they will be displayed on the dashboard, as well as further events Wallarm will discover.
In addition, you can fully customize the ready-to-use dashboard, e.g. its view or search strings used to extract data from all Splunk records.
インテグレーションの無効化と削除
You can delete or temporarily disable the integration. While deleting stops sending notificatioins and completely deletes all configuration, disabling just stops sending notifications which you can at any moment re-enable with the same settings.
If for the integration the System related events are selected to trigger notifications, Wallarm will notify about both of these actions.
システムの利用不可およびインテグレーションパラメータの誤り
Notifications to the system are sent via requests. If the system is unavailable or integration parameters are configured incorrectly, the error code is returned in the response to the request.
If the system responds to Wallarm request with any code other than 2xx, Wallarm resends the request with the interval until the 2xx code is received:
-
The first cycle intervals: 1, 3, 5, 10, 10 seconds
-
The second cycle intervals: 0, 1, 3, 5, 30 seconds
-
The third cycle intervals: 1, 1, 3, 5, 10, 30 minutes
If the percentage of unsuccessful requests reaches 60% in 12 hours, the integration is automatically disabled. If you receive system notifications, you will get a message about automatically disabled integration.