Fluentd
Fluentdは、汎用で軽量なデータ集約および転送メカニズムとして機能するオープンソースのデータ収集ソフトウェアです。Wallarm Consoleで適切な連携を作成することで、検出イベントの通知をFluentdに送信するようにWallarmを設定できます。
通知の形式
Wallarmはwebhooksを介してJSON形式の通知をFluentdに送信します。含まれるJSONオブジェクトは、Wallarmが通知するイベントによって異なります。
新しいヒット検出の通知例:
[
    {
        "summary": "[Wallarm] New hit detected",
        "details": {
        "client_name": "TestCompany",
        "cloud": "EU",
        "notification_type": "new_hits",
        "hit": {
            "domain": "www.example.com",
            "heur_distance": 0.01111,
            "method": "POST",
            "parameter": "SOME_value",
            "path": "/news/some_path",
            "payloads": [
                "say ni"
            ],
            "point": [
                "post"
            ],
            "probability": 0.01,
            "remote_country": "PL",
            "remote_port": 0,
            "remote_addr4": "8.8.8.8",
            "remote_addr6": "",
            "tor": "none",
            "request_time": 1603834606,
            "create_time": 1603834608,
            "response_len": 14,
            "response_status": 200,
            "response_time": 5,
            "stamps": [
                1111
            ],
            "regex": [],
            "stamps_hash": -22222,
            "regex_hash": -33333,
            "type": "sqli",
            "block_status": "monitored",
            "id": [
                "hits_production_999_202010_v_1",
                "c2dd33831a13be0d_AC9"
            ],
            "object_type": "hit",
            "anomaly": 0
            }
        }
    }
]
要件
Fluentdの構成は次の要件を満たす必要があります。
-
POSTまたはPUTリクエストを受け付けます
-
HTTPSリクエストを受け付けます
-
パブリックにアクセス可能なURLがあります
Fluentd構成例:
詳細は公式Fluentdドキュメントを参照してください。
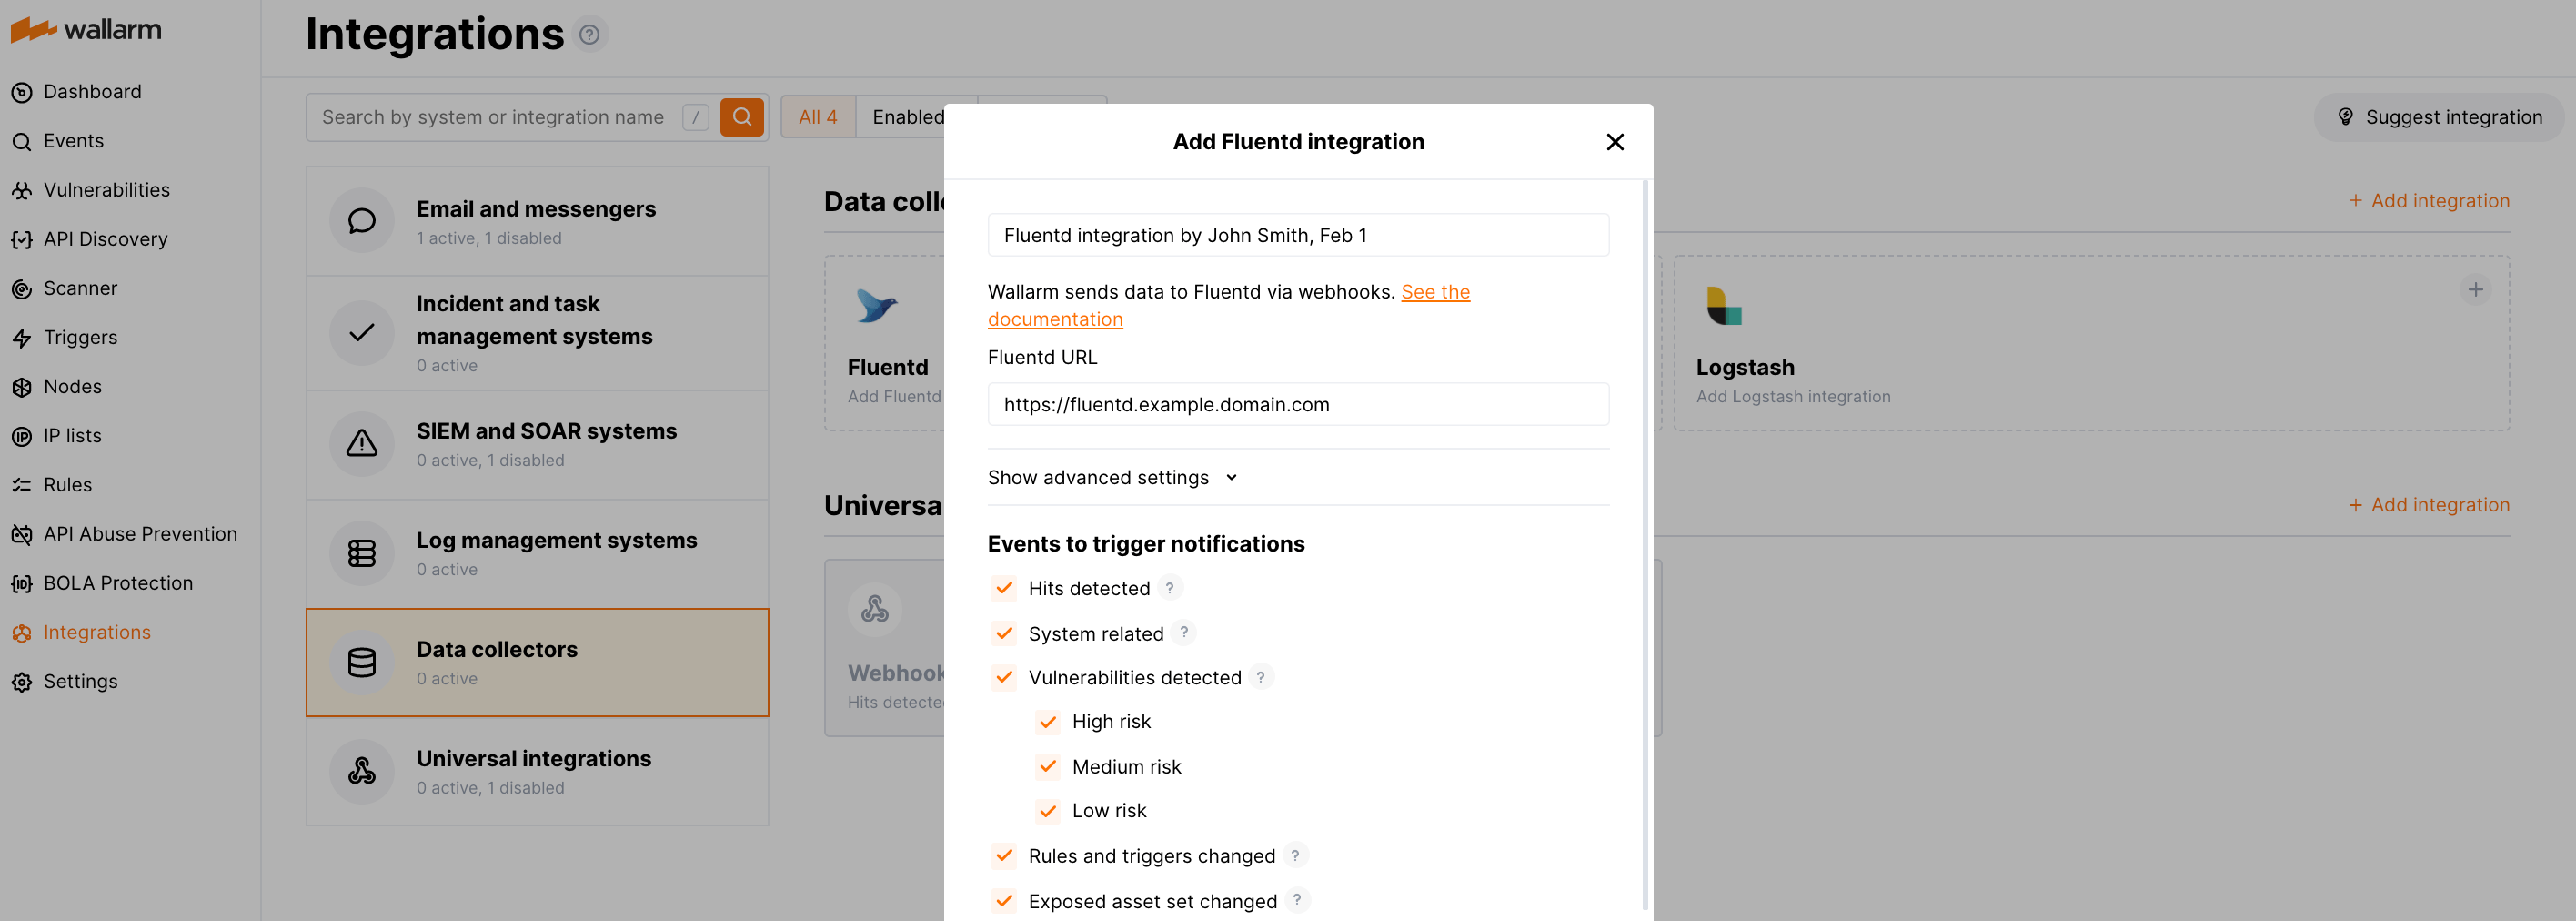
連携の設定
-
Wallarm Console→Integrations→FluentdでFluentd連携の設定に進みます。
-
連携名を入力します。
-
送信先FluentdのURL(Webhook URL)を指定します。
-
必要に応じて、詳細設定を構成します:
- Request method:
POSTorPUT. By default, POST requests are sent. - Request header and its value if the server requires a non-standard header to execute the request. The number of headers is not limited.
- CA certificate: certificate of CA that signed a server certificate. If CA is publicly trusted, this field is optional. If a server certificate is self-signed, this field is required and must contain a certificate of your own CA that signed a server certificate.
- Verify TLS certificate: this setting allows to disable verification of the specified server certificate. By default, Wallarm verifies whether a server certificate is signed by a publicly trusted CA. We do not recommend disabling the verification of production server certificates. If your server uses a self-signed TLS certificate, you can add a self-signed CA certificate to allow sending requests to this server.
- Request timeout, in seconds: if the server does not respond to the request within the specified time, the request fails. By default: 15 seconds.
- Connection timeout, in seconds: if the connection to the server cannot be established during the specified time, the request fails. By default: 20 seconds.
- Wallarm data format: either a JSON Array (default) or a New Line Delimited JSON (NDJSON).
- Request method:
-
通知をトリガーするイベント種別を選択します。
利用可能なイベントの詳細:
-
Hits detected except for:
- Experimental hits detected based on the custom regular expression. Non-experimental hits trigger notifications.
- Hits not saved in the sample.
Optionally include the
headersobject with hit headers in hit logs. If disabled, headers are not included in the logs. -
System related:
- User changes (newly created, deleted, role change)
- Integration changes (disabled, deleted)
- Application changes (newly created, deleted, name change)
- Errors during regular update of specifications used for rogue API detection or API specification enforcement
- Rules and triggers changed (creating, updating, or deleting the rule or trigger)
- Security issues detected by all methods, all or only for the selected risk levels:
- Critical risk
- High risk
- Medium risk
- Low risk
- Info risk
- On an hourly basis, you can get a notification with the number of requests processed during the previous hour
-
-
Test integrationをクリックして、構成が正しいこと、Wallarm Cloudの可用性、および通知の形式を確認します。
テスト用Fluentdログ:
[ { summary:"[Test message] [Test partner(US)] New vulnerability detected", description:"Notification type: vuln New vulnerability was detected in your system. ID: Title: Test Domain: example.com Path: Method: Discovered by: Parameter: Type: Info Threat: Medium More details: https://us1.my.wallarm.com/object/555 Client: TestCompany Cloud: US ", details:{ client_name:"TestCompany", cloud:"US", notification_type:"vuln", vuln_link:"https://us1.my.wallarm.com/object/555", vuln:{ domain:"example.com", id:null, method:null, parameter:null, path:null, title:"Test", discovered_by:null, threat:"Medium", type:"Info" } } } ] -
Add integrationをクリックします。
Wallarm Cloud IP addresses
To provide Wallarm Cloud access to your system, you may need a list of its public IP addresses:
追加アラートの設定
Besides the notifications you have already set up through the integration card, Wallarm triggers allow you to select additional events for notifications:
-
Number of attacks, hits or incidents per time interval (day, hour, etc.) exceeds the set number
What is not counted
- For attacks:
- The experimental attacks based on the custom regular expressions.
- For hits:
- The experimental hits based on the custom regular expressions.
- Hits not saved in the sample.
- For attacks:
-
Changes in API took place
-
IP address was denylisted
-
New rogue API (shadow, zombie) was detected
-
New user was added to the company account
For condition detailing, you can add one or more filters. As soon, as condition and filters are set, select the integration through which the selected alert should be sent. You can select several integrations simultaneously.

中間データコレクターとしてFluentdを使用する
The most common logging scheme in complex systems consists of the following components:
-
Data collector: accepts logs from several sources and forwards logs to the SIEM system
-
SIEM system or log management systems: used to analyze logs and monitor the system status
例:
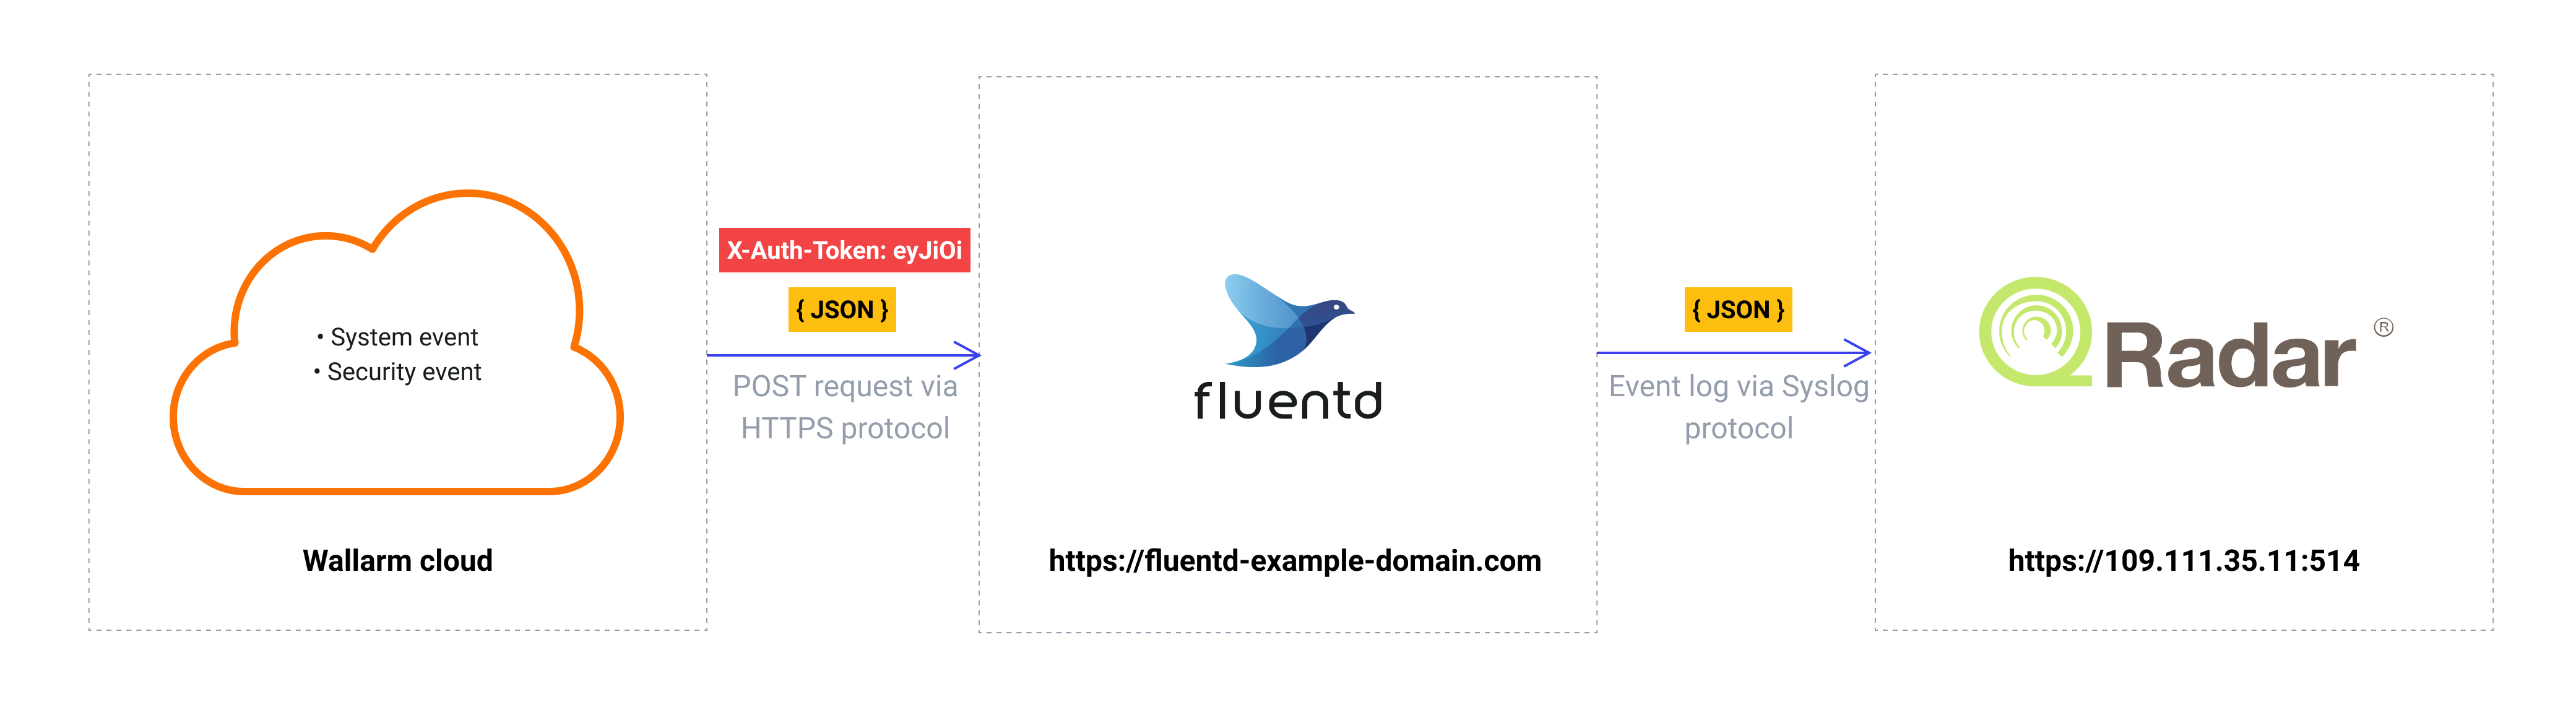
この方式でWallarmのイベントを記録するには:
-
データコレクターが受信webhookを読み取り、次のシステムにログを転送するように構成します。Wallarmはwebhookでデータコレクターにイベントを送信します。
-
SIEMシステムがデータコレクターからログを取得して読み取れるように構成します。
-
Wallarmがデータコレクターにログを送信するように構成します。
Wallarmはwebhook経由で任意のデータコレクターにログを送信できます。
WallarmをFluentdまたはLogstashと連携するには、Wallarm Console UIの対応するintegration cardsを使用できます。
その他のデータコレクターと連携するには、Wallarm Console UIのwebhook integration cardを使用できます。
SIEMシステムにログを転送する一般的なデータコレクターとの連携設定例をいくつか紹介します:
-
WallarmはDatadog API経由のDatadogとのネイティブ連携にも対応しています。ネイティブ連携では中間データコレクターは不要です。
連携の無効化と削除
You can delete or temporarily disable the integration. While deleting stops sending notificatioins and completely deletes all configuration, disabling just stops sending notifications which you can at any moment re-enable with the same settings.
If for the integration the System related events are selected to trigger notifications, Wallarm will notify about both of these actions.
システムの利用不可および連携パラメータの誤り
Notifications to the system are sent via requests. If the system is unavailable or integration parameters are configured incorrectly, the error code is returned in the response to the request.
If the system responds to Wallarm request with any code other than 2xx, Wallarm resends the request with the interval until the 2xx code is received:
-
The first cycle intervals: 1, 3, 5, 10, 10 seconds
-
The second cycle intervals: 0, 1, 3, 5, 30 seconds
-
The third cycle intervals: 1, 1, 3, 5, 10, 30 minutes
If the percentage of unsuccessful requests reaches 60% in 12 hours, the integration is automatically disabled. If you receive system notifications, you will get a message about automatically disabled integration.