インシデントの分析
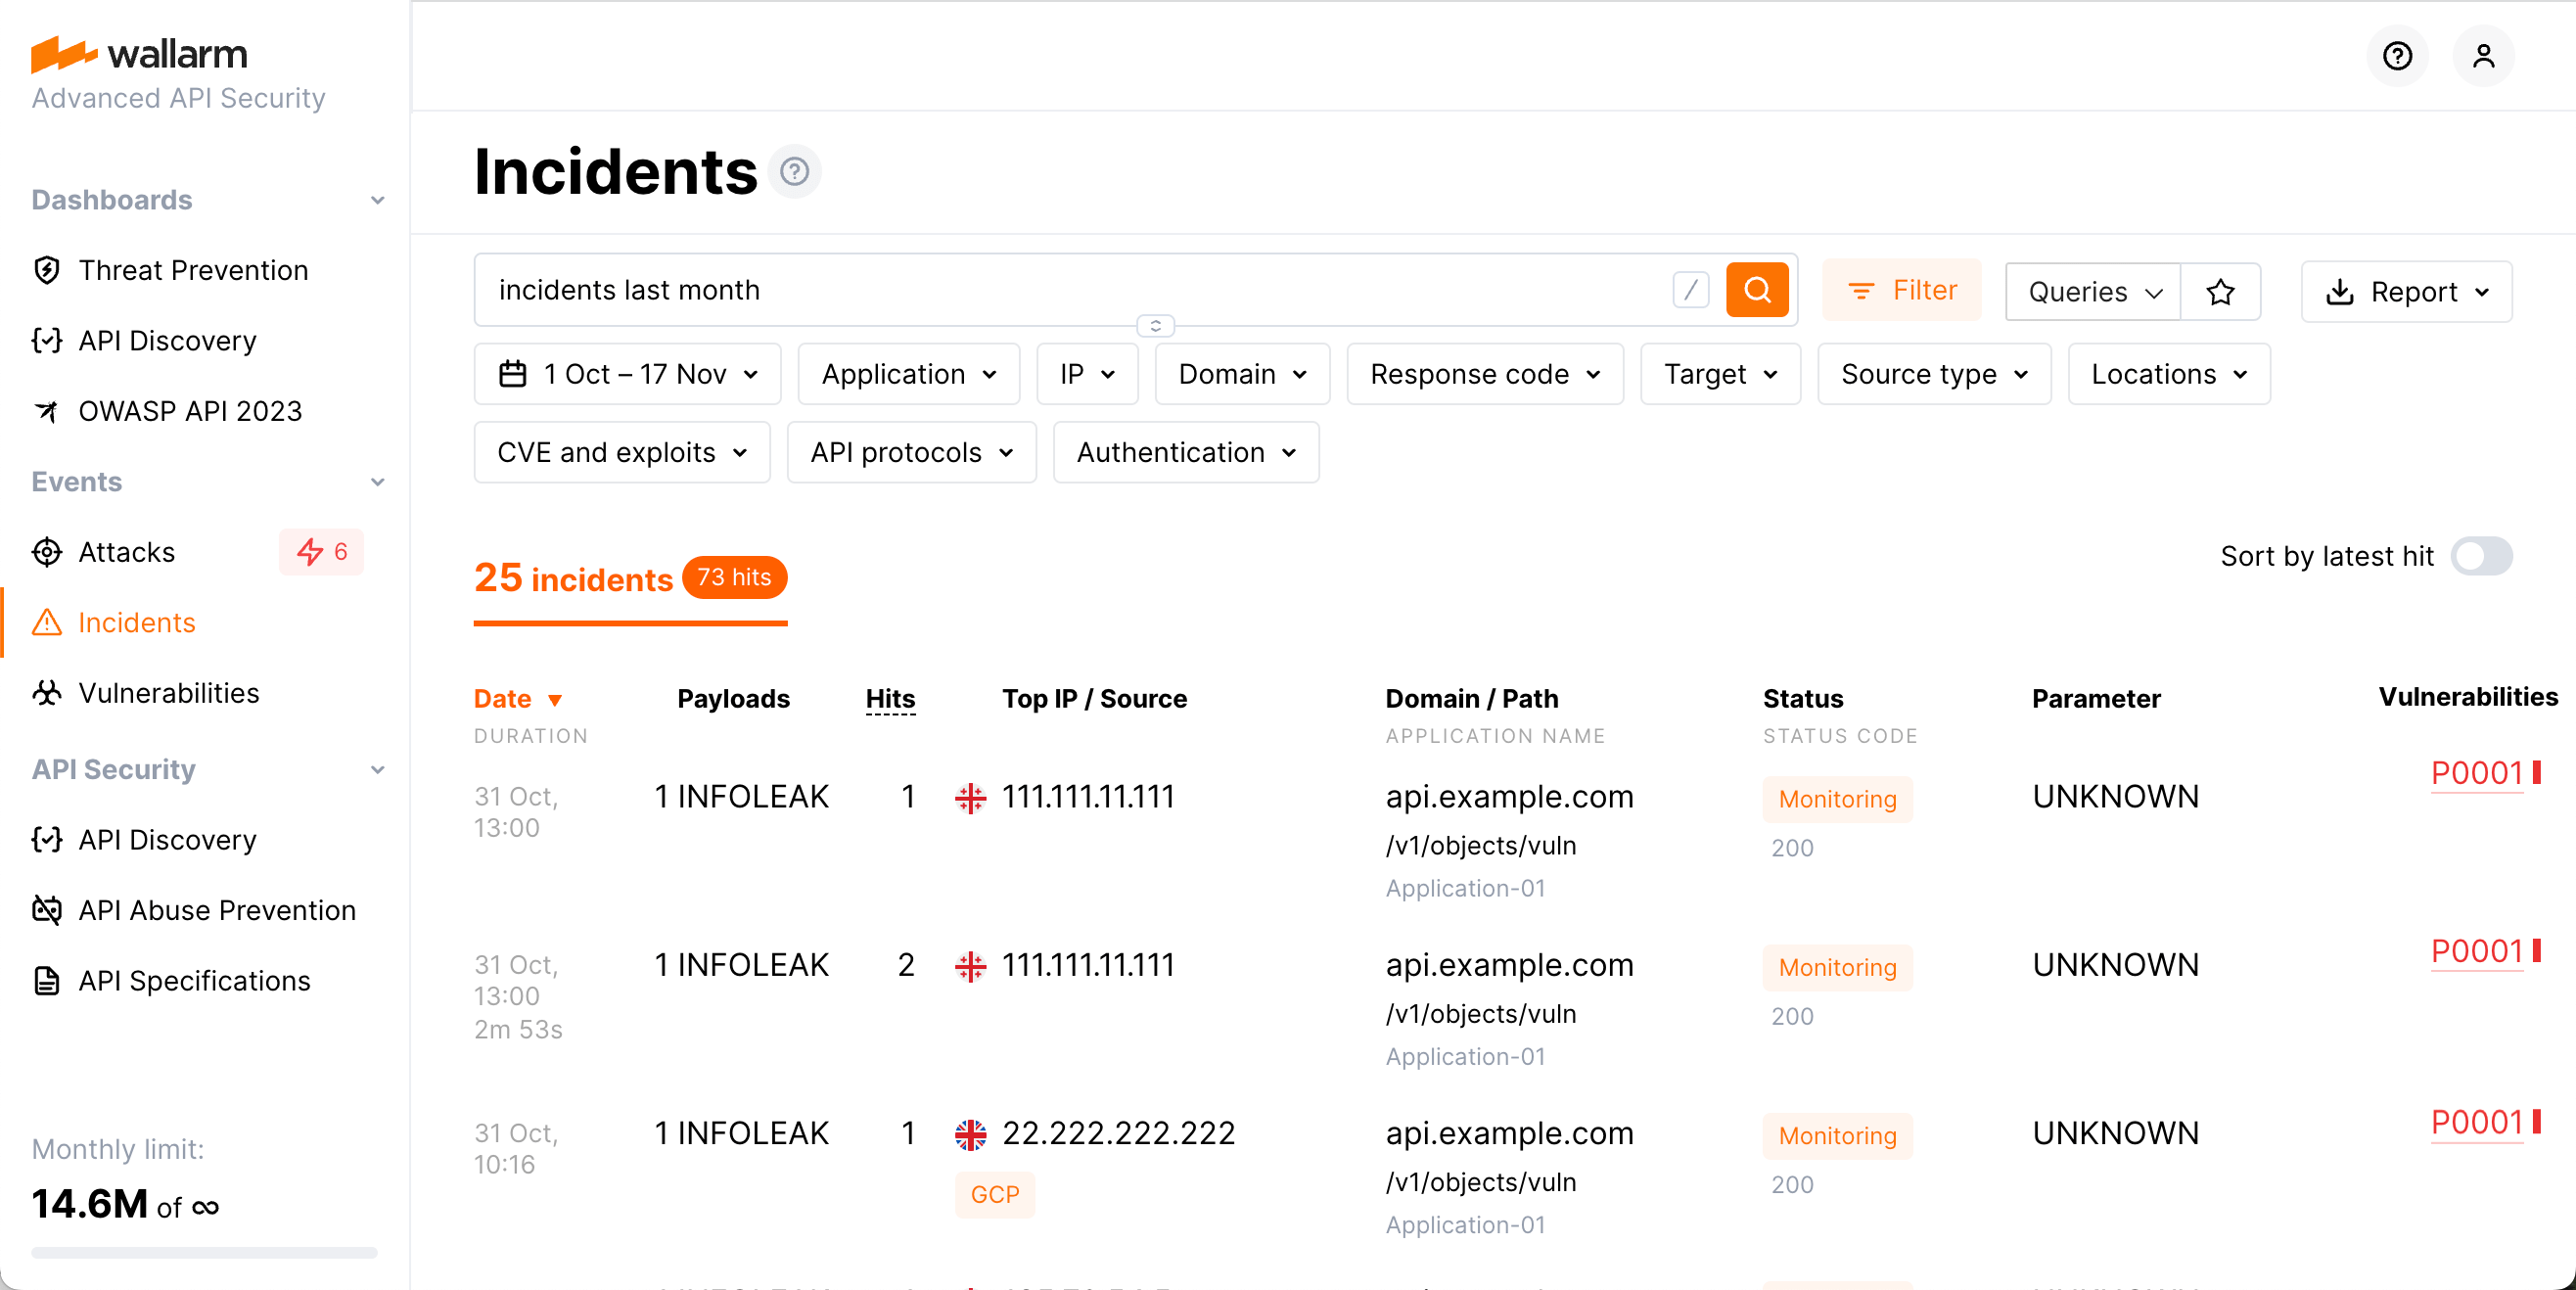
Wallarm Consoleでは、検出されたインシデントをIncidentsセクションで分析できます。必要なデータを見つけるには、こちらで説明している検索フィールドを使用するか、必要な検索フィルターを手動で設定してください。
インシデントの確認
-
Date: 悪意のあるリクエストの日時です。
- 同種のリクエストが短い間隔で複数検出された場合、日付の下に攻撃の継続時間が表示されます。継続時間とは、指定した期間内である種類の最初のリクエストから同じ種類の最後のリクエストまでの時間です。
- 攻撃が現在進行中の場合は、その旨のラベルが表示されます。
-
Payloads: 攻撃タイプと一意の悪意のあるペイロードの数です。
-
Hits: 指定の期間内に攻撃で発生したヒット数(リクエスト数)です。
-
Top IP / Source: 悪意のあるリクエストの送信元IPアドレスです。悪意のあるリクエストが複数のIPアドレスから発生している場合、インターフェイスには最も多くのリクエストを送信したIPアドレスが表示されます。IPアドレスについては次のデータも表示されます。
- 指定期間中に同一の攻撃でリクエストが発信されたIPアドレスの総数
- IPアドレスが登録されている国/地域(IP2Locationなどのデータベースで判明している場合)
- ソースの種類(例: Public proxy、Web proxy、Tor、またはIPが登録されているクラウドプラットフォームなど。IP2Locationなどのデータベースで判明している場合)
- 当該IPアドレスが悪意ある活動で知られている場合は、Malicious IPsラベルが表示されます。これは公開記録および専門家による検証に基づきます
-
Domain / Path: リクエストの宛先であるドメイン、パス、アプリケーションIDです。
-
Status: 攻撃のブロック状態(トラフィックフィルタリングモードに依存します):
- Blocked: 攻撃のすべてのHitsがフィルタリングノードによってブロックされました。
- Partially blocked: 一部のHitsはブロックされ、他は記録のみされました。
- Monitoring: 攻撃のすべてのHitsが記録されましたがブロックはされませんでした。
-
Parameter: 悪意のあるリクエストのパラメーターと、そのリクエストに適用されたパーサーのタグです。
-
Vulnerabilities: インシデントが悪用している脆弱性です。脆弱性をクリックすると、詳細な説明と修正方法が表示されます。
最後のリクエスト時刻でインシデントを並べ替えるには、Sort by latest hitスイッチを使用できます。
脅威アクターの活動の完全なコンテキスト
Once the malicious request is detected by Wallarm and displayed in the Attacks or Incidents section as the part of some attack, you have an ability to know the full context of this request: to which user session it belongs and what the full sequence of requests in this session is. This allows investigating all activity of the threat actor to understand attack vectors and what resources can be compromised.
To perform this analysis, in Wallarm Console → Attacks or Incidents, access the attack, and then specific request details. In request details, click Explore in API Sessions. Wallarm will open the API Session section filtered: the session, the initial request belongs to is displayed, only the initial request is displayed within this session.
Remove the filter by request ID to see all other requests in the session: now you have the full picture of what was going on within the session the malicious request belongs to.
インシデントへの対応
インシデントは、確認済みの脆弱性を標的とした攻撃です。
Incidentsセクションにインシデントが表示されたら:
-
任意ですが(推奨)、インシデントの悪意のあるリクエストの完全なコンテキストを調査し、それらがどのユーザーセッションに属するのか、このセッション内のリクエストの完全なシーケンスが何かを確認してください。
これにより、脅威アクターの全アクティビティとロジックが把握でき、攻撃ベクターと侵害され得るリソースを理解できます。
-
Vulnerabilities列のリンクをたどり、修正手順や関連インシデント一覧を含む詳細な脆弱性情報を確認してください。
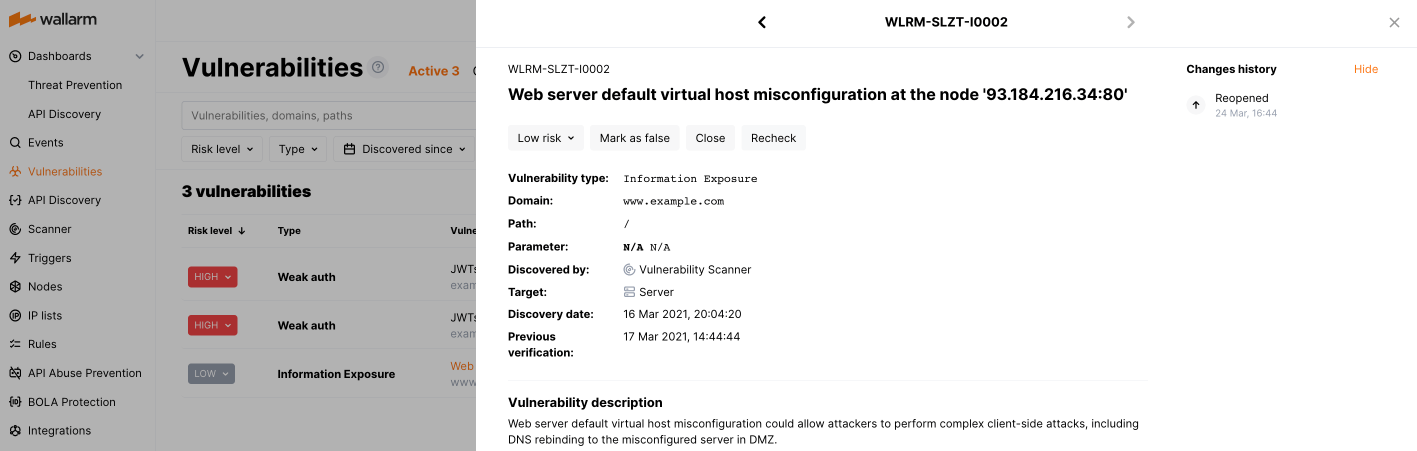
脆弱性を修正し、その後Wallarmでクローズとしてマークしてください。詳細は脆弱性の管理を参照してください。
-
一覧のインシデントに戻り、どのメカニズムがシステムの反応を引き起こしたのか(攻撃のステータスである
Blocked、Partially blocked、Monitoringに留意してください)、今後同様のリクエストに対してシステムがどのように動作するのか、必要に応じてその将来の動作をどのように調整するかを調査してください。インシデントについても、これらの調査と調整は他の攻撃と同様の方法で実施します。
インシデントを取得するためのAPI呼び出し
インシデントの詳細を取得するには、Wallarm ConsoleのUIに加えてWallarm APIを直接呼び出すこともできます。以下は、過去24時間に検出された最初の50件のインシデントを取得するAPI呼び出し例です。
このリクエストは攻撃一覧に使用するものと同様ですが、インシデントを要求するために"!vulnid": nullという条件を追加します。この条件によりAPIは脆弱性IDが指定されていないすべての攻撃を無視し、これによってシステムは攻撃とインシデントを区別します。
TIMESTAMPは、24時間前の日付をUnix Timestamp形式に変換した値に置き換えてください。
curl -v -X POST "https://us1.api.wallarm.com/v1/objects/attack" -H "X-WallarmApi-Token: <YOUR_TOKEN>" -H "accept: application/json" -H "Content-Type: application/json" -d "{ \"filter\": { \"clientid\": [YOUR_CLIENT_ID], \"\!vulnid\": null, \"time\": [[TIMESTAMP, null]] }, \"offset\": 0, \"limit\": 50, \"order_by\": \"last_time\", \"order_desc\": true}"
curl -v -X POST "https://api.wallarm.com/v1/objects/attack" -H "X-WallarmApi-Token: <YOUR_TOKEN>" -H "accept: application/json" -H "Content-Type: application/json" -d "{ \"filter\": { \"clientid\": [YOUR_CLIENT_ID], \"\!vulnid\": null, \"time\": [[TIMESTAMP, null]] }, \"offset\": 0, \"limit\": 50, \"order_by\": \"last_time\", \"order_desc\": true}"