Telemetry Portal for Security Edge Inline  
The telemetry portal for Security Edge Inline provides Grafana dashboards with real-time insights into metrics on traffic processed by Wallarm.
Available dashboards
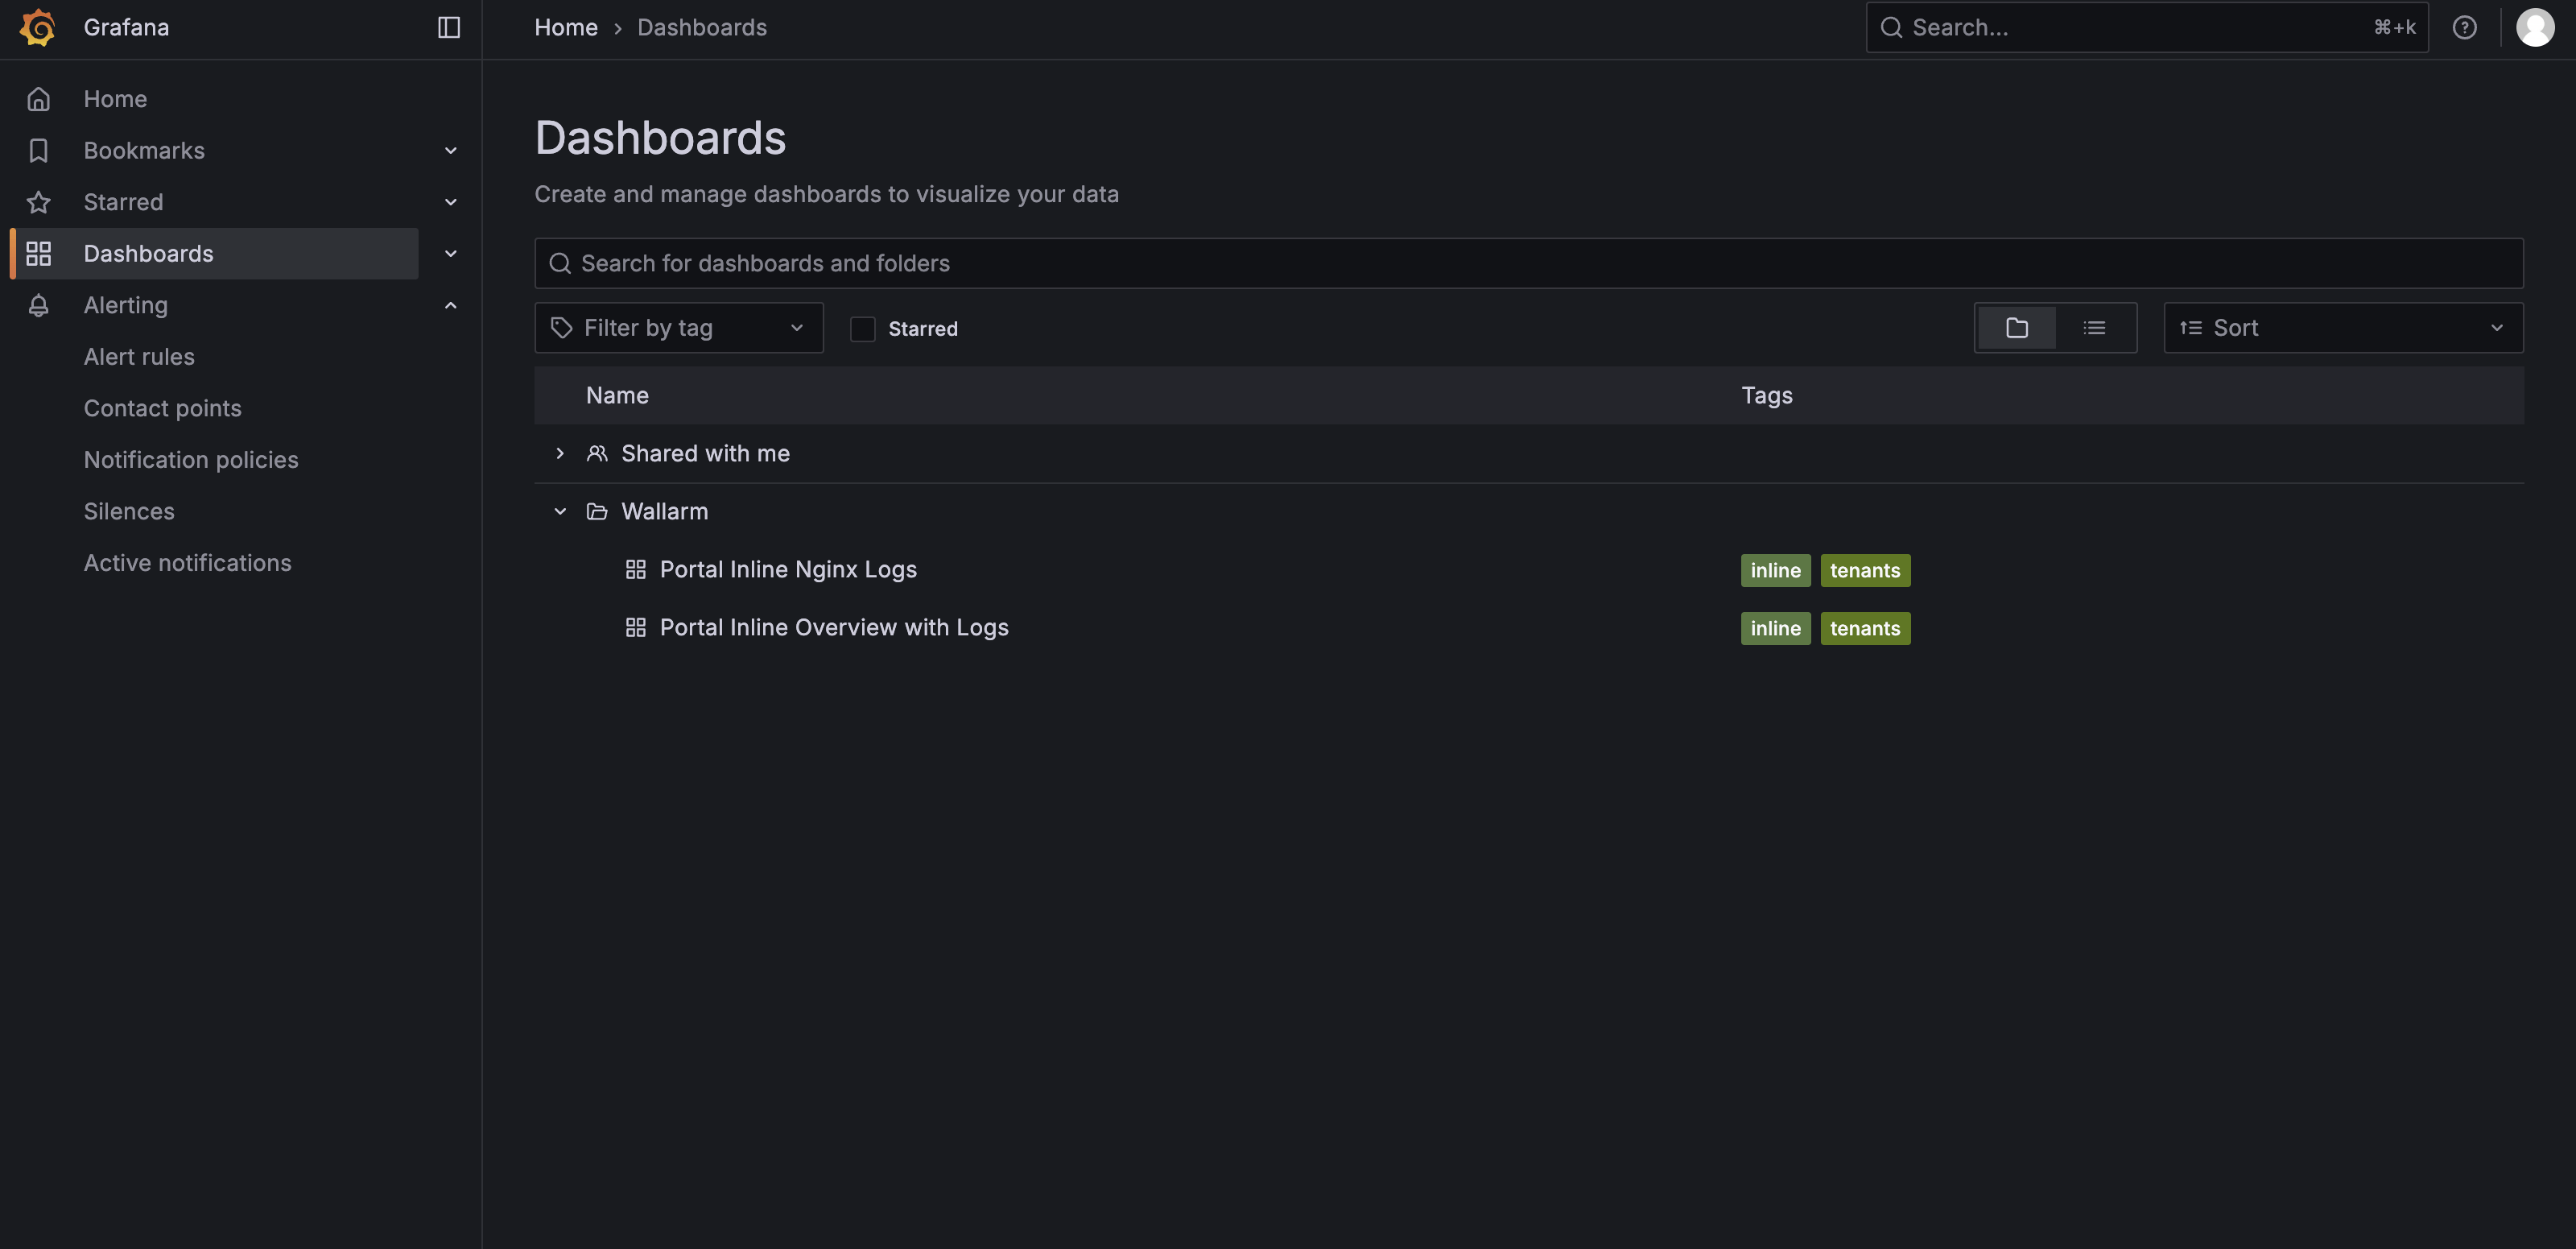
The telemetry portal includes two dashboards:
-
You can use this dashboard to inspect recent NGINX error and access logs, which helps with troubleshooting server issues and monitoring incoming requests.
-
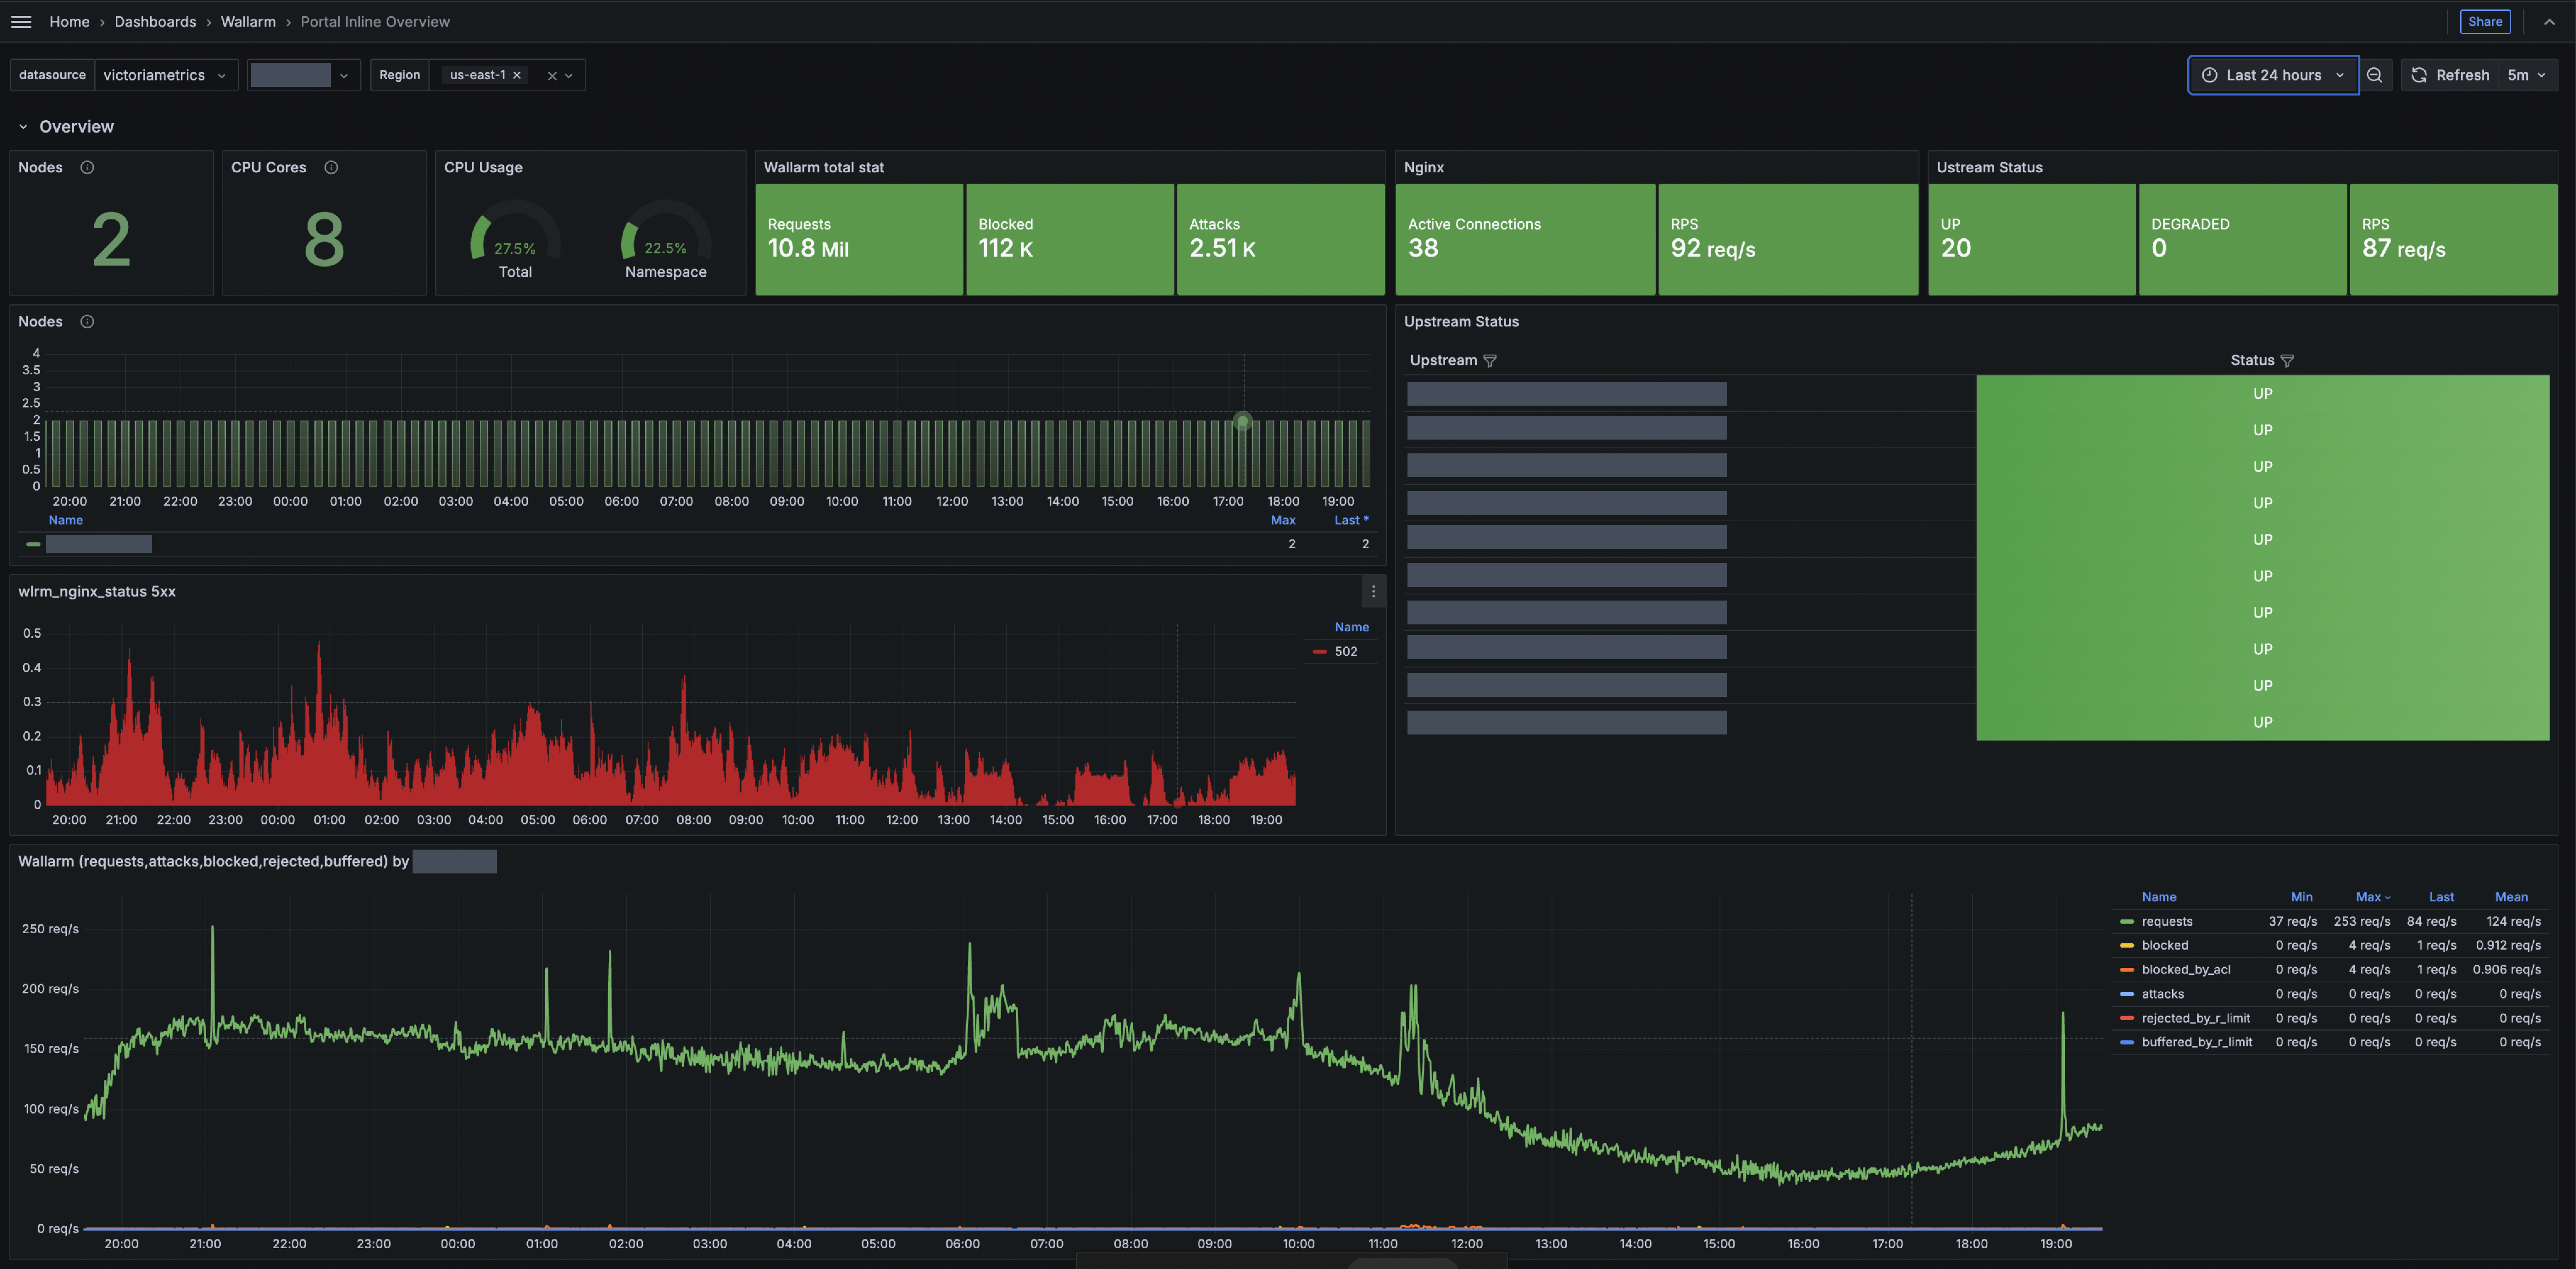
Portal Inline Overview with Logs
You can use this dashboard to view key metrics such as total processed requests, requests per second (RPS), detected and blocked attacks, number of deployed Edge Nodes, resource consumption, number of 5xx responses, etc.
The dashboards use standard Grafana features like sharing, filtering, and exporting.
View-only permissions
These dashboards are presented in view-only mode. In this mode, you cannot rearrange panels or edit the layout.
Running telemetry portal
Run telemetry portal once the Node reaches the Active status. It becomes accessible via a direct link from the Security Edge section about 5 minutes after starting.
From the Grafana home page, to reach the dashboard, navigate to Dashboards → Wallarm.


