Interpreting the testing results
This chapter will provide you with an overview of test result interpreting tools on the My Wallarm portal. Upon completion of this chapter, you will have obtained some additional information about the XSS vulnerability discovered in the previous chapter.
-
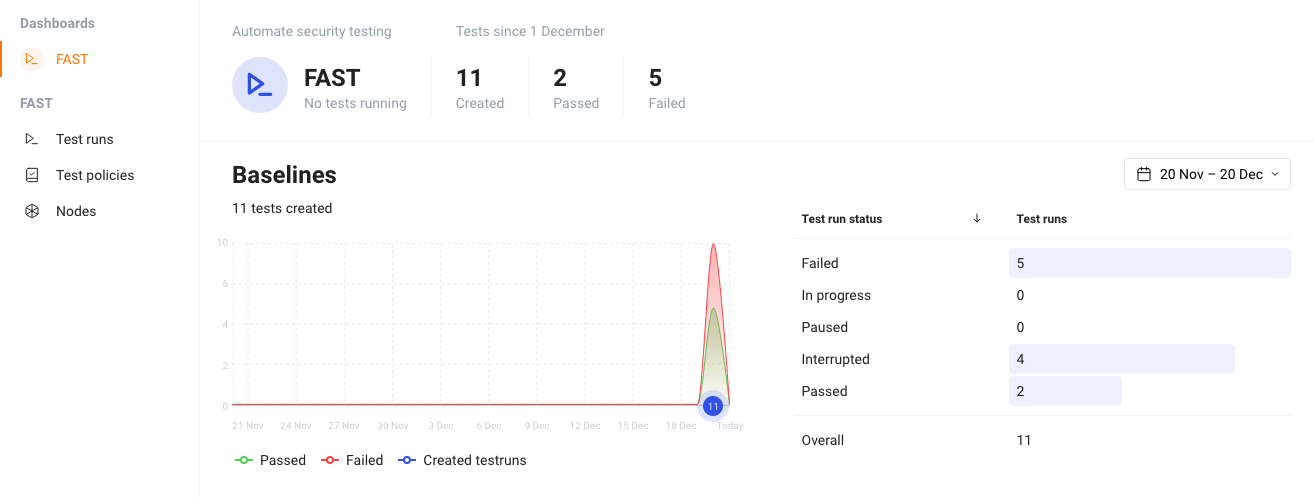
Click the "Dashboards → FAST" tab to have a quick look at what is going on. The dashboard provides you with a summary of all the test runs and their statuses, along with vulnerability counts for a chosen period of time.
-
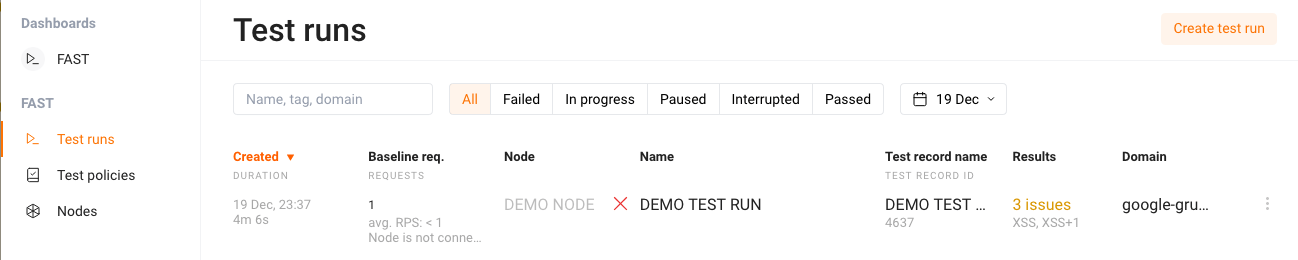
If you select the “Test runs” tab, you can observe the list of all the test runs along with some brief information about each of them, such as:
- Test run status (in progress, successful, or failed)
- If a baseline request recording is in progress
- How many baseline requests were recorded
- What vulnerabilities were found (if any)
- The domain name of the target application
- Where the test generation and execution process took place (node or cloud)
-
Explore a test run in detail by clicking on it:
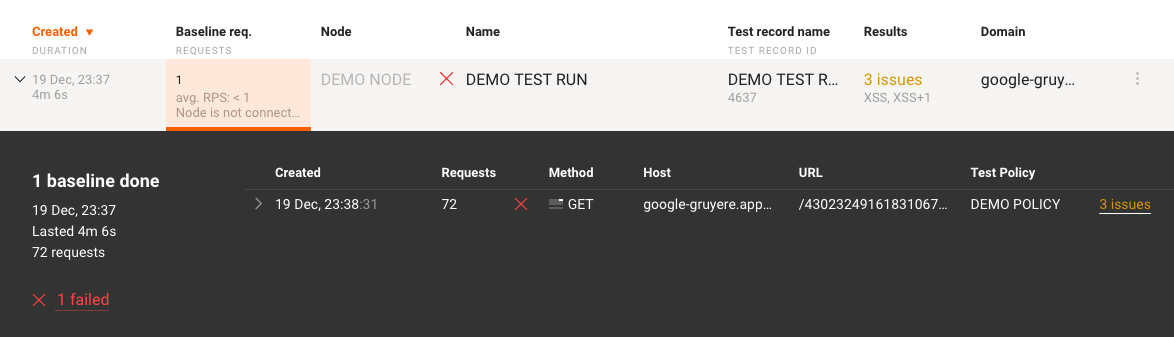
You can obtain the following information from an expanded test run:
- The number of processed baseline requests
- The test run creation date
- The test run duration
- The number of requests that were sent to the target application
-
The status of the baseline requests testing process:
-
Passed

No vulnerabilities were found for the given baseline request (it depends on the chosen test policy- if you choose another one, then some vulnerabilities might be found) or the test policy is not applicable to the request.
-
Failed

Vulnerabilities were found for the given baseline request.
-
In progress

The baseline request is being tested for vulnerabilities.
-
Error

The testing process was stopped due to errors.
-
Waiting

The baseline request is queued for testing. Only a limited number of requests can be tested simultaneously.
-
Interrupted

The testing process was either interrupted manually («Actions» → «Interrupt») or another test run was executed on the same FAST node.
-
-
To explore a baseline request in detail, click on it:
For each individual baseline request the following information is provided:
- Creation time
- The number of test requests that were generated and sent to the target application
- The test policy in use
- The request processing status
-
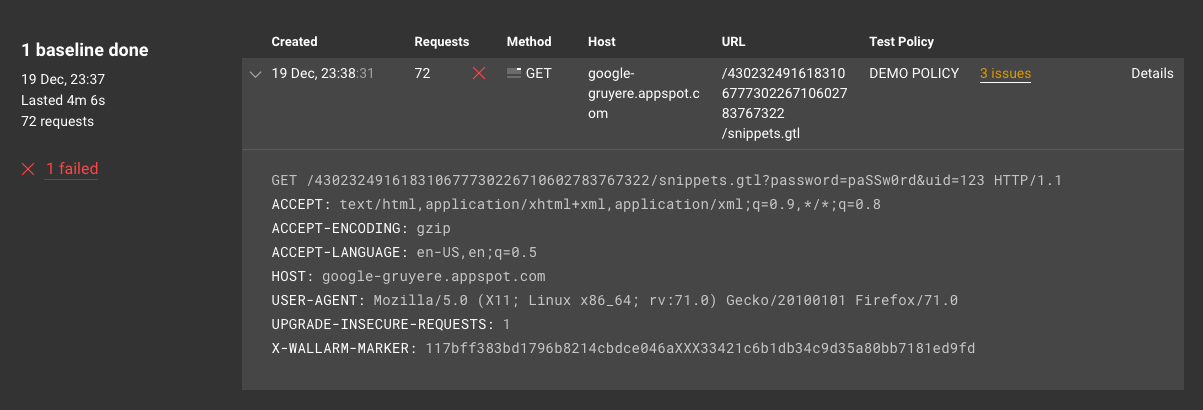
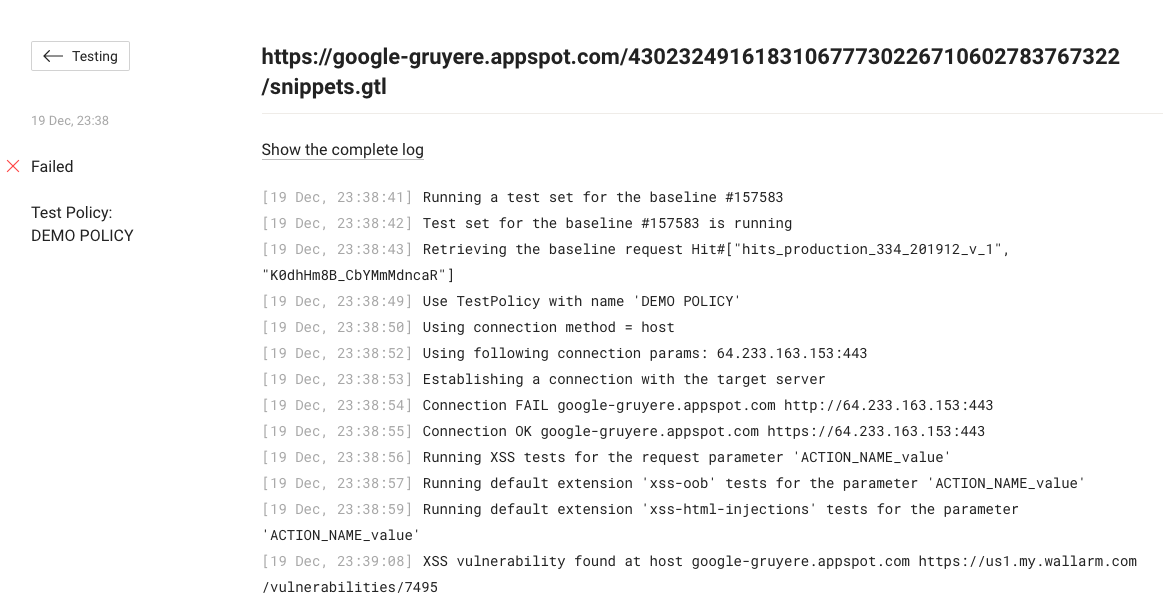
To view the full log of the request processing, select the “Details” link on the very right:
-
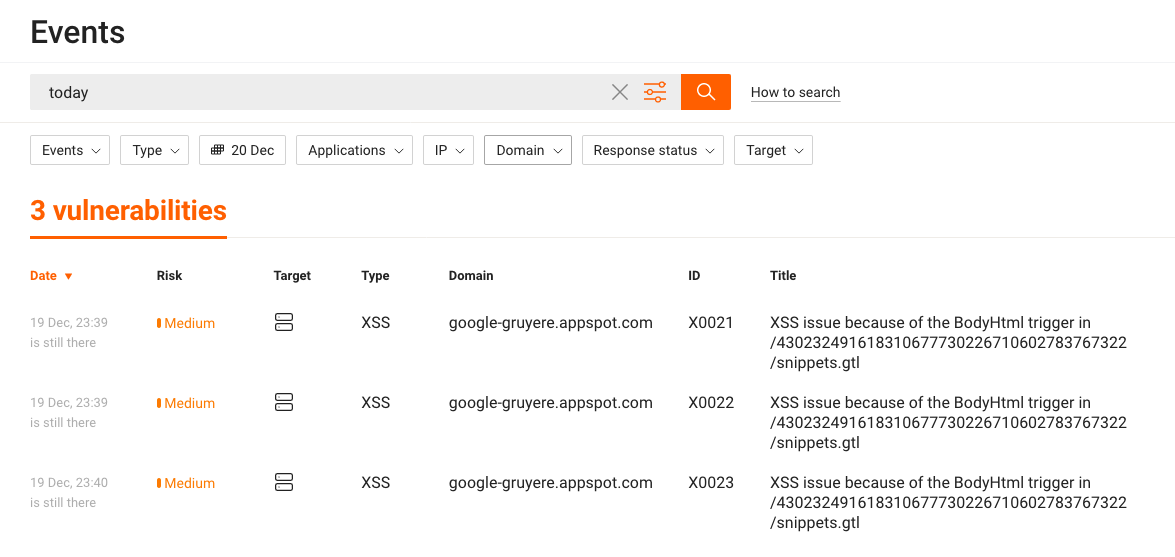
To obtain an overview of vulnerabilities found, click on the “Issue” link:
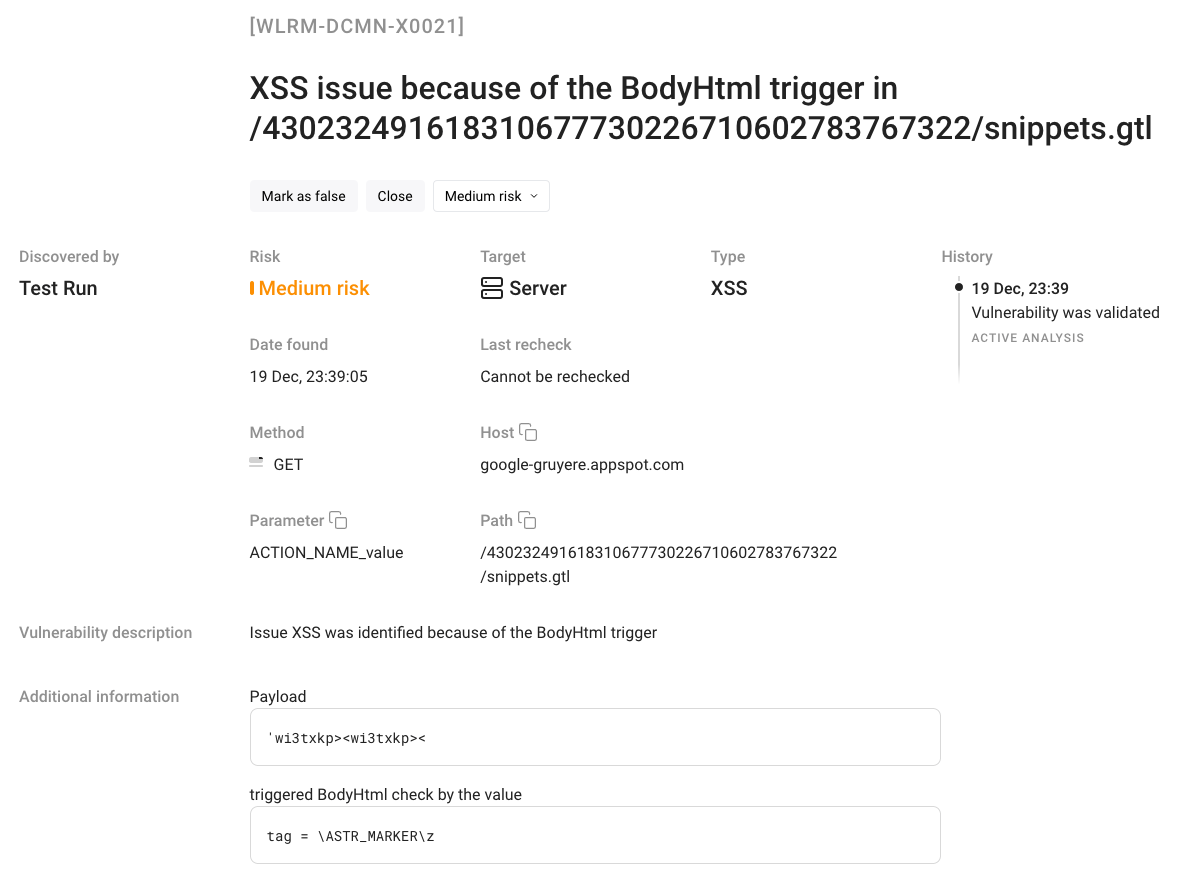
To explore a vulnerability in detail, click on the vulnerability description:
Now, you should be familiar with the tools that help you to interpret the testing results.