Attack Detection and Blocking Troubleshooting
Attacks are not displayed
If you suspect that attacks from the traffic are not uploaded to the Wallarm Cloud and, as a result, do not appear in the Wallarm Console UI, use this article to debug the issue.
To debug the problem, sequentially perform the following steps:
-
Generate some malicious traffic to perform further debugging.
-
Check the filtering node operation mode.
-
Capture logs and share them with the Wallarm support team.
Generate some malicious traffic
To perform further debugging of the Wallarm modules:
-
Send the following malicious traffic:
for i in `seq 100`; do curl "http://<FILTERING_NODE_IP>/?wallarm_test_xxxx=union+select+$i"; sleep 1; doneReplace
<FILTERING_NODE_IP>with a filtering node IP you want to check. If required, add theHost:header to the command. -
Wait up to 2 minutes for the attacks to appear in Wallarm Console → Attacks. If all 100 requests appear, the filtering node operates OK.
-
Connect to the server with the installed filtering node and get node metrics:
Further, we will refer to the
wallarm-statusoutput.
Check the filtering node operation mode
Check the filtering node operation mode as follows:
-
Make sure that the filtering node mode is different from
off. The node does not process incoming traffic in theoffmode.The
offmode is a common reason for thewallarm-statusmetrics not to increase. -
If the node is NGINX-based, restart NGINX to be sure that settings have been applied:
-
Generate malicious traffic once again to be sure that attacks are still not uploaded to the Cloud.
Capture logs and share them with the Wallarm support team
If the steps above do not help to resolve the issue, please capture the node logs and share them with the Wallarm support team as follows:
-
Connect to the server with the installed Wallarm node.
-
Get the
wallarm-statusoutput as follows:Copy an output.
-
Run the Wallarm diagnostic script:
Get the generated file with logs.
-
Send all collected data to the Wallarm support team for further investigation.
Filtering node RPS and APS values are not exported to Cloud
If filtering node information about RPS (requests per second) and APS (attacks per second) are not exported to Wallarm cloud, the possible reason is SELinux.
SELinux is installed and enabled by default on RedHat‑based Linux distributions (e.g., CentOS or Amazon Linux 2.0.2021x and lower). SELinux can also be installed on other Linux distributions, such as Debian or Ubuntu.
Check SELinux presence and status by executing the following command:
If the SELinux mechanism is enabled on a host with a filtering node, during node installation or upgrade, the all-in-one installer performs its automatic configuration for the node not to interfere with it.
If after automatic configuration you still experience the problems that can be caused by SeLinux, do the following:
-
Temporarily disable SELinux by executing the
setenforce 0command.SELinux will be disabled until the next reboot.
-
Check whether the problem(s) disappeared.
-
Contact Wallarm's technical support for help.
SELinux permanent disabling not recommended
It is not recommended to disable SELinux permanently due to the security issues.
Filtering node does not block attacks when operating in blocking mode (wallarm_mode block)
Using the wallarm_mode directive is only one of several methods of traffic filtration mode configuration. Some of these configuration methods have a higher priority than the wallarm_mode directive value.
If you have configured blocking mode via wallarm_mode block but Wallarm filtering node does not block attacks, please ensure that filtration mode is not overridden using other configuration methods:
-
Using the rule Set filtration mode
More details on filtration mode configuration methods →
User gets blocking page after legitimate request
If your user reports a legitimate request being blocked despite the Wallarm measures, you can review and evaluate their requests as this articles explains.
To resolve the issue of a legitimate request being blocked by Wallarm, follow these steps:
-
Request the user to provide as text (not screenshot) the information related to the blocked request, which is one of the following:
-
Information provided by the Wallarm blocking page if it is configured (may include user’s IP address, request UUID and other pre-configured elements).
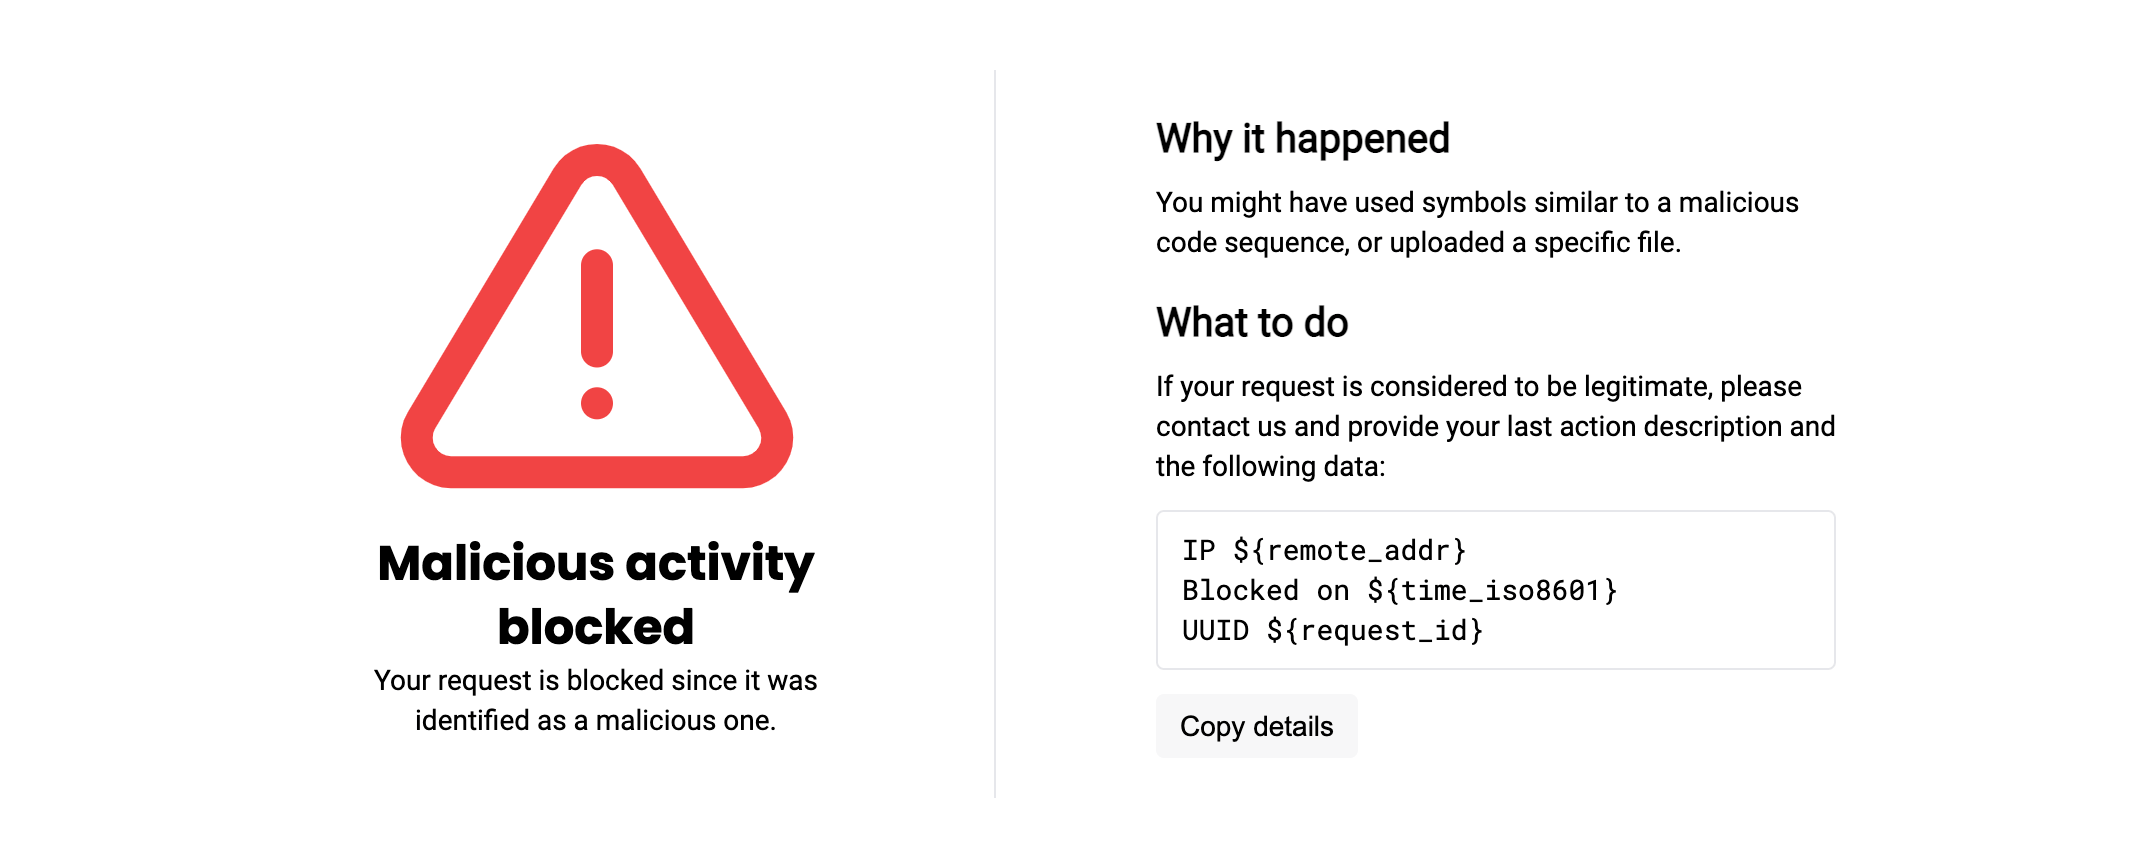
Blocking page usage
If you do not use the default or customized Wallarm blocking page, it is highly recommended to configure it to get the appropriate info from user. Remember that even a sample page collects and allows easy copying of meaningful information related to the blocked request. Additionally, you can customize or fully rebuild such page to return users the informative blocking message.
-
Copy of user's client request and response. Browser page source code or terminal client textual input and output suits well.
-
-
In Wallarm Console → Attacks or Incidents section, search for the event related to the blocked request. For example, search by request ID:
-
Examine the event to determine if it indicates a wrong or legitimate blocking.
-
If it is a wrong blocking, solve the issue by applying one or a combination of measures:
- Measures against false positives
- Re-configuring rules
- Re-configuring triggers
- Modifying IP lists
-
If the information initially provided by the user is incomplete or you are not sure about measures that can be safely applied, share the details with Wallarm support for further assistance and investigation.