Splunk Enterprise عبر Logstash
توفر لك هذه التعليمات مثالاً على دمج Wallarm مع جامع البيانات Logstash لإعادة توجيه الأحداث إلى نظام Splunk SIEM.
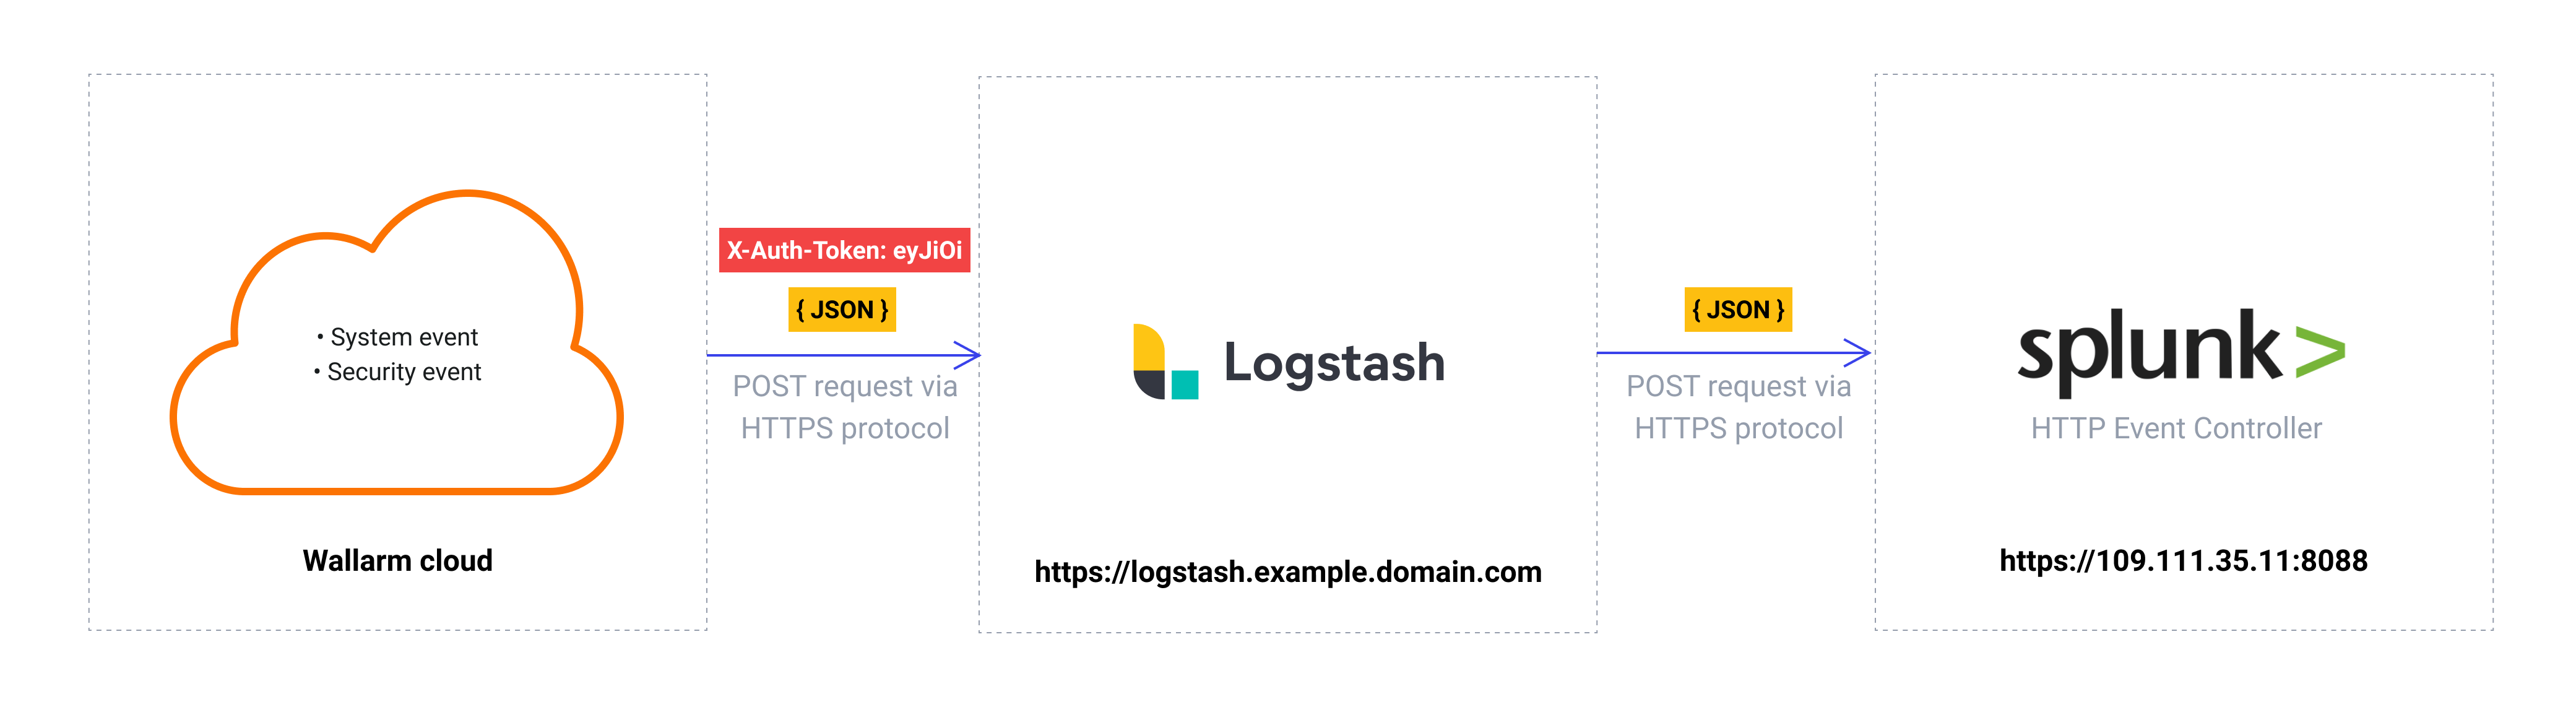
The most common logging scheme in complex systems consists of the following components:
-
Data collector: accepts logs from several sources and forwards logs to the SIEM system
-
SIEM system or log management systems: used to analyze logs and monitor the system status
الموارد المستخدمة
-
Splunk Enterprise مع WEB URL
https://109.111.35.11:8000و API URLhttps://109.111.35.11:8088 -
Logstash 7.7.0 مُثبت على Debian 11.x (bullseye) ومتاح على
https://logstash.example.domain.com -
الوصول بصلاحيات المدير إلى وحدة تحكم Wallarm في السحابة الأوروبية لتكوين دمج Logstash
Wallarm Cloud IP addresses
To provide Wallarm Cloud access to your system, you may need a list of its public IP addresses:
نظرًا لكون الروابط المشار إليها لخدمات Splunk Enterprise وLogstash مثالية، فهي لا تستجيب.
تكوين Splunk Enterprise
يتم إرسال سجلات Logstash إلى Splunk HTTP Event Controller بالاسم Wallarm Logstash logs وإعدادات افتراضية أخرى:
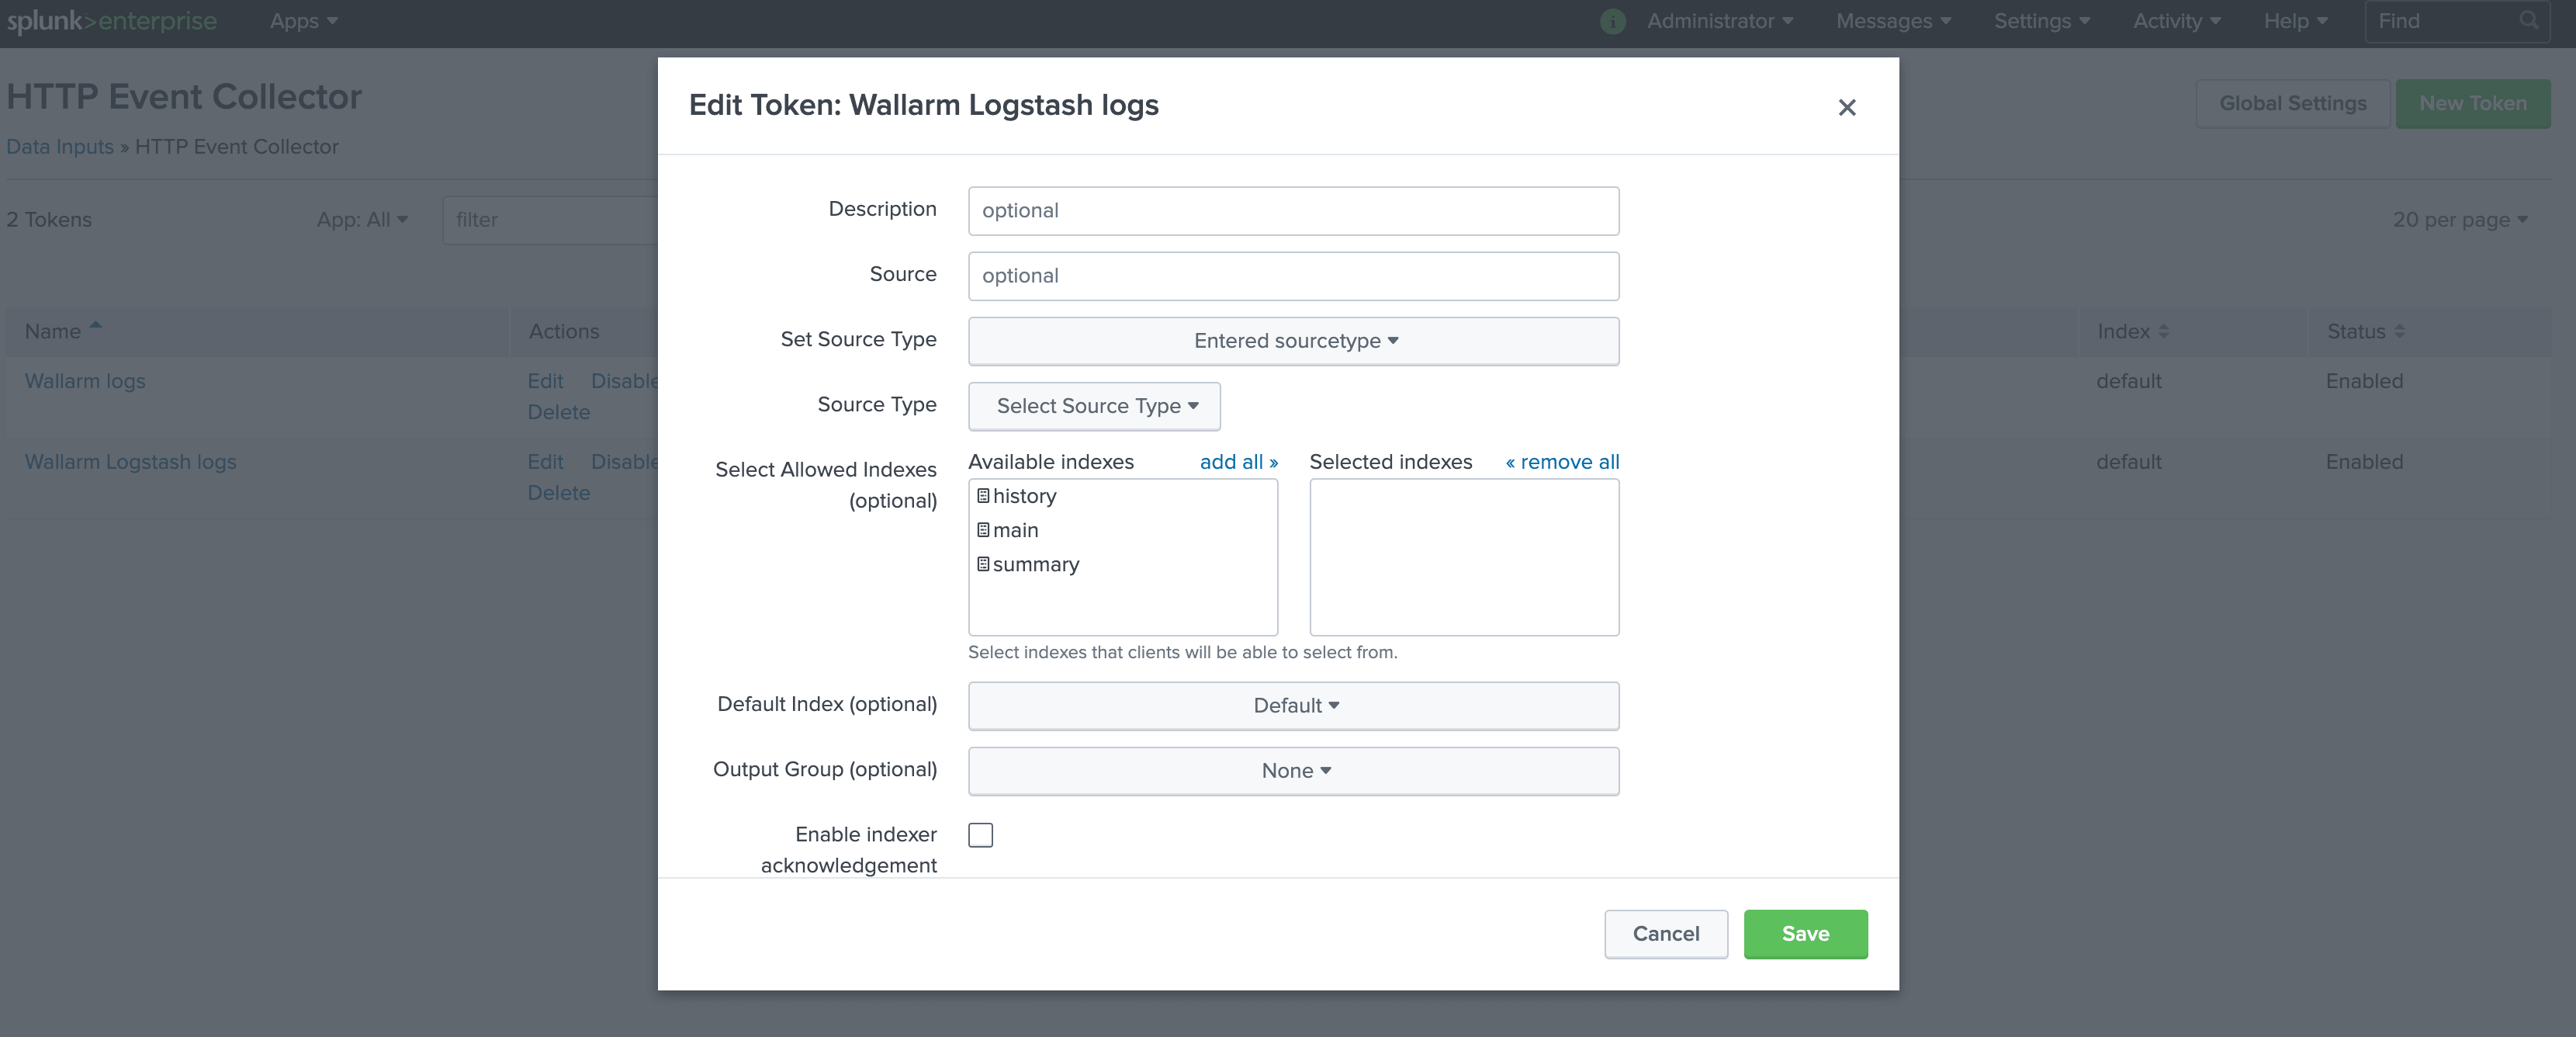
للوصول إلى HTTP Event Controller، سيتم استخدام الرمز المولد 93eaeba4-97a9-46c7-abf3-4e0c545fa5cb.
تتوفر وصف أكثر تفصيلاً لإعداد HTTP Event Controller لـ Splunk في الوثائق الرسمية لـ Splunk.
تكوين Logstash
نظرًا لأن Wallarm ترسل السجلات إلى جامع البيانات المتوسط Logstash عبر webhooks، يجب أن يفي تكوين Logstash بالمتطلبات التالية:
-
قبول طلبات POST أو PUT
-
قبول طلبات HTTPS
-
وجود URL عام
-
توجيه السجلات إلى Splunk Enterprise، هذا المثال يستخدم الإضافة
httpلتوجيه السجلات
يتم تكوين Logstash في ملف logstash-sample.conf:
-
يتم تكوين معالجة webhook الواردة في قسم
input:- يتم إرسال الحركة إلى المنفذ 5044
- Logstash مُكون لقبول الاتصالات HTTPS فقط
- شهادة TLS لـ Logstash الموقعة من قِبل CA موثوق بها علنًا توجد ضمن الملف
/etc/server.crt - المفتاح الخاص لشهادة TLS يوجد ضمن الملف
/etc/server.key
-
يتم تكوين توجيه السجلات إلى Splunk وإخراج السجل في قسم
output:- تتم إعادة توجيه السجلات من Logstash إلى Splunk بتنسيق JSON
- يتم توجيه جميع سجلات الأحداث من Logstash إلى نقطة النهاية لـ API Splunk
https://109.111.35.11:8088/services/collector/rawعبر طلبات POST. لتفويض الطلبات، يُستخدم رمز HTTPS Event Collector - بالإضافة إلى ذلك، يتم طباعة سجلات Logstash على سطر الأوامر (السطر 15 من الكود). يُستخدم الإعداد للتحقق من تسجيل الأحداث عبر Logstash
تتوفر وصف أكثر تفصيلاً لملفات التكوين في الوثائق الرسمية لـ Logstash.
اختبار تكوين Logstash
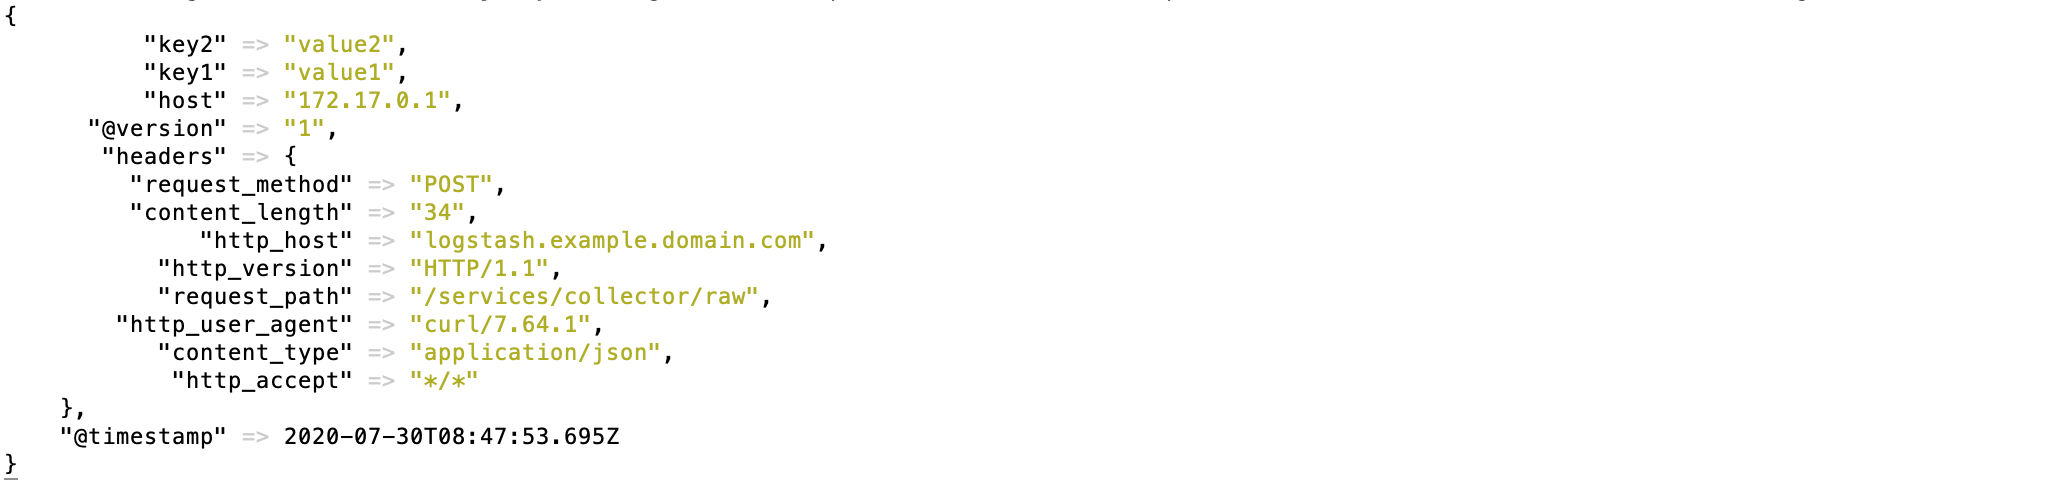
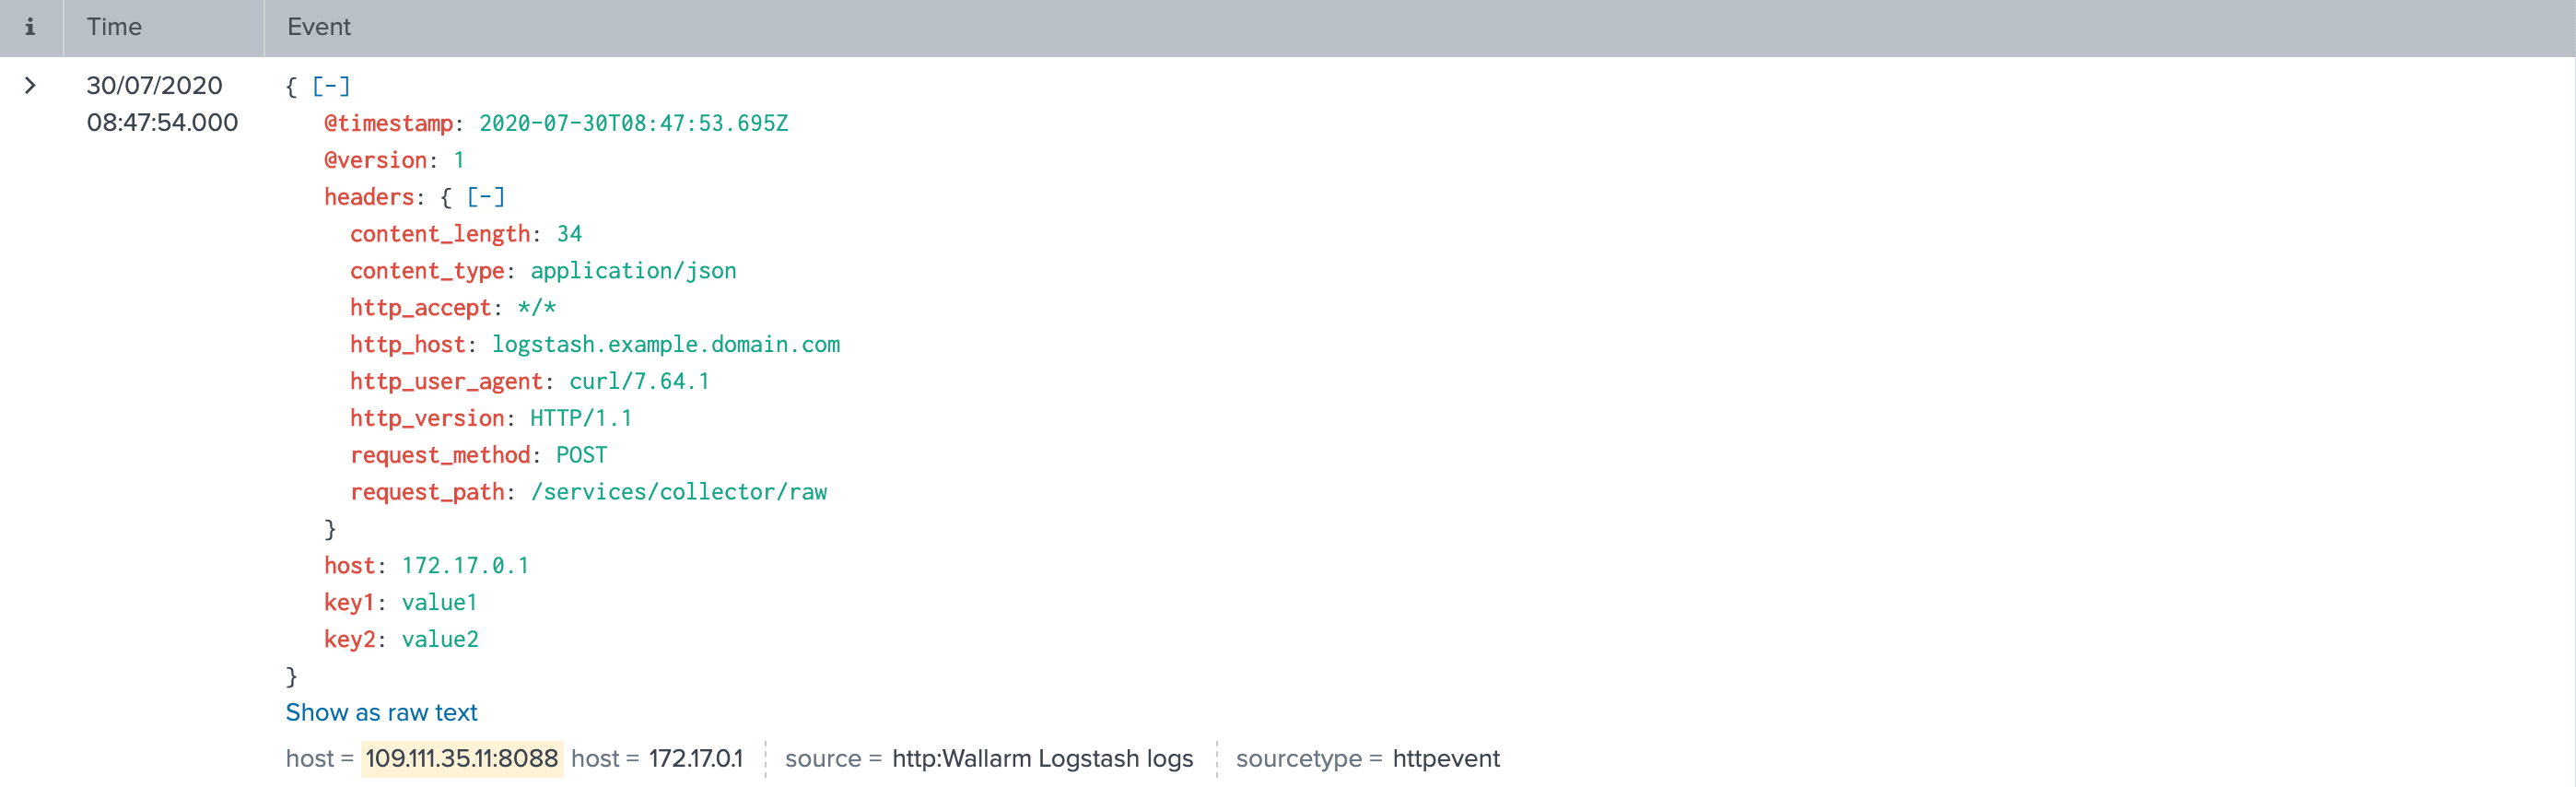
للتحقق من أن سجلات Logstash تم إنشاؤها وإرسالها إلى Splunk، يمكن إرسال طلب POST إلى Logstash.
مثال الطلب:
curl -X POST 'https://logstash.example.domain.com' -H "Content-Type: application/json" -H "Authorization: Splunk 93eaeba4-97a9-46c7-abf3-4e0c545fa5cb" -d '{"key1":"value1", "key2":"value2"}'
سجلات Logstash:
حدث Splunk:
تكوين دمج Logstash
-
Webhooks are sent to
https://logstash.example.domain.com -
Webhooks are sent via POST requests
-
The webhook integration has default advanced settings
-
Webhooks sent to Webhook URLs are all available events: hits, system events, vulnerabilities, scope changes
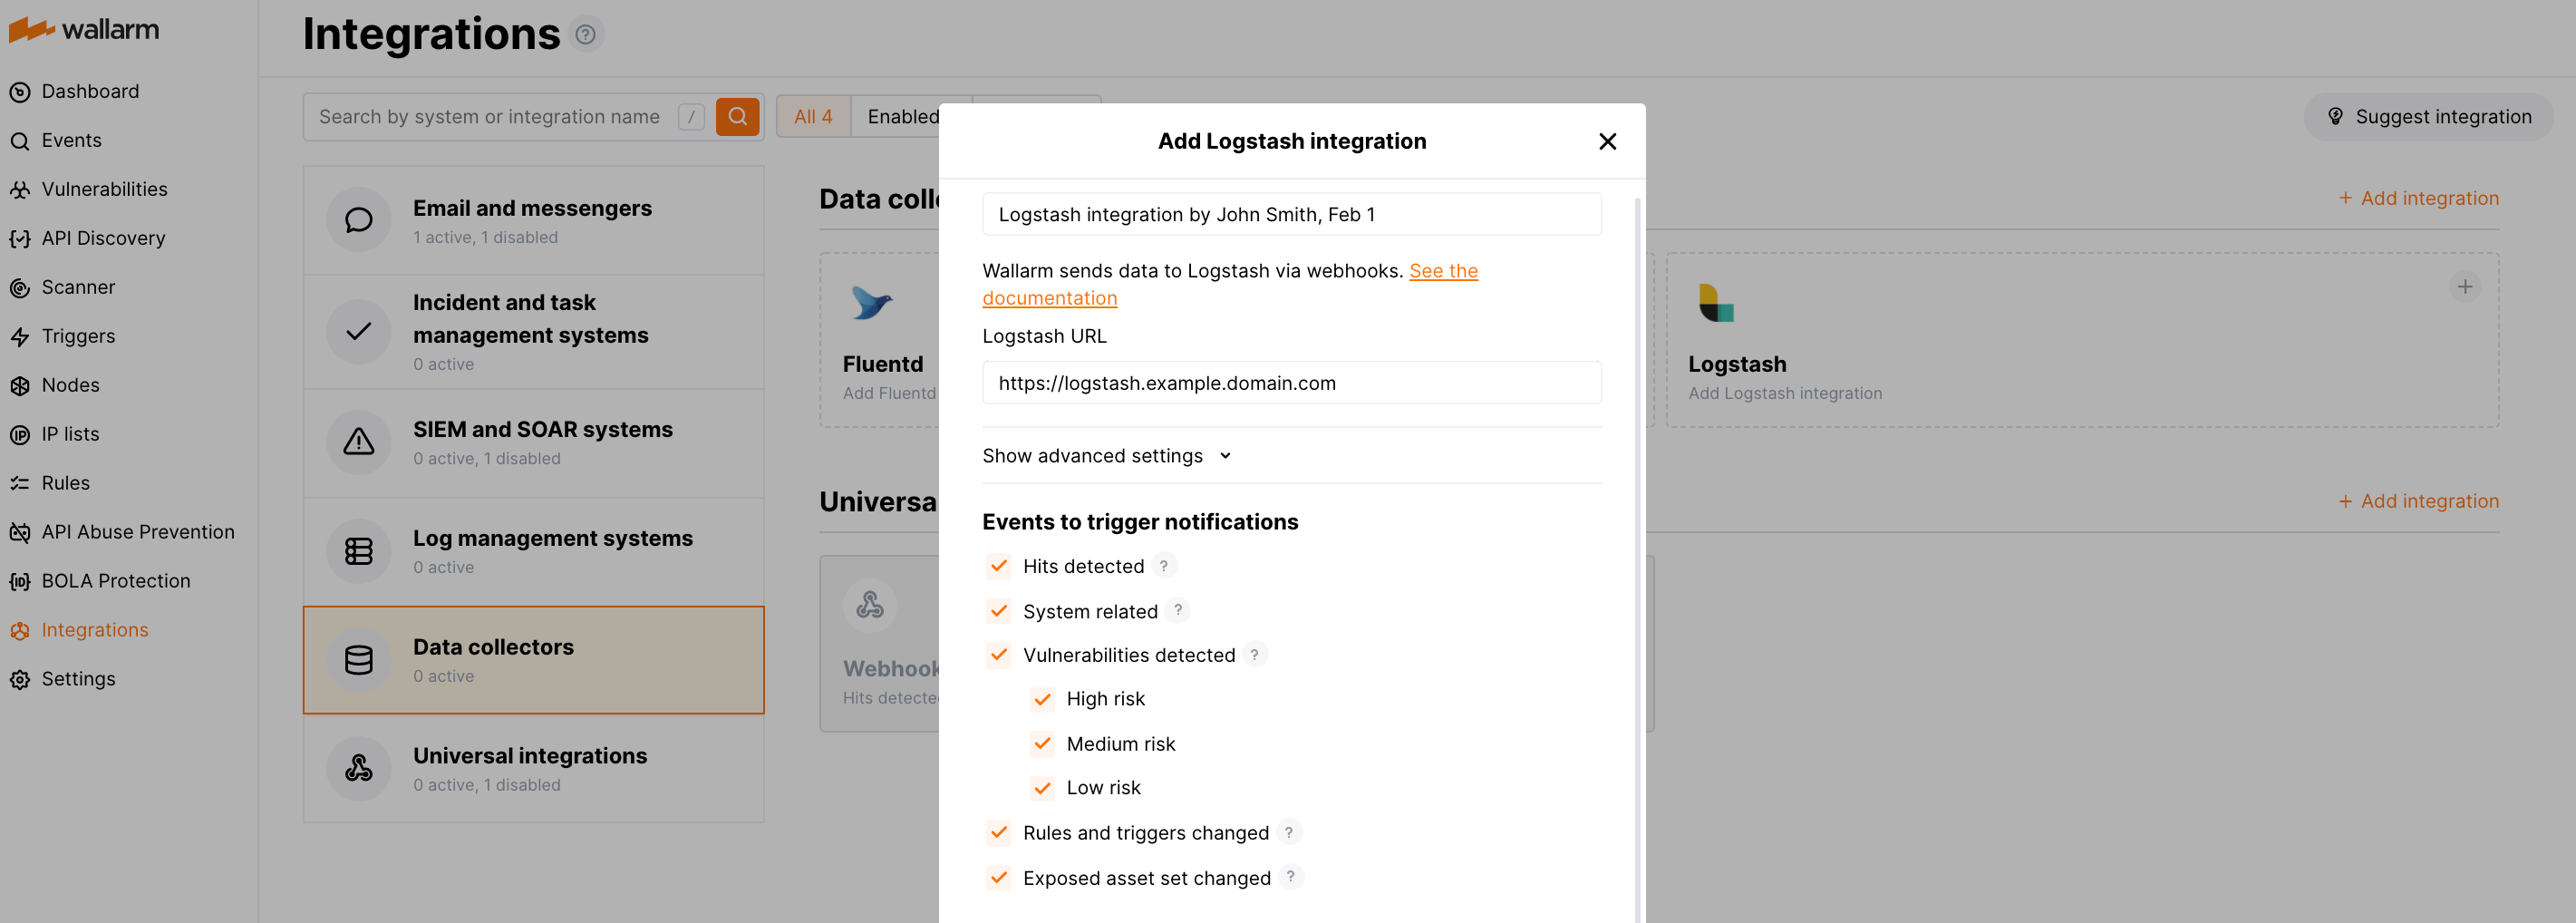
المزيد من التفاصيل عن تكوين دمج Logstash
اختبار المثال
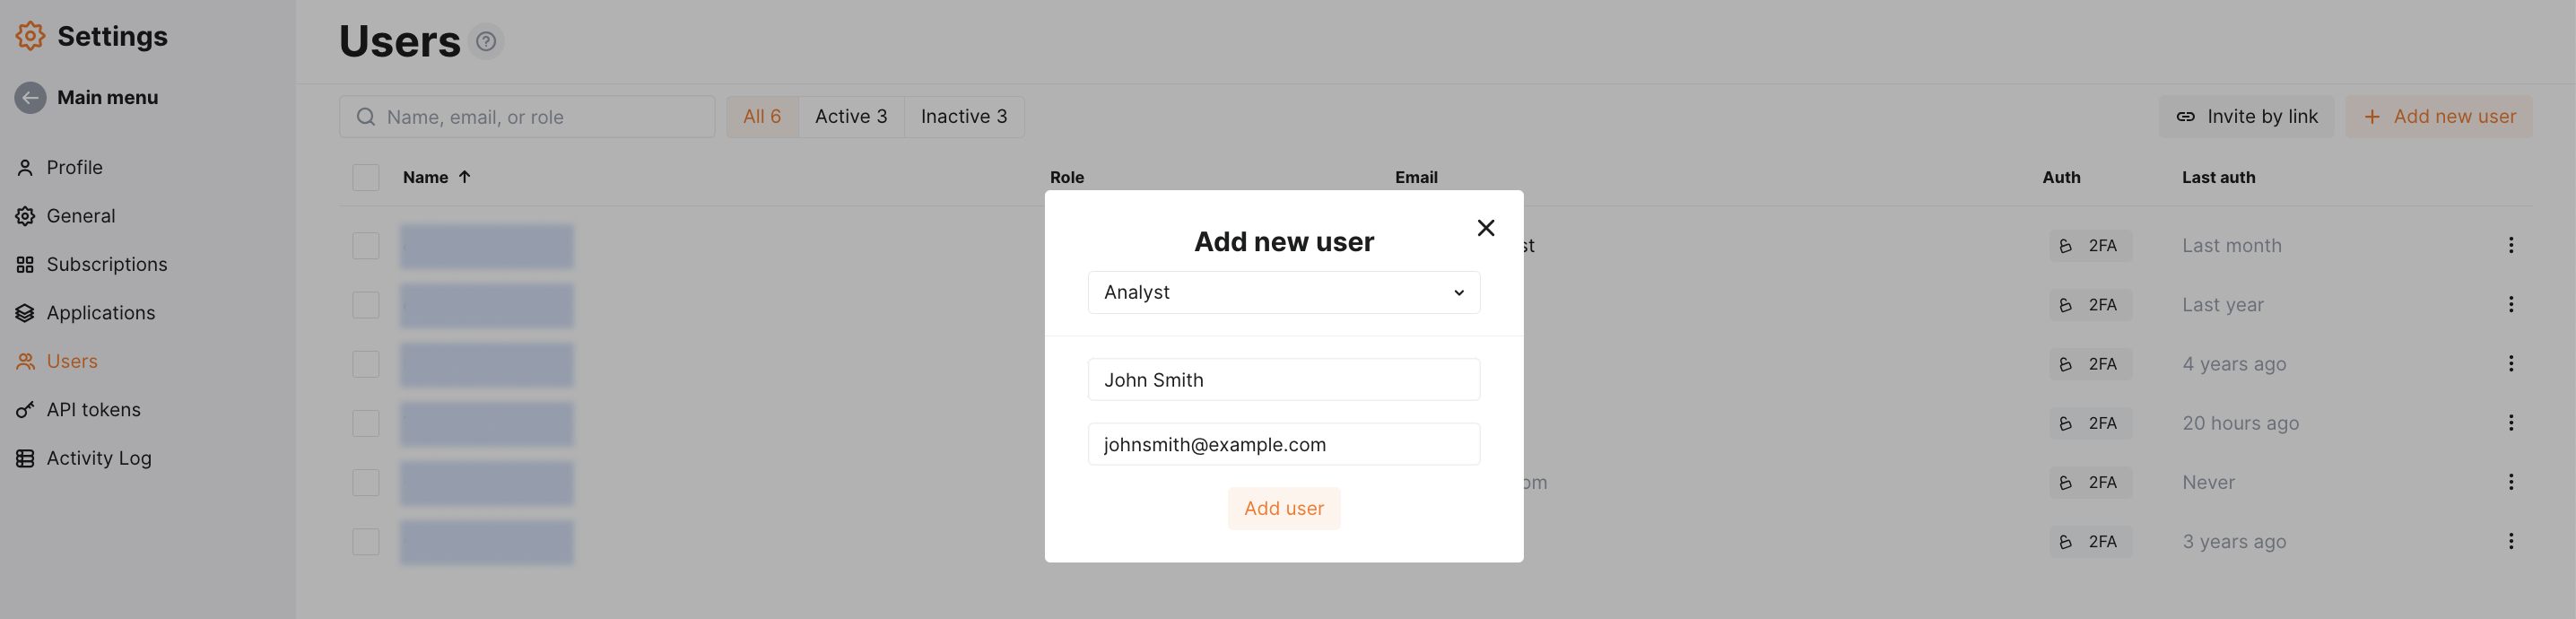
To test the configuration, a new user is added in Wallarm Console:
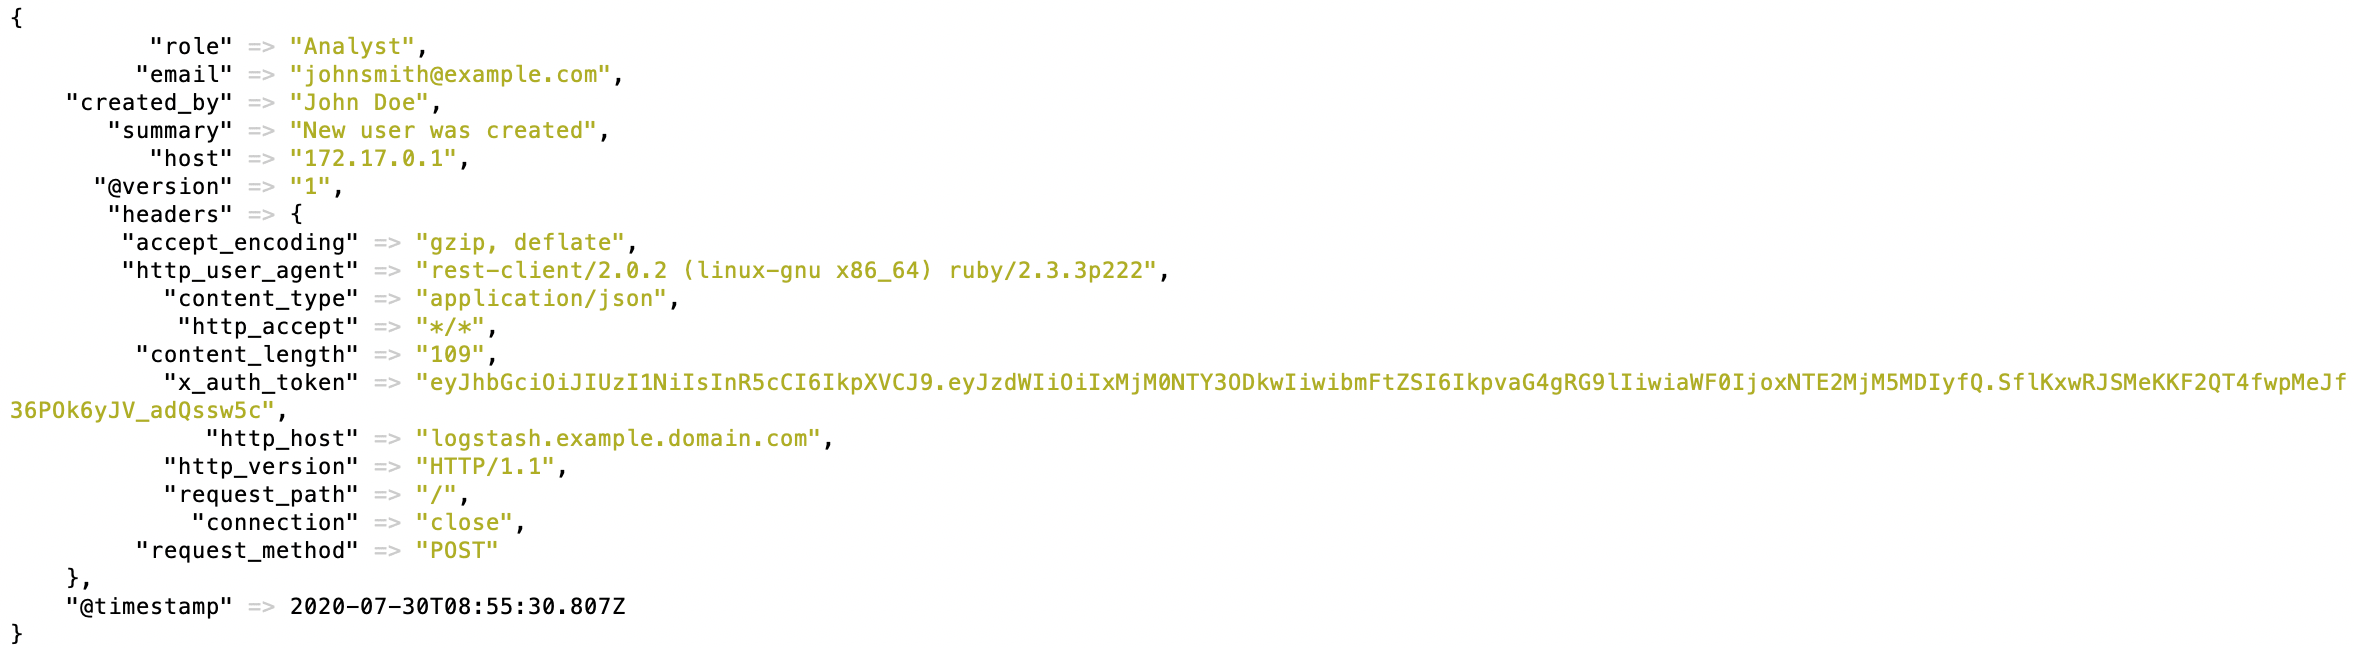
سيقوم Logstash بتسجيل الحدث كما يلي:
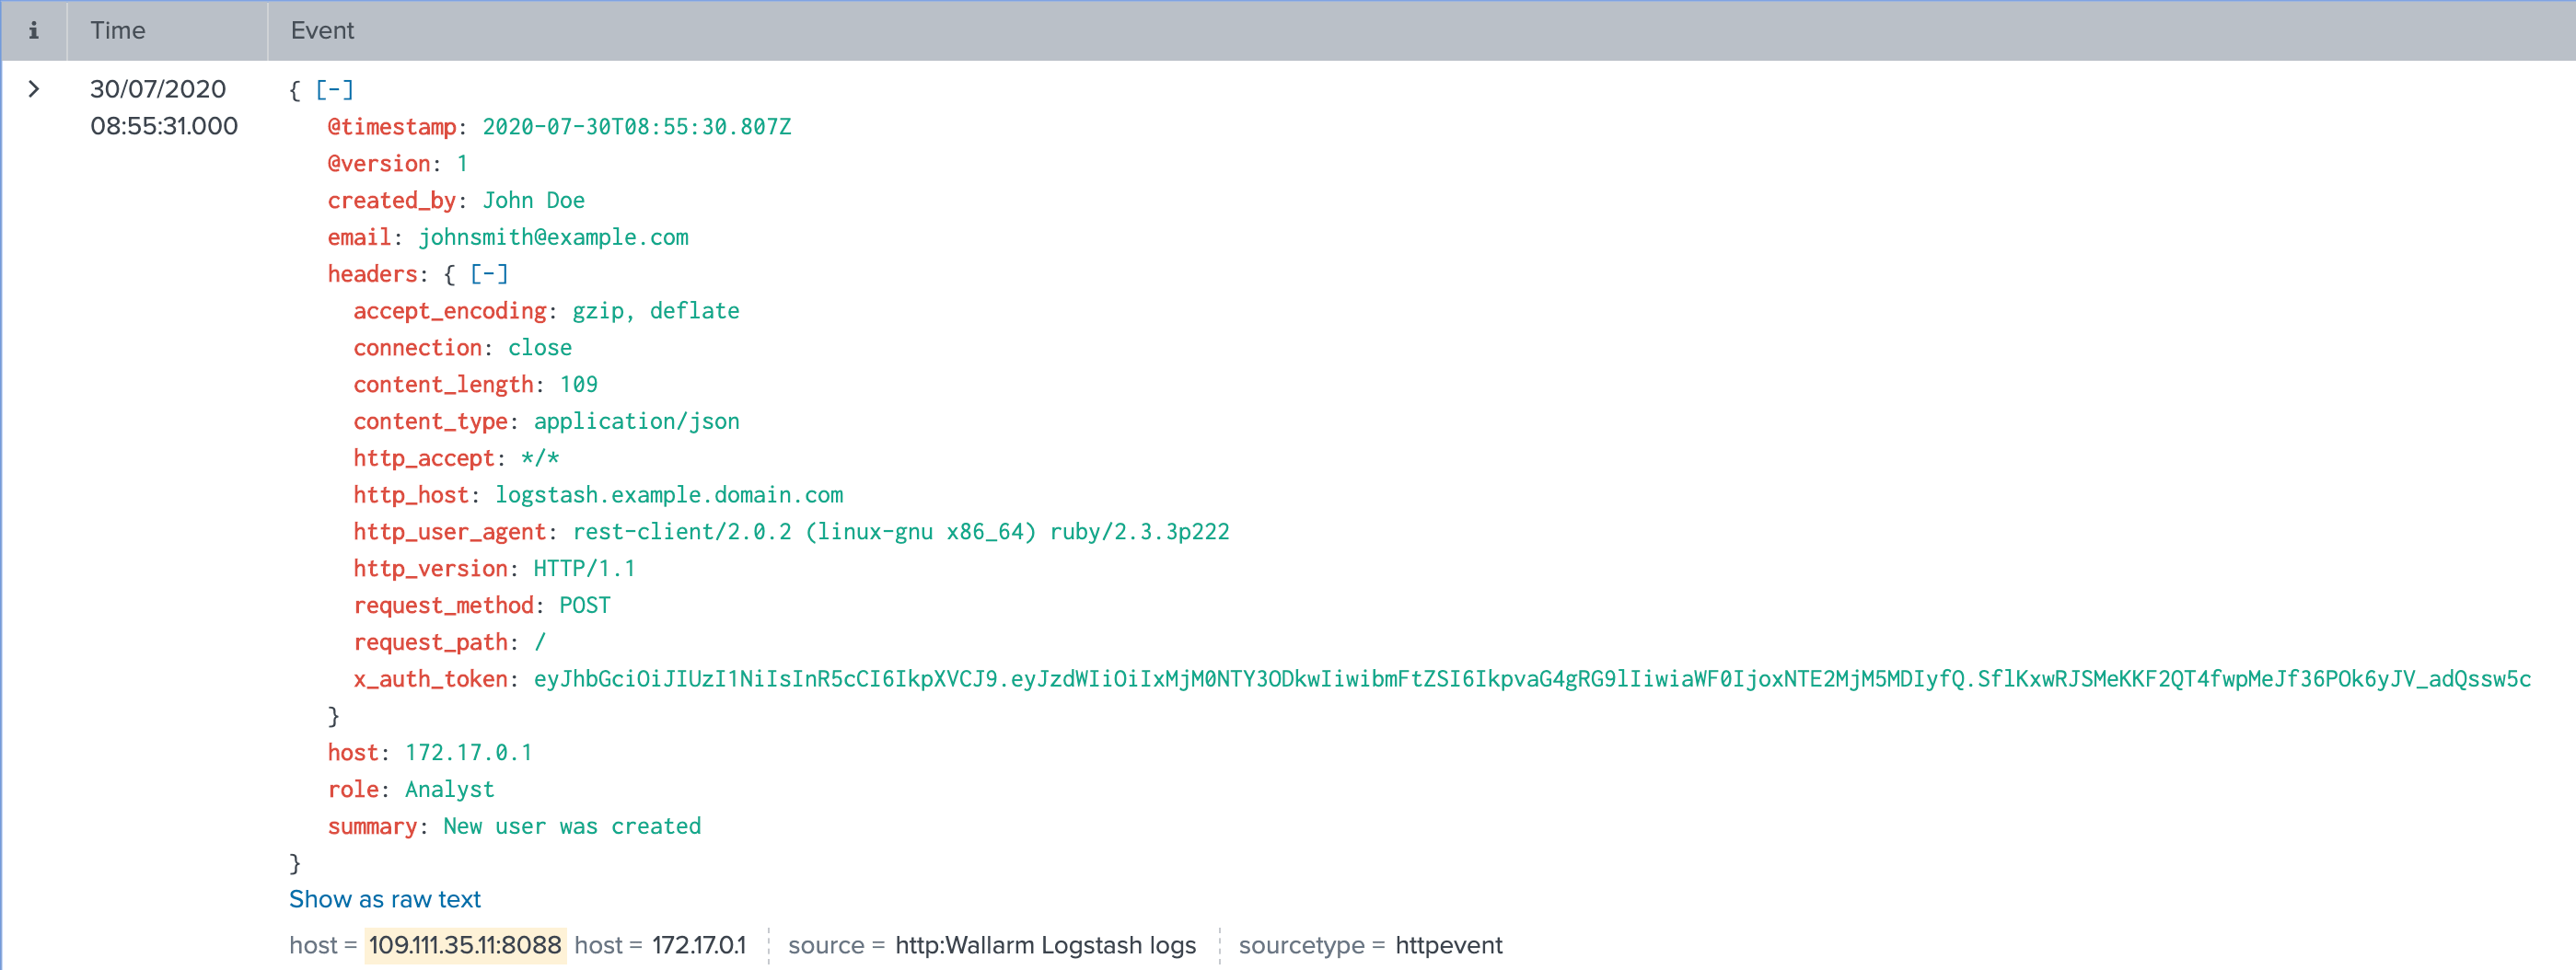
سيتم عرض السجل التالي في أحداث Splunk:
تنظيم الأحداث في لوحة بيانات
To get Wallarm events organized into a ready-to-use dashboard in Splunk 9.0 or later, you can install the Wallarm application for Splunk.
This application provides you with a pre-configured dashboard that is automatically filled with the events received from Wallarm. In addition to that, the application enables you to proceed to detailed logs on each event and export the data from the dashboard.

To install the Wallarm application for Splunk:
-
In the Splunk UI ➝ Apps find the
Wallarm API Securityapplication. -
Click Install and input the Splunkbase credentials.
If some Wallarm events are already logged in Splunk, they will be displayed on the dashboard, as well as further events Wallarm will discover.
In addition, you can fully customize the ready-to-use dashboard, e.g. its view or search strings used to extract data from all Splunk records.