Splunk
[Splunk] (https://www.splunk.com/) هي منصة مصممة للبحث، والمراقبة، وتحليل البيانات التي تُولَّد آليًا، بما في ذلك السجلات والأحداث وأشكال أخرى من البيانات التشغيلية والتجارية. يمكنك إعداد Wallarm لإرسال التنبيهات إلى Splunk.
إعداد التكامل
في واجهة استخدام Splunk:
-
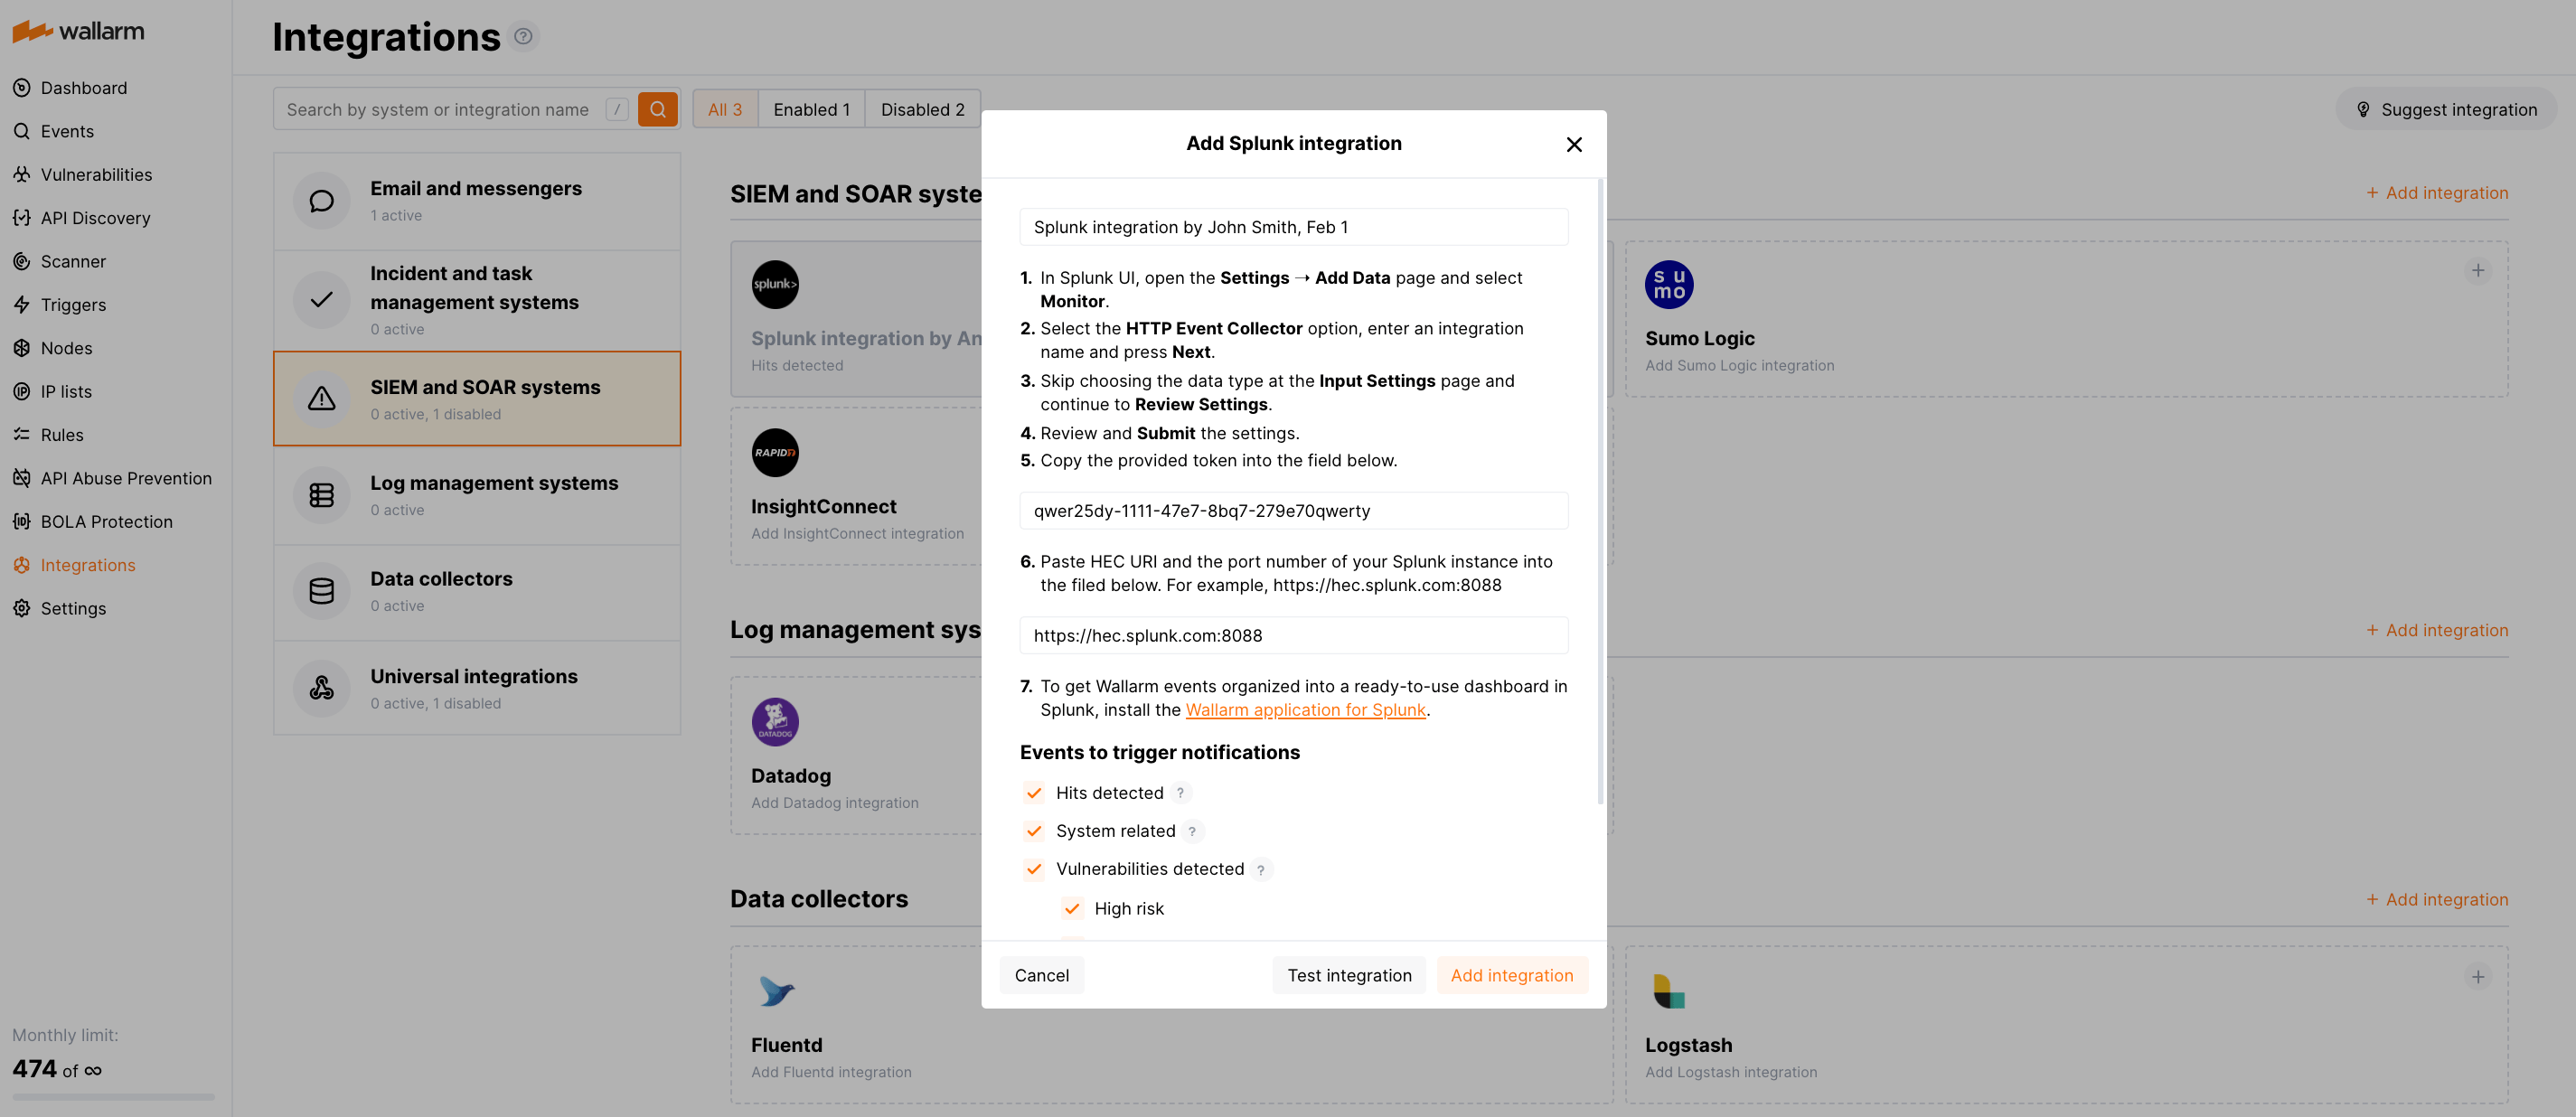
افتح الإعدادات ➝ إضافة بيانات ➝ مراقبة.
-
اختر خيار جامع الأحداث HTTP، أدخل اسم التكامل وانقر التالي.
-
تخطَّ اختيار نوع البيانات في صفحة إعدادات الإدخال واستمر إلى مراجعة الإعدادات.
-
راجع وأرسل الإعدادات.
-
انسخ الرمز الموفر.
في واجهة استخدام Wallarm:
-
افتح قسم التكاملات.
-
انقر على كتلة Splunk أو انقر على زر إضافة تكامل واختر Splunk.
-
أدخل اسم التكامل.
-
الصق الرمز المنسوخ في حقل رمز HEC.
-
الصق URI ورقم المنفذ لمثيل Splunk الخاص بك في حقل HEC URI:PORT. على سبيل المثال:
https://hec.splunk.com:8088. -
اختر أنواع الأحداث لتشغيل الإشعارات.
تفاصيل حول الأحداث المتاحة:
-
Hits detected except for:
- Experimental hits detected based on the custom regular expression. Non-experimental hits trigger notifications.
- Hits not saved in the sample.
Optionally include the
headersobject with hit headers in hit logs. If disabled, headers are not included in the logs. -
System related:
- User changes (newly created, deleted, role change)
- Integration changes (disabled, deleted)
- Application changes (newly created, deleted, name change)
- Errors during regular update of specifications used for rogue API detection or API specification enforcement
- Vulnerabilities detected, all by default or only for the selected risk level(s) - high, medium or low.
- Rules and triggers changed (creating, updating, or deleting the rule or trigger)
- On an hourly basis, you can get a notification with the number of requests processed during the previous hour
-
-
انقر اختبار التكامل للتحقق من صحة التكوين، وتوافر Wallarm Cloud، وتنسيق الإشعار.
اختبار إشعار Splunk بتنسيق JSON:
{ summary:"[رسالة اختبار] [شريك اختبار (US)] تم اكتشاف ثغرة جديدة", description:"نوع الإشعار: ثغرة تم اكتشاف ثغرة جديدة في نظامك. المعرف: العنوان: اختبار النطاق: example.com المسار: الطريقة: المكتشف من قبل: العامل: النوع: معلومات التهديد: متوسط المزيد من التفاصيل: https://us1.my.wallarm.com/object/555 العميل: شركة الاختبار السحابة: US ", details:{ client_name:"شركة الاختبار", cloud:"US", notification_type:"ثغرة", vuln_link:"https://us1.my.wallarm.com/object/555", vuln:{ domain:"example.com", id:null, method:null, parameter:null, path:null, title:"اختبار", discovered_by:null, threat:"متوسط", type:"معلومات" } } } -
انقر إضافة تكامل.
Wallarm Cloud IP addresses
To provide Wallarm Cloud access to your system, you may need a list of its public IP addresses:
إعداد التنبيهات الإضافية
Besides the notifications you have already set up through the integration card, Wallarm triggers allow you to select additional events for notifications:
-
Number of attacks, hits or incidents per time interval (day, hour, etc.) exceeds the set number
What is not counted
- For attacks:
- The experimental attacks based on the custom regular expressions.
- For hits:
- The experimental hits based on the custom regular expressions.
- Hits not saved in the sample.
- For attacks:
-
Changes in API took place
-
IP address was denylisted
-
New rogue API (shadow, zombie) was detected
-
New user was added to the company account
For condition detailing, you can add one or more filters. As soon, as condition and filters are set, select the integration through which the selected alert should be sent. You can select several integrations simultaneously.

تنظيم الأحداث في لوحة تحكم
To get Wallarm events organized into a ready-to-use dashboard in Splunk 9.0 or later, you can install the Wallarm application for Splunk.
This application provides you with a pre-configured dashboard that is automatically filled with the events received from Wallarm. In addition to that, the application enables you to proceed to detailed logs on each event and export the data from the dashboard.

To install the Wallarm application for Splunk:
-
In the Splunk UI ➝ Apps find the
Wallarm API Securityapplication. -
Click Install and input the Splunkbase credentials.
If some Wallarm events are already logged in Splunk, they will be displayed on the dashboard, as well as further events Wallarm will discover.
In addition, you can fully customize the ready-to-use dashboard, e.g. its view or search strings used to extract data from all Splunk records.
تعطيل وحذف التكامل
You can delete or temporarily disable the integration. While deleting stops sending notificatioins and completely deletes all configuration, disabling just stops sending notifications which you can at any moment re-enable with the same settings.
If for the integration the System related events are selected to trigger notifications, Wallarm will notify about both of these actions.
عدم توفر النظام وأخطاء في معايير التكامل
Notifications to the system are sent via requests. If the system is unavailable or integration parameters are configured incorrectly, the error code is returned in the response to the request.
If the system responds to Wallarm request with any code other than 2xx, Wallarm resends the request with the interval until the 2xx code is received:
-
The first cycle intervals: 1, 3, 5, 10, 10 seconds
-
The second cycle intervals: 0, 1, 3, 5, 30 seconds
-
The third cycle intervals: 1, 1, 3, 5, 10, 30 minutes
If the percentage of unsuccessful requests reaches 60% in 12 hours, the integration is automatically disabled. If you receive system notifications, you will get a message about automatically disabled integration.