Wallarm Health Check After Node Deployment
This document provides you with a checklist to ensure Wallarm operates correctly after a new filtering node deployment. You can also use this procedure to test health of any existing node.
Health check results
A difference between described expected result and actual result may be a sign of problem in node functioning. It is recommended to give a special attention to such discrepancies and if necessary, contact the Wallarm support team for help.
Node is registered in Cloud
To check:
-
Open Wallarm Console → Configuration → Nodes.
-
Apply filter to see only active nodes.
-
Find your node in the list. Click to view details.
Node registers attacks
To check:
-
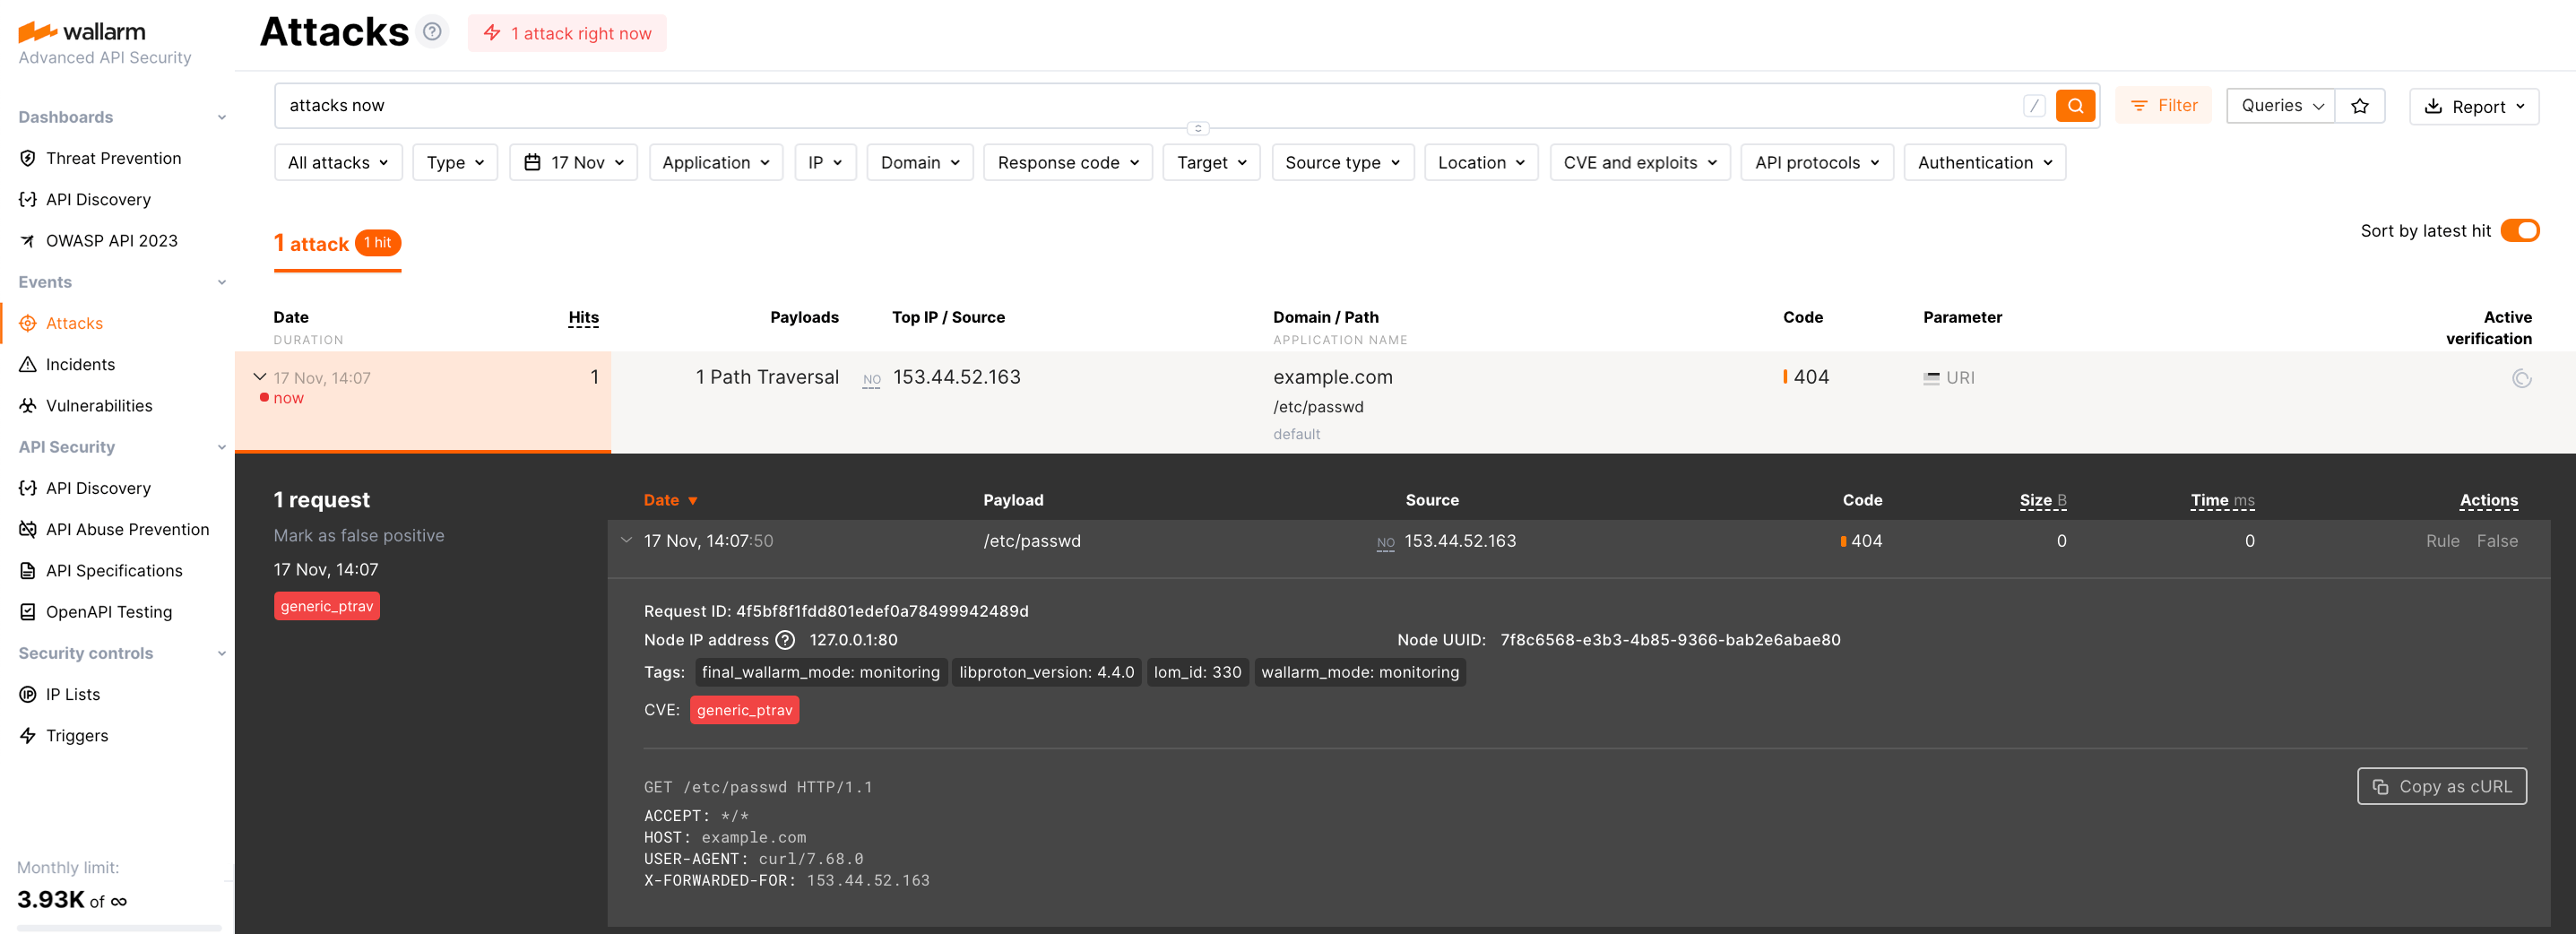
Send the request with test Path Traversal attack to a protected resource address:
If traffic is configured to be proxied to
example.com, include the-H "Host: example.com"header in the request. -
Open Wallarm Console → Attacks section in the US Cloud or EU Cloud and make sure the attack is displayed in the list.
-
Optionally, test other aspects of the node functioning.
Node registers all traffic
To provide a full visibility of your traffic, Wallarm's API Sessions display all requests - malicious and legitimate - in the form of step-by-step user sessions.
To check:
-
Send a request to the resource protected by your node:
Or send several requests with a bash script:
This example is for 10 requests.
-
Open Events → API Sessions.
-
Find session with your requests and previously sent attack - all in one session.
Node statistics service works
You can get filtering node operation statistics by requesting the /wallarm-status URL.
The statistics service
You can read more about the statistics service and how to configure it here.
To check:
-
On the machine where the node is installed, run the command:
-
Check the output. It should be like:
{
      "requests": 11,
      "streams": 0,
      "messages": 0,
      "attacks": 1,
      "blocked": 0,
      "blocked_by_acl": 0,
      "blocked_by_antibot": 0,
      "acl_allow_list": 0,
      "tnt_errors": 0,
      "api_errors": 0,
      "requests_lost": 0,
      "overlimits_time": 0,
      "segfaults": 0,
      "memfaults": 0,
      "softmemfaults": 0,
      "proton_errors": 0,
      "time_detect": 0,
      "db_id": 199,
      "lom_id": 1726,
      "custom_ruleset_id": 1726,
      "custom_ruleset_ver": 56,
      "db_apply_time": 1750365841,
      "lom_apply_time": 1750365842,
      "custom_ruleset_apply_time": 1750365842,
      "proton_instances": {
            "total": 2,
            "success": 2,
            "fallback": 0,
            "failed": 0
      },
      "stalled_workers_count": 0,
      "stalled_workers": [],
      "ts_files": [
      {
            "id": 1726,
            "size": 11887,
            "mod_time": 1750365842,
            "fname": "/opt/wallarm/etc/wallarm/custom_ruleset"
      }
      ],
      "db_files": [
      {
            "id": 199,
            "size": 355930,
            "mod_time": 1750365841,
            "fname": "/opt/wallarm/etc/wallarm/proton.db"
      }
      ],
      "startid": 2594491974706159096,
      "compatibility": 4,
      "config_revision": 0,
      "rate_limit": {
      "shm_zone_size": 67108864,
      "buckets_count": 2,
      "entries": 0,
      "delayed": 0,
      "exceeded": 0,
      "expired": 0,
      "removed": 0,
      "no_free_nodes": 0
      },
      "timestamp": 1750371146.209885,
      "split": {
      "clients": [
            {
            "client_id": null,
            "requests": 11,
            "streams": 0,
            "messages": 0,
            "attacks": 1,
            "blocked": 0,
            "blocked_by_acl": 0,
            "blocked_by_antibot": 0,
            "overlimits_time": 0,
            "time_detect": 0,
            "applications": [
            {
                  "app_id": -1,
                  "requests": 11,
                  "streams": 0,
                  "messages": 0,
                  "attacks": 1,
                  "blocked": 0,
                  "blocked_by_acl": 0,
                  "blocked_by_antibot": 0,
                  "overlimits_time": 0,
                  "time_detect": 0
            }
            ]
            }
      ]
      }
}
This means that the filtering node statistics service is running and working properly.
Node logs are collected
To check:
-
On the machine where the node is installed, go to
/opt/wallarm/var/log/wallarm. -
Check data in
wcli-out.log: logs of most Wallarm services, including brute force detection, attack export to the Cloud, and the status of node synchronization with the Cloud, etc.
See details on other logs and log configuration here.
IP lists work
In Wallarm, you can control access to your application APIs by allowlisting, denylisting, and graylisting of IP addresses the requests come from. Learn core logic of IP lists here.
To check:
-
Open Wallarm Console → Events → Attacks and locate attack created by you during the Node registers attacks check.
-
Copy attack source IP.
-
Go to Security Controls → IP Lists → Allowlist, and add copied source IP to this list.
-
Wait (about 2 minutes) until new IP list state is uploaded to the filtering node.
-
Send the same attack from this IP again. In Attacks, nothing should appear.
-
Remove the IP from the Allowlist.
-
Add the IP to the Denylist
-
Send legitimate requests as the ones in the Node registers all traffic step. The requests (even though the legitimate ones) should appear in Attacks as blocked.
Rules work
In Wallarm, you can use rules to change how the system detects malicious requests and acts when such malicious requests are detected. You create rules in Cloud via Wallarm Console, they form your custom ruleset, then Cloud sends it to the filtering node where they start to work.
To check:
-
Check current custom ruleset ID and date using one of the methods:
- In Wallarm Console → Configuration → Nodes, access your node details and note custom_ruleset ID number and time of installation.
- In node statistics, note
custom_ruleset_idandcustom_ruleset_apply_time. - In the
wcli-out.lognode log, note the latest line containing"lom", pay attention toversionandtimein that string.
-
Go to Security Controls → Rules.
-
Use Add rule → Fine-tuning attack detection → Ignore certain attacks, select to ignore Path traversal in
uripart of request, then create the rule. -
Check that data from first step is updated (may take 2-4 minutes).
-
Repeat attack from the Node registers attacks check. Now this attack should be ignored and not displayed in the Attacks.
-
Delete the rule.