# Exporting Metrics to Graphite via the `collectd` Write Plugin
This document provides an example of using the `write_graphite` write plugin to export metrics to Graphite.
## Example Workflow
!!! info "Example of metric"
This example shows how to work with the single [`wallarm_nginx/gauge-abnormal`](https://docs.wallarm.com/5.x/admin-en/monitoring/available-metrics.md#number-of-requests) metric, which shows the number of requests processed by the filter node.
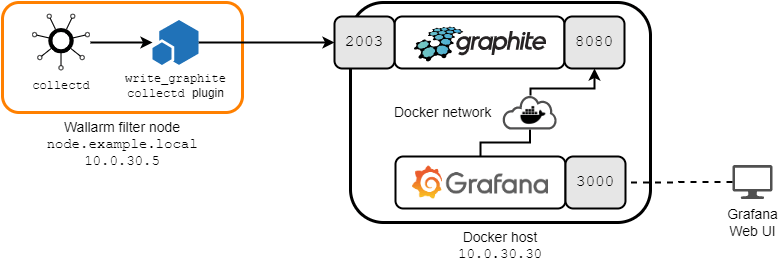
The following deployment scheme is used in this document:
* Wallarm filter node is deployed on a host accessible via the `10.0.30.5` IP address and the `node.example.local` fully qualified domain name.
The `write_graphite` plugin for `collectd` on the filter node is configured as follows:
* All metrics are sent to the `10.0.30.30` server listening on the `2003/TCP` port.
* Some Wallarm-specific `collectd` plugins support multiple [instances](https://collectd.org/wiki/index.php/Naming_schema), so the `write_graphite` plugin contains the `SeparateInstances` parameter set to `true`. The `true` value means that the plugin can work with several instances.
A complete list of plugin options is available [here](https://www.collectd.org/documentation/manpages/collectd.conf.html#plugin_write_graphite).
* Both `graphite` and `grafana` services are deployed as Docker containers on a separate host with the `10.0.30.30` IP address.
The `graphite` service with Graphite is configured as follows:
* It listens for incoming connections on the `2003/TCP` port, to which `collectd` will send the filter node metrics.
* It listens for incoming connections on the `8080/TCP` port, through which communication with Grafana will occur.
* The service shares the `sample-net` Docker network with the `grafana` service.
The `grafana` service with Grafana is configured as follows:
* The Grafana web console is available at `http://10.0.30.30:3000`.
* The service shares the `sample-net` Docker network with the `graphite` service.
## Configuring Metrics Export to Graphite
!!! info "Prerequisites"
It is assumed that
* [Docker Community Edition](https://docs.docker.com/install/) and [`docker-compose`](https://docs.docker.com/compose/install/) are already installed on the `10.0.30.30` Docker host.
* The `node.example.local` filter node is already deployed, configured, available for further configuration (for example, via the SSH protocol), and working.
### Deploying Graphite and Grafana
Deploy Graphite and Grafana on the Docker host:
1. Create a `docker-compose.yaml` file with the following content:
```
version: "3"
services:
grafana:
image: grafana/grafana
container_name: grafana
restart: always
ports:
- 3000:3000
networks:
- sample-net
graphite:
image: graphiteapp/graphite-statsd
container_name: graphite
restart: always
ports:
- 8080:8080
- 2003:2003
networks:
- sample-net
networks:
sample-net:
```
2. Build the services by executing the `docker-compose build` command.
3. Run the services by executing the `docker-compose up -d graphite grafana` command.
At this point, you should have Graphite running and ready to receive metrics from `collectd`, and Grafana ready to monitor and visualize the data stored in Graphite.
### Configuring `collectd`
Configure `collectd` to download metrics to Graphite:
**Docker image, cloud image, all-in-one installer:**
1. Connect to the filter node (for example, using the SSH protocol). Make sure you are logged in as `root` or another account with superuser privileges.
1. Add the following configuration to the `/opt/wallarm/etc/collectd/wallarm-collectd.conf` file:
```
LoadPlugin write_graphite
Host "10.0.30.30"
Port "2003"
Protocol "tcp"
SeparateInstances true
```
The following entities are configured here:
1. The host name from which metrics are collected (`node.example.local`).
2. The server to which metrics should be sent (`10.0.30.30`).
3. The server port (`2003`) and the protocol (`tcp`).
4. The data transfer logic: the data of one instance of the plugin is separated from the data of another instance (`SeparateInstances true`).
1. Restart the `wallarm` service by running the following command:
```bash
sudo systemctl restart wallarm
```
**Other installations:**
1. Connect to the filter node (for example, using the SSH protocol). Make sure you are logged in as `root` or another account with superuser privileges.
1. Create a file named `/etc/collectd/collectd.conf.d/export-to-graphite.conf` with the following content:
```
LoadPlugin write_graphite
Host "10.0.30.30"
Port "2003"
Protocol "tcp"
SeparateInstances true
```
The following entities are configured here:
1. The host name from which metrics are collected (`node.example.local`).
2. The server to which metrics should be sent (`10.0.30.30`).
3. The server port (`2003`) and the protocol (`tcp`).
4. The data transfer logic: the data of one instance of the plugin is separated from the data of another instance (`SeparateInstances true`).
1. Restart the `collectd` service by running the appropriate command:
**Ubuntu 14.04 LTS:**
```bash
sudo service collectd restart
```
**Other supported distributions:**
```bash
sudo systemctl restart collectd
```
Now Graphite will receive all metrics of the filter node. You can visualize the metrics you are interested in, and monitor them [with Grafana](https://docs.wallarm.com/5.x/admin-en/monitoring/working-with-grafana.md).