Exporting Metrics to Graphite via the collectd Write Plugin
This document provides an example of using the write_graphite write plugin to export metrics to Graphite.
Example Workflow
Example of metric
This example shows how to work with the single wallarm_nginx/gauge-abnormal metric, which shows the number of requests processed by the filter node.
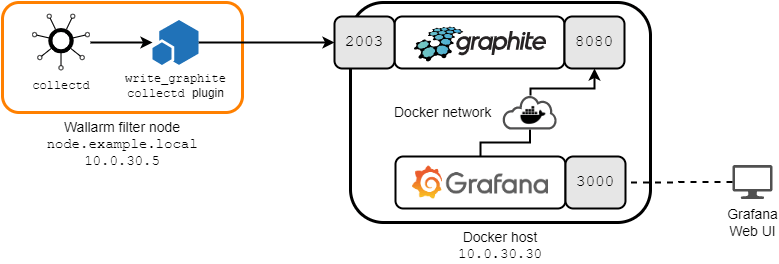
The following deployment scheme is used in this document:
-
Wallarm filter node is deployed on a host accessible via the
10.0.30.5IP address and thenode.example.localfully qualified domain name.The
write_graphiteplugin forcollectdon the filter node is configured as follows:- All metrics are sent to the
10.0.30.30server listening on the2003/TCPport. - Some Wallarm-specific
collectdplugins support multiple instances, so thewrite_graphiteplugin contains theSeparateInstancesparameter set totrue. Thetruevalue means that the plugin can work with several instances.
A complete list of plugin options is available here.
- All metrics are sent to the
-
Both
graphiteandgrafanaservices are deployed as Docker containers on a separate host with the10.0.30.30IP address.The
graphiteservice with Graphite is configured as follows:- It listens for incoming connections on the
2003/TCPport, to whichcollectdwill send the filter node metrics. - It listens for incoming connections on the
8080/TCPport, through which communication with Grafana will occur. - The service shares the
sample-netDocker network with thegrafanaservice.
The
grafanaservice with Grafana is configured as follows:- The Grafana web console is available at
http://10.0.30.30:3000. - The service shares the
sample-netDocker network with thegraphiteservice.
- It listens for incoming connections on the
Configuring Metrics Export to Graphite
Prerequisites
It is assumed that
- Docker Community Edition and
docker-composeare already installed on the10.0.30.30Docker host. - The
node.example.localfilter node is already deployed, configured, available for further configuration (for example, via the SSH protocol), and working.
Deploying Graphite and Grafana
Deploy Graphite and Grafana on the Docker host:
-
Create a
docker-compose.yamlfile with the following content: -
Build the services by executing the
docker-compose buildcommand. -
Run the services by executing the
docker-compose up -d graphite grafanacommand.
At this point, you should have Graphite running and ready to receive metrics from collectd, and Grafana ready to monitor and visualize the data stored in Graphite.
Configuring collectd
Configure collectd to download metrics to Graphite:
- Connect to the filter node (for example, using the SSH protocol). Make sure you are logged in as
rootor another account with superuser privileges. -
Add the following configuration to the
/opt/wallarm/etc/collectd/wallarm-collectd.conffile:LoadPlugin write_graphite <Plugin write_graphite> <Node "node.example.local"> Host "10.0.30.30" Port "2003" Protocol "tcp" SeparateInstances true </Node> </Plugin>The following entities are configured here:
- The host name from which metrics are collected (
node.example.local). - The server to which metrics should be sent (
10.0.30.30). - The server port (
2003) and the protocol (tcp). - The data transfer logic: the data of one instance of the plugin is separated from the data of another instance (
SeparateInstances true).
- The host name from which metrics are collected (
-
Restart the
wallarmservice by running the following command:
- Connect to the filter node (for example, using the SSH protocol). Make sure you are logged in as
rootor another account with superuser privileges. -
Create a file named
/etc/collectd/collectd.conf.d/export-to-graphite.confwith the following content:LoadPlugin write_graphite <Plugin write_graphite> <Node "node.example.local"> Host "10.0.30.30" Port "2003" Protocol "tcp" SeparateInstances true </Node> </Plugin>The following entities are configured here:
- The host name from which metrics are collected (
node.example.local). - The server to which metrics should be sent (
10.0.30.30). - The server port (
2003) and the protocol (tcp). - The data transfer logic: the data of one instance of the plugin is separated from the data of another instance (
SeparateInstances true).
- The host name from which metrics are collected (
-
Restart the
collectdservice by running the appropriate command:
Now Graphite will receive all metrics of the filter node. You can visualize the metrics you are interested in, and monitor them with Grafana.