Working with the Filter Node Metrics in Zabbix
Go to http://10.0.30.30 to access the Zabbix web interface login page. Log in to the web interface using the standard login (Admin) and password (zabbix).
To monitor the metrics of the node.example.local filter node, perform the following actions:
-
Create a new host by performing the following steps:
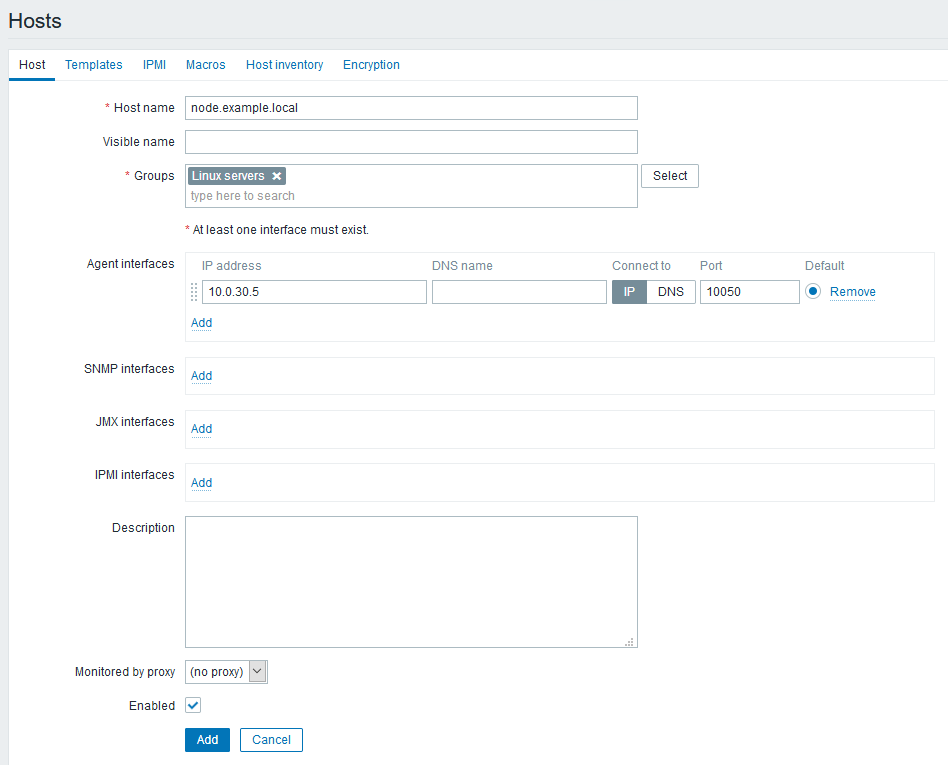
- Go to the Configuration → Hosts tab and click the Create host button.
- Fill the fully qualified domain name of the filter node host in the Host name field (
node.example.local). - Select the group you want to place the host into from the Groups field (for example, you can use the predefined “Linux servers” group, or create a dedicated group).
-
Fill the IP address of the filter node host (
10.0.30.5) in the Agent interfaces parameter group. Leave the default port value (10050) unchanged.Connecting using a domain name
If necessary, you can set up a domain name to connect to the Zabbix agent. To do this, change the appropriate settings accordingly.
-
Configure other settings, if necessary.
- Make sure that the Enabled checkbox is checked.
- Complete the host creation process by clicking the Add button.
-
Add metrics that should be monitored for the filter node host. To add a single metric, follow the steps below:
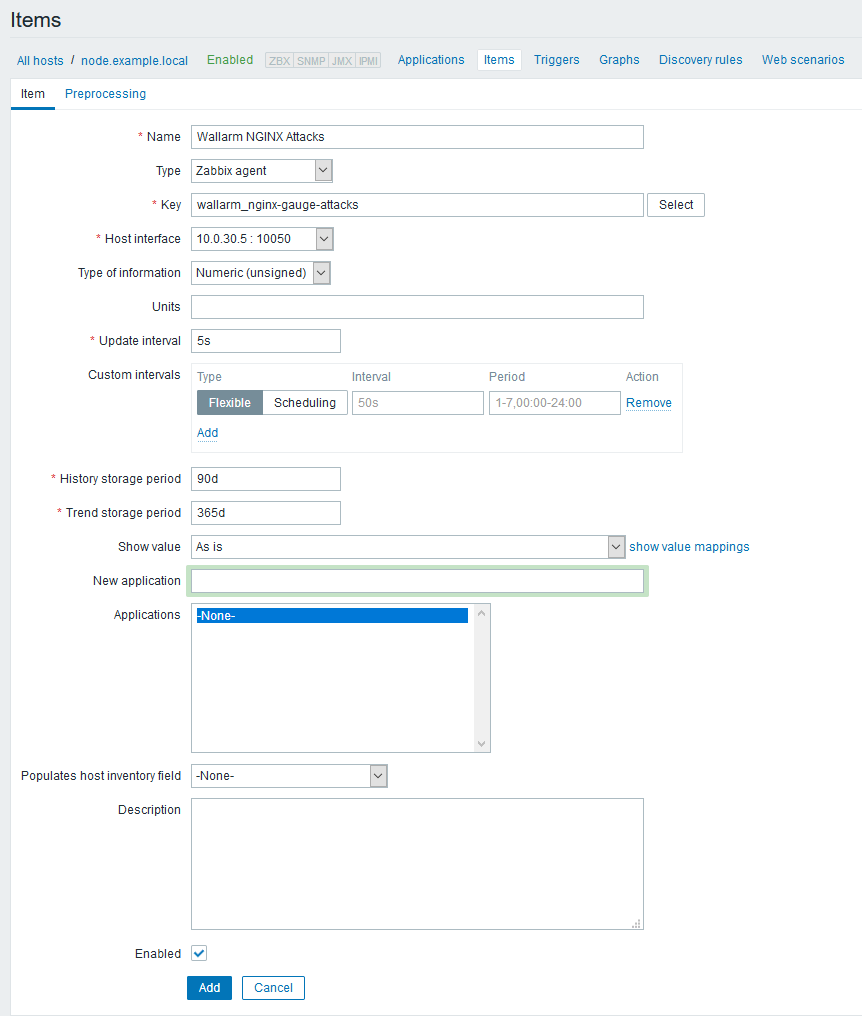
- Click the name of the created host
node.example.localin the list of hosts on the Configuration → Hosts tab. - A page with the host data will open. Switch to the Items tab and click the Create item button.
- Fill a metric name in the Name field (for example,
Wallarm NGINX Attacks). - Leave the Type, Host interface, and Type of information parameters unchanged.
- Enter the key name of the metric in the Key field (as specified in
UserParameter=in the Zabbix agent configuration; for example,wallarm_nginx-gauge-abnormal). - If necessary, adjust the update frequency of the metric value and other parameters.
- Make sure that the Enabled checkbox is checked.
- Complete the process of adding a metric by clicking the Add button.
- Click the name of the created host
-
Configure the visualization of the added metrics:
- Click the Zabbix logo in the upper left corner of the web interface to access the dashboard.
-
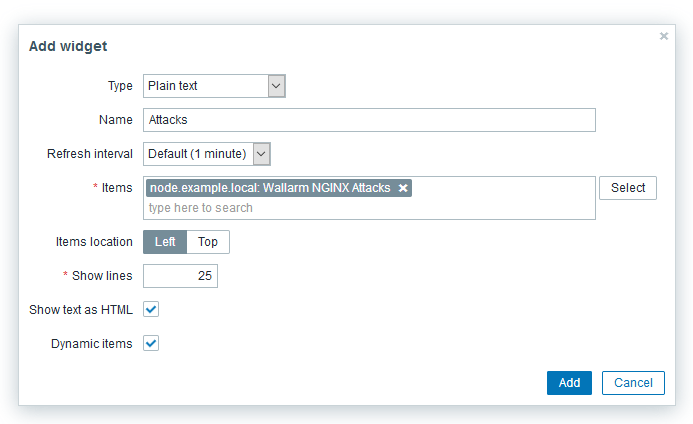
Click the Edit dashboard button to make changes to the dashboard:
- Add a widget by clicking the Add widget button.
- Select the required widget type (for example, “Plain Text”) from the Type drop-down list.
- Fill any suitable name in the Name field.
- Add the required metric to the Items list (e.g., the newly created
Wallarm NGINX Attacks). - Make sure that the Show text as HTML and Dynamic Items checkboxes are checked.
- Complete the Add widget wizard by clicking the Add button.
-
Save the changes that you made to the dashboard by clicking the Save changes button.
-
Check the monitoring operation:
-
Make sure that the current number of processed requests in the Zabbix widget matches the output of
wallarm-statuson the filter node.- Execute the
curl http://127.0.0.8/wallarm-statuscommand if the default configuration of the statistics service is in use. - Otherwise, see the
/etc/nginx/conf.d/wallarm-status.confconfiguration file (/etc/nginx/wallarm-status.conffor all-in-one installer) to construct the correct command similar to the one above.
{"requests":64,"attacks":16,"blocked":0,"abnormal":64,"tnt_errors":0,"api_errors":0,"requests_lost":0,"segfaults":0,"memfaults":0,"softmemfaults":0,"time_detect":0,"db_id":46,"custom_ruleset_id":4,"proton_instances": { "total":2,"success":2,"fallback":0,"failed":0 },"stalled_workers_count":0,"stalled_workers":[] }
- Execute the
-
Perform a test attack on an application protected by the filter node. To do this, you can send a malicious request to the application either with the
curlutility or a browser. -
Make sure that the request counter has increased in both the
wallarm-statusoutput and the Zabbix widget:{"requests":64,"attacks":16,"blocked":0,"abnormal":64,"tnt_errors":0,"api_errors":0,"requests_lost":0,"segfaults":0,"memfaults":0,"softmemfaults":0,"time_detect":0,"db_id":46,"custom_ruleset_id":4,"proton_instances": { "total":2,"success":2,"fallback":0,"failed":0 },"stalled_workers_count":0,"stalled_workers":[] }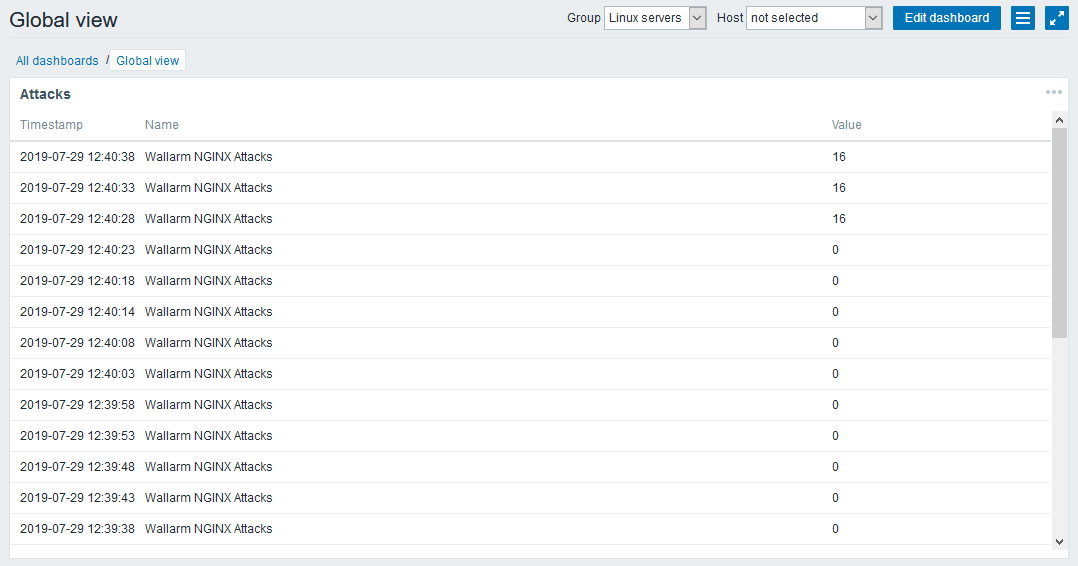
-
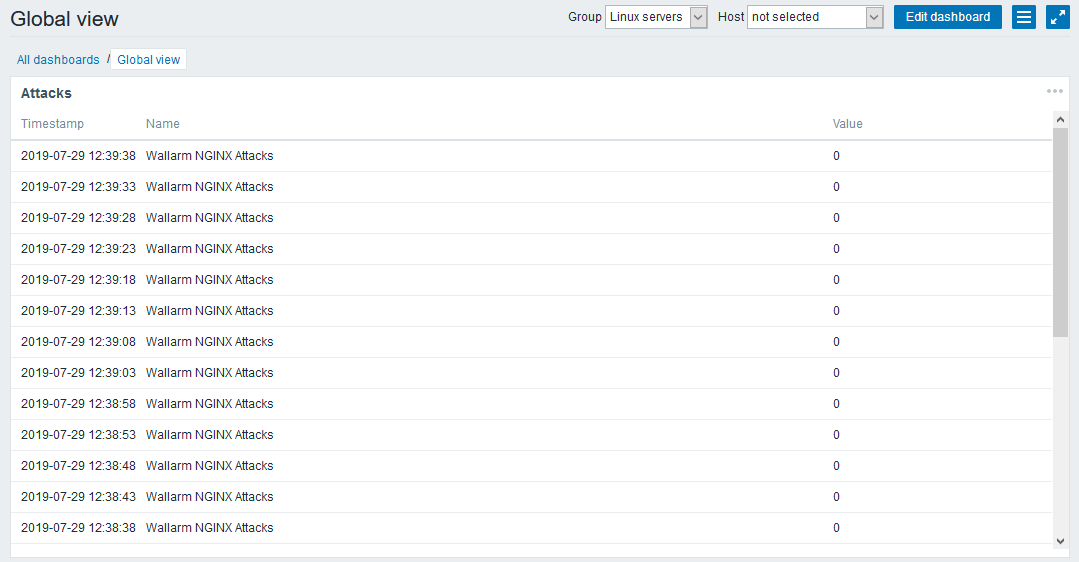
The Zabbix dashboard now displays the wallarm_nginx/gauge-abnormal metric of the node.example.local filter node.