# Exporting Metrics to InfluxDB via the `collectd` Network Plugin
This document provides an example of using the Network plugin to export metrics to the InfluxDB temporal database. It will also demonstrate how to visualize the metrics collected in InfluxDB using Grafana.
## Example Workflow
!!! info "Example of metric"
This example shows how to work with the single [`wallarm_nginx/gauge-abnormal`](https://docs.wallarm.com/5.x/admin-en/monitoring/available-metrics.md#number-of-requests) metric, which shows the number of requests processed by the filter node.
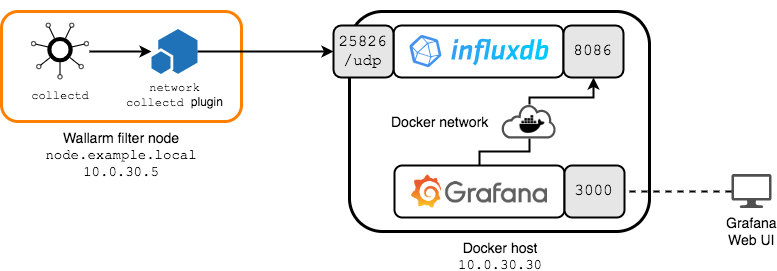
The following deployment scheme is used in this document:
* The Wallarm filter node is deployed on a host accessible via the `10.0.30.5` IP address and the `node.example.local` fully qualified domain name.
The `network` plugin for `collectd` on the filter node is configured in such a way that all metrics will be sent to the `10.0.30.30` InfluxDB server on port `25826/UDP`.
!!! info "Network plugin features"
Please note that the plugin operates over UDP (see [using examples](https://collectd.org/wiki/index.php/Networking_introduction) and [documentation](https://www.collectd.org/documentation/manpages/collectd.conf.html) of the `network` plugin).
* Both `influxdb` and grafana services are deployed as Docker containers on a separate host with the `10.0.30.30` IP address.
The `influxdb` service with the InfluxDB database is configured as follows:
* A `collectd` data source has been created (the `collectd` input according to InfluxDB terminology), which listens on the `25826/UDP` port and writes incoming metrics to a database called `collectd`.
* Communication with the InfluxDB API occurs via the `8086/TCP` port.
* The service shares a `sample-net` Docker network with the `grafana` service.
The `grafana` service with Grafana is configured as follows:
* The Grafana web console is available at `http://10.0.30.30:3000`.
* The service shares the `sample-net` Docker network with the `influxdb` service.
## Configuring Metrics Export to InfluxDB
!!! info "Prerequisites"
It is assumed that
* [Docker Community Edition](https://docs.docker.com/install/) and [`docker-compose`](https://docs.docker.com/compose/install/) are already installed on the `10.0.30.30` Docker host.
* The `node.example.local` filter node is already deployed, configured, available for further configuration (for example, via the SSH protocol), and working.
### Deploying InfluxDB and Grafana
Deploy InfluxDB and Grafana on the Docker host:
1. Create a working directory, for example, `/tmp/influxdb-grafana`, and navigate to it:
```
mkdir /tmp/influxdb-grafana
cd /tmp/influxdb-grafana
```
2. For the InfluxDB data source to work, you will need a file named `types.db` that contains the `collectd` value types.
This file describes the dataset specifications used by `collectd`. Such datasets include definitions of measurable types. Detailed information about this file is available [here](https://www.collectd.org/documentation/manpages/types.db.html).
[Download the `types.db` file](https://github.com/collectd/collectd/blob/master/src/types.db) from the GitHub repository of the `collectd` project and put it in the working directory.
3. Get the basic InfluxDB configuration file by running the following command:
```
docker run --rm influxdb influxd config > influxdb.conf
```
4. Enable the `collectd` data source in the `influxdb.conf` InfluxDB configuration file by changing the value of the `enabled` parameter in the `[[collectd]]` section from `false` to `true`.
Leave other parameters unchanged.
The section should look like this:
```
[[collectd]]
enabled = true
bind-address = ":25826"
database = "collectd"
retention-policy = ""
batch-size = 5000
batch-pending = 10
batch-timeout = "10s"
read-buffer = 0
typesdb = "/usr/share/collectd/types.db"
security-level = "none"
auth-file = "/etc/collectd/auth_file"
parse-multivalue-plugin = "split"
```
5. Create a `docker-compose.yaml` file in the working directory with the following content:
```
version: "3"
services:
influxdb:
image: influxdb
container_name: influxdb
ports:
- 8086:8086
- 25826:25826/udp
networks:
- sample-net
volumes:
- ./:/var/lib/influxdb
- ./influxdb.conf:/etc/influxdb/influxdb.conf:ro
- ./types.db:/usr/share/collectd/types.db:ro
grafana:
image: grafana/grafana
container_name: grafana
restart: always
ports:
- 3000:3000
networks:
- sample-net
networks:
sample-net:
```
According to the settings in `volumes:`, InfluxDB will use
1. The working directory as storage for the database.
2. The `influxdb.conf` configuration file that is located in the working directory.
3. The `types.db` file with the types of measurable values that is located in the working directory.
6. Build the services by executing the `docker-compose build` command.
7. Run the services by executing the `docker-compose up -d influxdb grafana` command.
8. Create a database named `collectd` for the corresponding InfluxDB data source by executing the following command:
```
curl -i -X POST http://10.0.30.30:8086/query --data-urlencode "q=CREATE DATABASE collectd"
```
The InfluxDB server should return a response similar to:
```
HTTP/1.1 200 OK
Content-Type: application/json
Request-Id: 23604241-b086-11e9-8001-0242ac190002
X-Influxdb-Build: OSS
X-Influxdb-Version: 1.7.7
X-Request-Id: 23604241-b086-11e9-8001-0242ac190002
Date: Sat, 27 Jul 2019 15:49:37 GMT
Transfer-Encoding: chunked
{"results":[{"statement_id":0}]}
```
At this point, InfluxDB should be running, ready to receive metrics from `collectd`, and Grafana should be ready to monitor and visualize the data stored in InfluxDB.
### Configuring `collectd`
Configure `collectd` to export metrics to InfluxDB:
**Docker image, cloud image, all-in-one installer:**
1. Connect to the filter node (for example, by using the SSH protocol). Make sure you are logged in as root or another account with superuser privileges.
1. Add the following configuration to the `/opt/wallarm/etc/collectd/wallarm-collectd.conf` file:
```
LoadPlugin network
Server "Server IPv4/v6 address or FQDN" "Server port"
```
The following entities are configured here:
1. The server, to send metrics to (`10.0.30.30`)
1. The port that server listens on (`25826/UDP`)
1. Restart the `wallarm` service by running the following command:
```bash
sudo systemctl restart wallarm
```
**Other installations:**
1. Connect to the filter node (for example, by using the SSH protocol). Make sure you are logged in as root or another account with superuser privileges.
1. Create a file named `/etc/collectd/collectd.conf.d/export-to-influxdb.conf` with the following content:
```
LoadPlugin network
Server "10.0.30.30" "25826"
```
The following entities are configured here:
1. The server, to send metrics to (`10.0.30.30`)
1. The port that server listens on (`25826/UDP`)
1. Restart the `collectd` service by running the appropriate command:
**Ubuntu 14.04 LTS:**
```bash
sudo service collectd restart
```
**Other supported distributions:**
```bash
sudo systemctl restart collectd
```
Now InfluxDB receives all the metrics of the filter node. You can visualize the metrics you are interested in and monitor them [with Grafana](https://docs.wallarm.com/5.x/admin-en/monitoring/working-with-grafana.md).