Exporting Metrics to Zabbix via the collectd-nagios Utility
This document provides an example of exporting filter node metrics to the Zabbix monitoring system using the collectd-nagios utility.
Example Workflow
Example of metric
This example shows how to work with the single wallarm_nginx/gauge-abnormal metric, which shows the number of requests processed by the filter node.
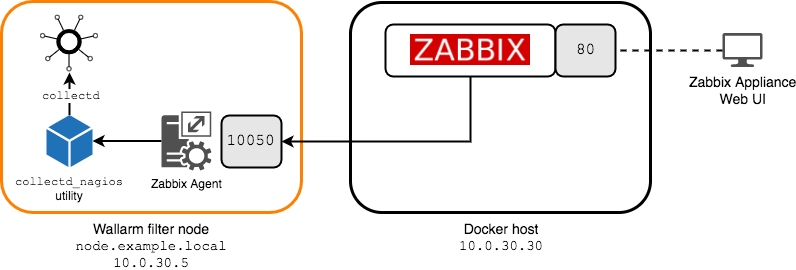
The following deployment scheme is used in this document:
-
The Wallarm filter node is deployed on a host accessible via the
10.0.30.5IP address and thenode.example.localfully qualified domain name.The host has the Zabbix agent 4.0 LTS deployed that
- Downloads the filter node metrics using the
collectd-nagiosutility. - Listens to incoming connections on the
10050/TCPport (thus passive checks will take place with the use of Zabbix Appliance). - Passes metric values to Zabbix Appliance.
- Downloads the filter node metrics using the
-
On a dedicated host with the
10.0.30.30IP address (hereinafter referred to as the Docker host), the Zabbix Appliance 4.0 LTS is deployed in the form of a Docker container.The Zabbix Appliance includes
- A Zabbix server that periodically polls the Zabbix agent installed on the filter node host to get information about changes to any monitored metrics).
- The Zabbix server management web interface, available on the
80/TCPport.
Configuring Metrics Export to Zabbix
Prerequisites
It is assumed that
- The
collectdservice has been configured for working via a Unix domain socket (see here for details). - Docker Community Edition is already installed on the
10.0.30.30Docker host. - The
node.example.localfilter node is already deployed, configured, available for further configuration (for example, via the SSH protocol), and working.
Deploying Zabbix
To deploy the Zabbix Appliance 4.0 LTS, execute the following command on the Docker host:
Now you have a working Zabbix monitoring system.
Deploying the Zabbix Agent
Install the Zabbix Agent 4.0 LTS on a host with the filter node:
-
Connect to the filter node (for example, using the SSH protocol). Make sure you are running as
rootor another account with superuser privileges. -
Connect the Zabbix repositories (use the “Install Zabbix repository” entry of the instructions for your operating system).
-
Install the Zabbix agent by executing the appropriate command:
-
Configure the Zabbix Agent to work with the Zabbix Appliance. To do this, make the following changes to the
/etc/zabbix/zabbix_agentd.confconfiguration file:
Configuring Metrics Collection Using the Zabbix Agent
Connect to the filter node (for example, using the SSH protocol) and configure the collection of metrics using the Zabbix agent. To do this, perform the following steps on the host with the filter node:
1. Install the collectd_nagios utility
Execute the appropriate command:
2. Configure the collectd-nagios utility to run with elevated privileges on behalf of the zabbix user
Use the visudo utility to add the following line to the /etc/sudoers file:
This allows the zabbix user to run the collectd-nagios utility with superuser privileges using the sudo utility without the need to provide a password.
Running collectd-nagios with superuser privileges
The utility must be run with superuser privileges because it uses the collectd Unix domain socket to receive data. Only a superuser can access this socket.
As an alternative to adding the zabbix user to the sudoers list, you can configure the Zabbix agent to run as root (this may pose a security risk, so this is not recommended). This can be achieved by enabling the AllowRoot option in the agent configuration file.
3. Make sure that the zabbix user can receive metric values from collectd
Run the following test command on the filter node:
sudo -u zabbix sudo /usr/bin/collectd-nagios -s /var/run/wallarm-collectd-unixsock -n wallarm_nginx/gauge-abnormal -H node.example.local
This command invokes the zabbix user to get the value of the wallarm_nginx/gauge-abnormal metric for the node.example.local host with the filter node.
Example of the command output:
4. Add custom parameters to the Zabbix agent configuration file on the filter node host to get the metrics you need
For example, to create a custom parameter wallarm_nginx-gauge-abnormal that corresponds to the wallarm_nginx/gauge-abnormal metric for a filter node with the fully qualified domain name node.example.local, add the following line to the configuration file:
UserParameter=wallarm_nginx-gauge-abnormal, sudo /usr/bin/collectd-nagios -s /var/run/wallarm-collectd-unixsock -n wallarm_nginx/gauge-abnormal -H node.example.local | sed -n "s/.*value\=\(.*\);;;;.*/\1/p"
Extracting a metric value
To extract the value of a metric that goes after value= in the output of the collectd-nagios utility (e.g., OKAY: 0 critical, 0 warning, 1 okay | value=0.000000;;;;), this output is piped to the sed utility that executes the sed script to strip off unnecessary characters.
See the sed documentation for more information on the syntax of its scripts.
5. After all the necessary commands have been added to the Zabbix agent configuration file, restart the agent
Setup Complete
Now you can monitor user parameters related to Wallarm-specific metrics with Zabbix.