Exporting Metrics to Nagios via the collectd-nagios Utility
This document provides an example of exporting filter node metrics to the Nagios monitoring system (the Nagios Core edition is suggested; however, this document is suitable for any Nagios edition) using the collectd-nagios utility.
Assumptions and requirements
- The
collectdservice must be configured for working via a Unix domain socket (see here for details). -
It is assumed that you already have the Nagios Core edition installed.
If not, install Nagios Core (for example, follow these instructions).
You can use another edition of Nagios if necessary (for example, Nagios XI).
The “Nagios” term will be used hereinafter to refer to any edition of Nagios, unless stated otherwise.
-
You must have the ability to connect to the filter node and the Nagios host (for example, via the SSH protocol), and work under the
rootaccount or another account with superuser rights. - The Nagios Remote Plugin Executor service (which will be referred to as NRPE throughout this example) must be installed on the filter node.
Example Workflow
Example of metric
This example shows how to work with the single wallarm_nginx/gauge-abnormal metric, which shows the number of requests processed by the filter node.
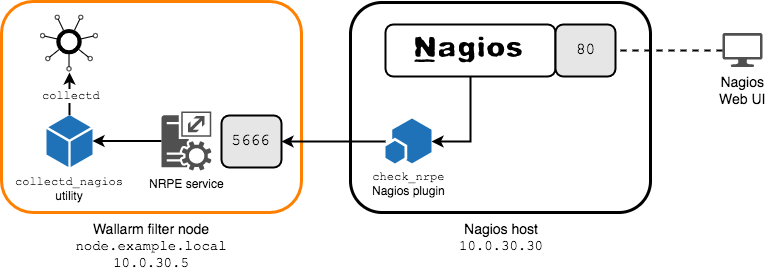
The following deployment scheme is used in this document:
-
The Wallarm filter node is deployed on a host accessible via the
10.0.30.5IP address and thenode.example.localfully qualified domain name. -
Nagios is installed on a separate host accessible via the
10.0.30.30IP address. -
To execute commands on a remote host, the NRPE plugin is used. The plugin comprises
- The
nrpeservice that is installed on the monitored host alongside the filter node. It listens on the5666/TCPstandard NRPE port. - The
check_nrpeNRPE Nagios plugin that is installed on the Nagios host and allows Nagios to execute commands on the remote host where thenrpeservice is installed.
- The
-
NRPE will be used to call the
collectd_nagiosutility that provides thecollectdmetrics in a Nagios‑compatible format.
Configuring Metrics Export to Nagios
A note on this installation example
This document describes how to install and configure the NRPE plugin when Nagios is already installed with default parameters (it is assumed that Nagios is installed in the /usr/local/nagios directory, and uses the nagios user to operate). If you are doing a non-default installation of the plugin or Nagios, adjust the corresponding commands and instructions from the document as needed.
To configure metrics export from the filter node to Nagios, follow these steps:
1. Configure NRPE to Communicate with the Nagios Host
To do this, on a filter node host:
-
Open the NRPE configuration file (default:
/usr/local/nagios/etc/nrpe.cfg). -
Add the IP address or fully qualified domain name of the Nagios server to the
allowed_hostsdirective in this file. For example, if the Nagios host uses the10.0.30.30IP address: -
Restart the NRPE service by executing the appropriate command:
2. Install the Nagios NRPE Plugin on the Nagios Host
To do this, on the Nagios host, take the following steps:
-
Download and unzip the source files for the NRPE plugin, and install the necessary utilities to build and install the plugin (see the NRPE documentation for details).
-
Go to the directory with the plugin source code, build from sources, then install the plugin.
The minimal steps to take are:
3. Make Sure the NRPE Nagios Plugin Successfully Interacts with the NRPE Service
To do this, execute the following command on the Nagios host:
If NRPE is operating normally, the command’s output should contain an NRPE version (e.g., NRPE v3.2.1).
4. Define the check_nrpe Command to Run the NRPE Nagios Plugin with a Single Argument on the Nagios Host
To do this, add to the /usr/local/nagios/etc/objects/commands.cfg file the following lines:
define command{
    command_name check_nrpe
    command_line $USER1$/check_nrpe -H $HOSTADDRESS$ -c $ARG1$
 }
5. Install the collectd_nagios Utility on the Filter Node Host
Execute one of the following commands:
6. Configure the collectd-nagios Utility to Run with Elevated Privileges on Behalf of the nagios User
To do this, perform the following steps on the filter node host:
-
Using the
visudoutility, add the following line to the/etc/sudoersfile:This allows the
nagiosuser to run thecollectd-nagiosutility with superuser privileges usingsudowithout the need to provide any passwords.Running
collectd-nagioswith superuser privilegesThe utility must be run with superuser privileges because it uses the
collectdUnix domain socket to receive data. Only a superuser can access this socket. -
Make sure that the
nagiosuser can receive metric values fromcollectdby executing the following test command:sudo -u nagios sudo /usr/bin/collectd-nagios -s /var/run/wallarm-collectd-unixsock -n wallarm_nginx/gauge-abnormal -H node.example.localThis command allows the
nagiosuser to get the value of thewallarm_nginx/gauge-abnormalmetric (the number of processed requests) for thenode.example.localhost.Example of command output:
-
Add a prefix to the NRPE service configuration file so that it will be able to execute commands using the
sudoutility:
7. Add Commands to the NRPE Service Configuration File on the Filter Node to Get the Required Metrics
For example, to create a command named check_wallarm_nginx_abnormal that will receive the wallarm_nginx/gauge-abnormal metric for the filter node with the node.example.local fully qualified domain name, add the following line to the NRPE service’s configuration file:
command[check_wallarm_nginx_abnormal]=/usr/bin/collectd-nagios -s /var/run/wallarm-collectd-unixsock -n wallarm_nginx/gauge-abnormal -H node.example.local
How to set threshold values for a metric
If necessary, you can specify a range of values for which the collectd-nagios utility will return the WARNING or CRITICAL status by using the corresponding -w and -c options (detailed information is available in the utility documentation).
After you have added all necessary commands to the NRPE service configuration file, restart the service by executing the appropriate command:
8. On the Nagios Host, Use the Configuration Files to Specify the Filter Node Host and to Define the Services to Monitor
Services and Metrics
This document assumes that one Nagios service is equivalent to one metric.
For example, this can be done as follows:
-
Create a
/usr/local/nagios/etc/objects/nodes.cfgfile with the following contents:define host{ use linux-server host_name node.example.local address 10.0.30.5 } define service { use generic-service host_name node.example.local check_command check_nrpe!check_wallarm_nginx_abnormal max_check_attempts 5 service_description wallarm_nginx_abnormal }This file defines the
node.example.localhost with the10.0.30.5IP address and the command to check the status of thewallarm_nginx_abnormalservice, which means receiving thewallarm_nginx/gauge-abnormalmetric from the filter node (see the description of thecheck_wallarm_nginx_abnormalcommand). -
Add the following line to the Nagios configuration file (by default,
/usr/local/nagios/etc/nagios.cfg):This is necessary for Nagios to start using the data from the
nodes.cfgfile on the next start. -
Restart the Nagios service by running the appropriate command:
Setup is Complete
Nagios is now monitoring the service associated with the specific metric of the filter node. If necessary, you can define other commands and services to check the metrics you are interested in.