Splunk Enterprise via Logstash
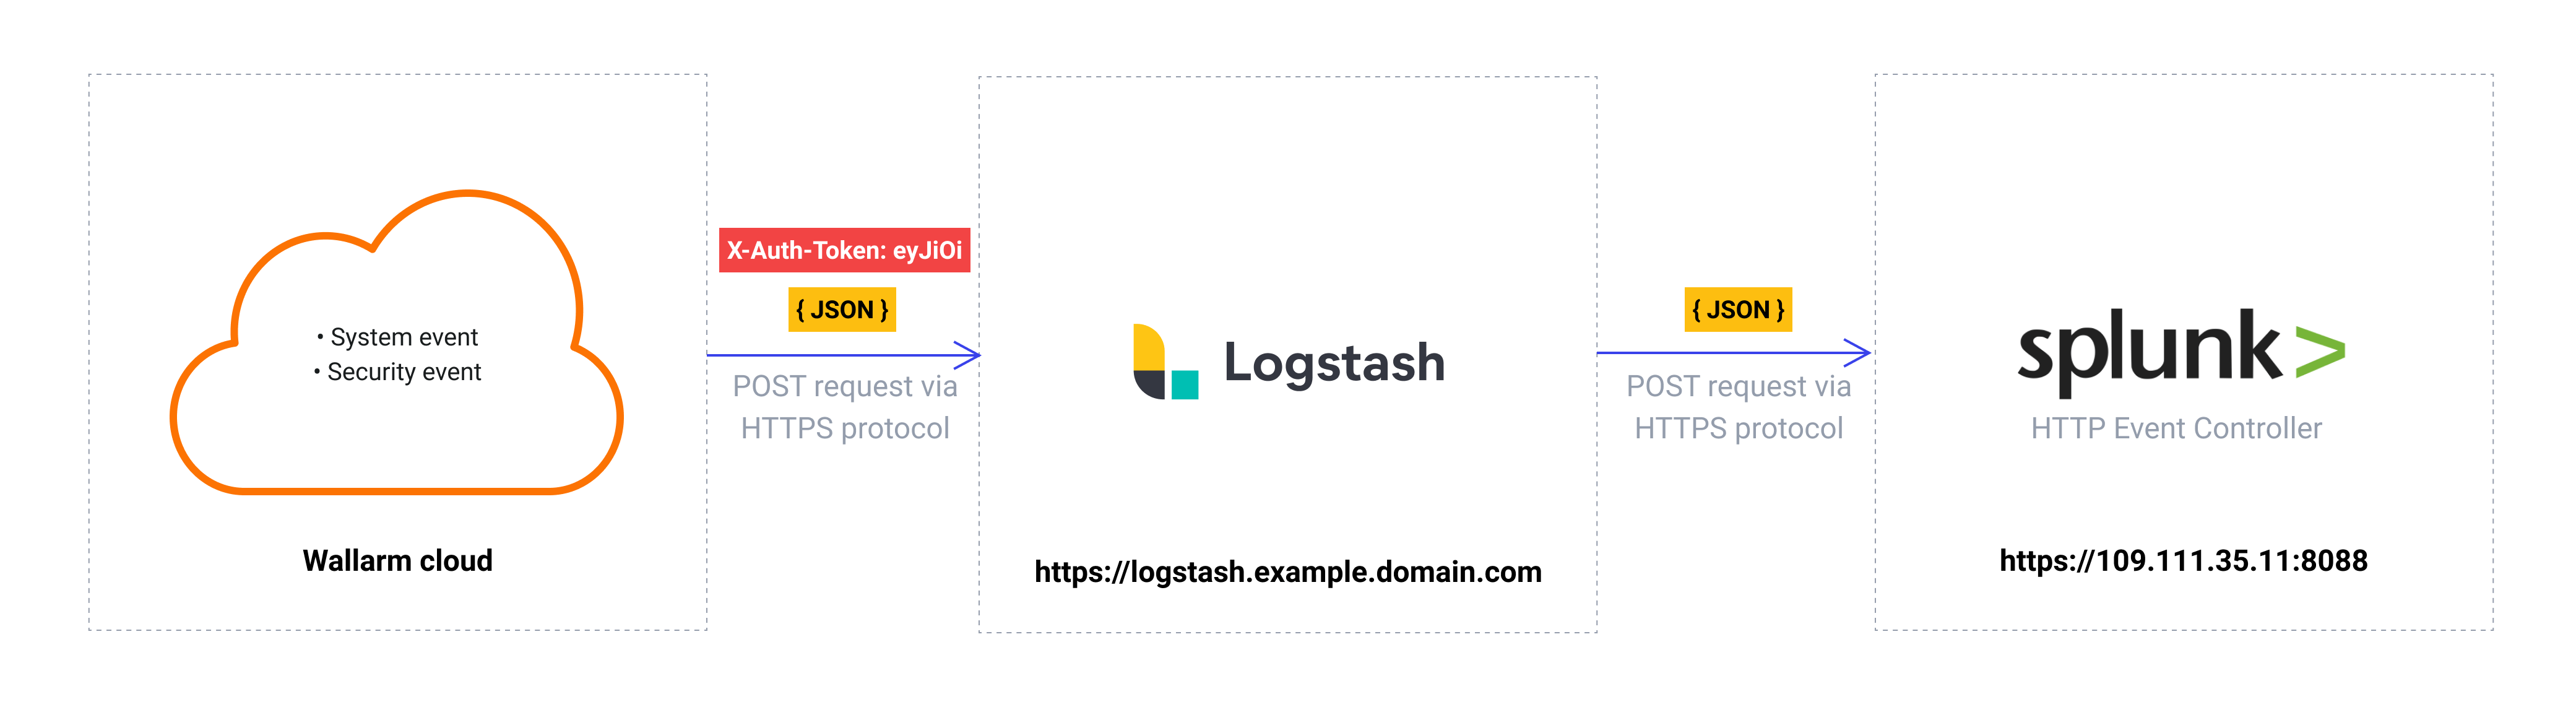
These instructions provide you with the example integration of Wallarm with the Logstash data collector to further forward events to the Splunk SIEM system.
The most common logging scheme in complex systems consists of the following components:
-
Data collector: accepts logs from several sources and forwards logs to the SIEM system
-
SIEM system or log management systems: used to analyze logs and monitor the system status
Used resources
-
Splunk Enterprise with WEB URL
https://109.111.35.11:8000and API URLhttps://109.111.35.11:8088 -
Logstash 7.7.0 installed on Debian 11.x (bullseye) and available on
https://logstash.example.domain.com -
Administrator access to Wallarm Console in EU cloud to configure the Logstash integration
Wallarm Cloud IP addresses
To provide Wallarm Cloud access to your system, you may need a list of its public IP addresses:
Since the links to the Splunk Enterprise and Logstash services are cited as examples, they do not respond.
Splunk Enterprise configuration
Logstash logs are sent to Splunk HTTP Event Controller with the name Wallarm Logstash logs and other default settings:
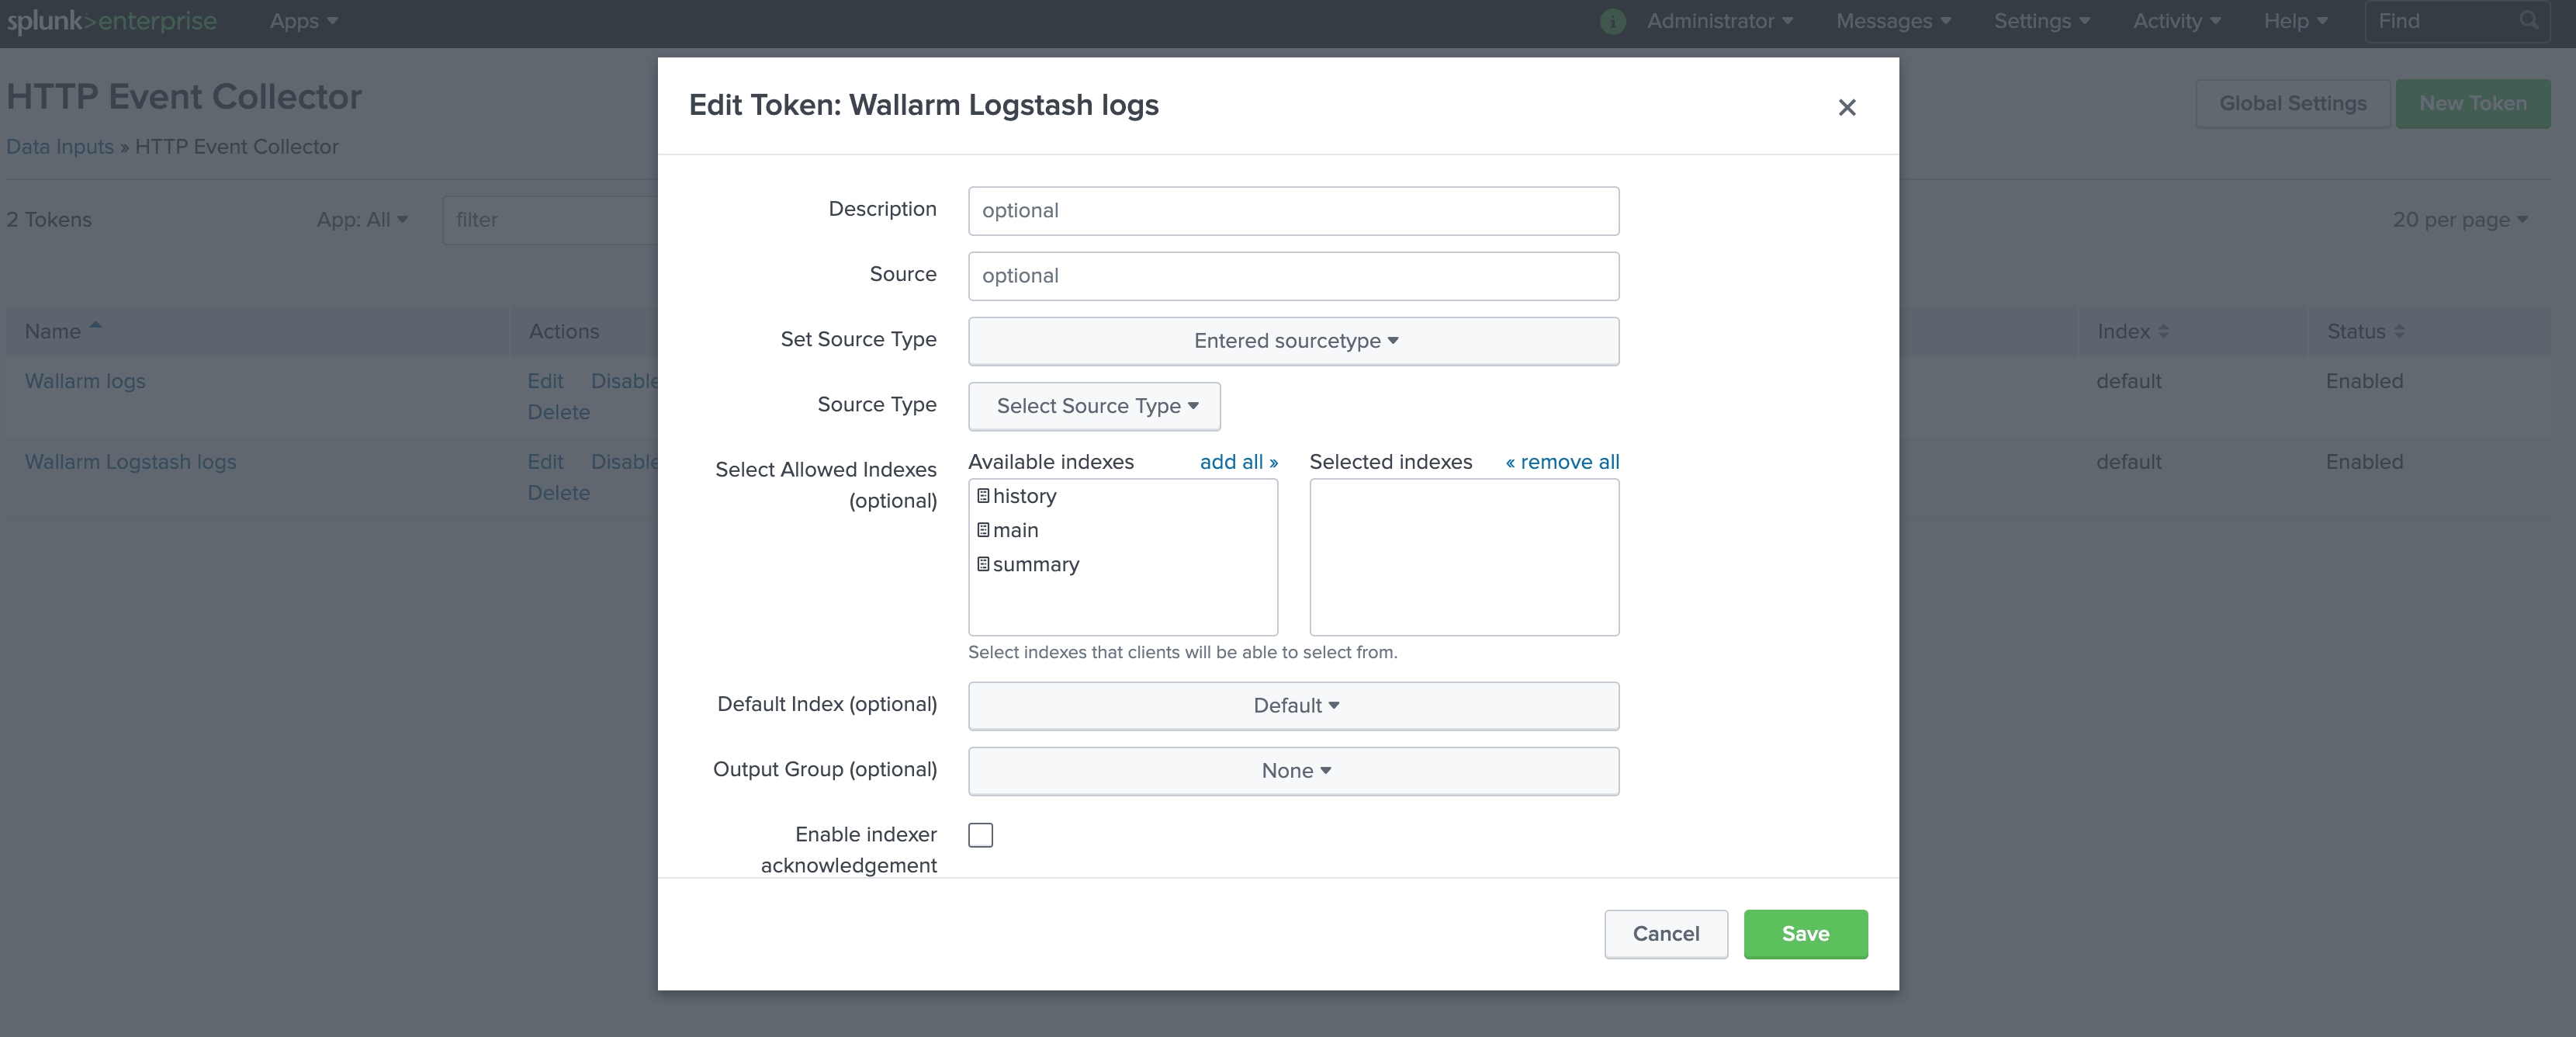
To access the HTTP Event Controller, generated token 93eaeba4-97a9-46c7-abf3-4e0c545fa5cb will be used.
A more detailed description of Splunk HTTP Event Controller setup is available in the official Splunk documentation.
Logstash configuration
Since Wallarm sends logs to the Logstash intermediate data collector via webhooks, the Logstash configuration should meet the following requirements:
-
Accept the POST or PUT requests
-
Accept HTTPS requests
-
Have public URL
-
Forward logs to Splunk Enterprise, this example uses the
httpplugin to forward logs
Logstash is configured in the logstash-sample.conf file:
-
Incoming webhook processing is configured in the
inputsection:- Traffic is sent to port 5044
- Logstash is configured to accept only HTTPS connections
- Logstash TLS certificate signed by a publicly trusted CA is located within the file
/etc/server.crt - Private key for TLS certificate is located within the file
/etc/server.key
-
Forwarding logs to Splunk and log output are configured in the
outputsection:- Logs are forwarded from Logstash to Splunk in the JSON format
- All event logs are forwarded from Logstash to Splunk API endpoint
https://109.111.35.11:8088/services/collector/rawvia POST requests. To authorize requests, the HTTPS Event Collector token is used - Logstash logs are additionally printed on the command line (15th code line). The setting is used to verify that events are logged via Logstash
A more detailed description of configuration files is available in the official Logstash documentation.
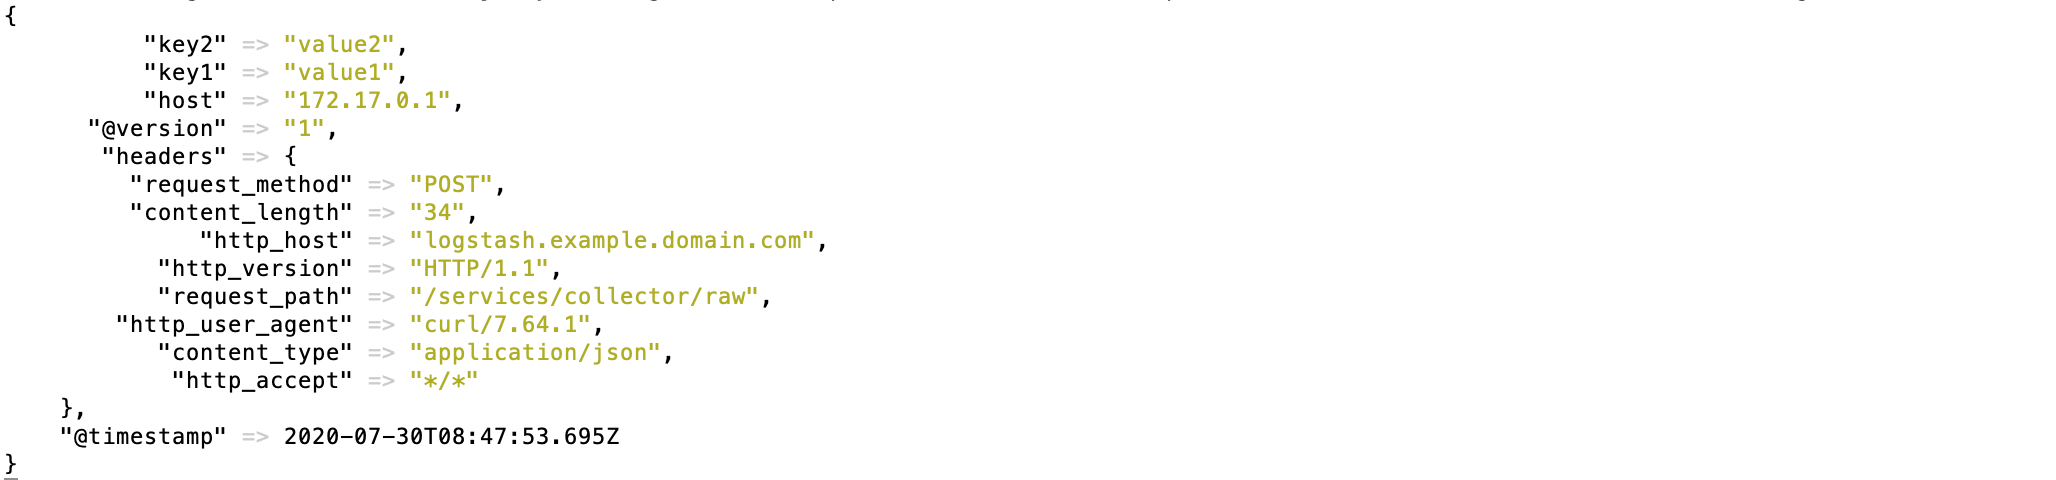
Testing Logstash configuration
To check that Logstash logs are created and forwarded to Splunk, the POST request can be sent to Logstash.
Request example:
curl -X POST 'https://logstash.example.domain.com' -H "Content-Type: application/json" -H "Authorization: Splunk 93eaeba4-97a9-46c7-abf3-4e0c545fa5cb" -d '{"key1":"value1", "key2":"value2"}'
Logstash logs:
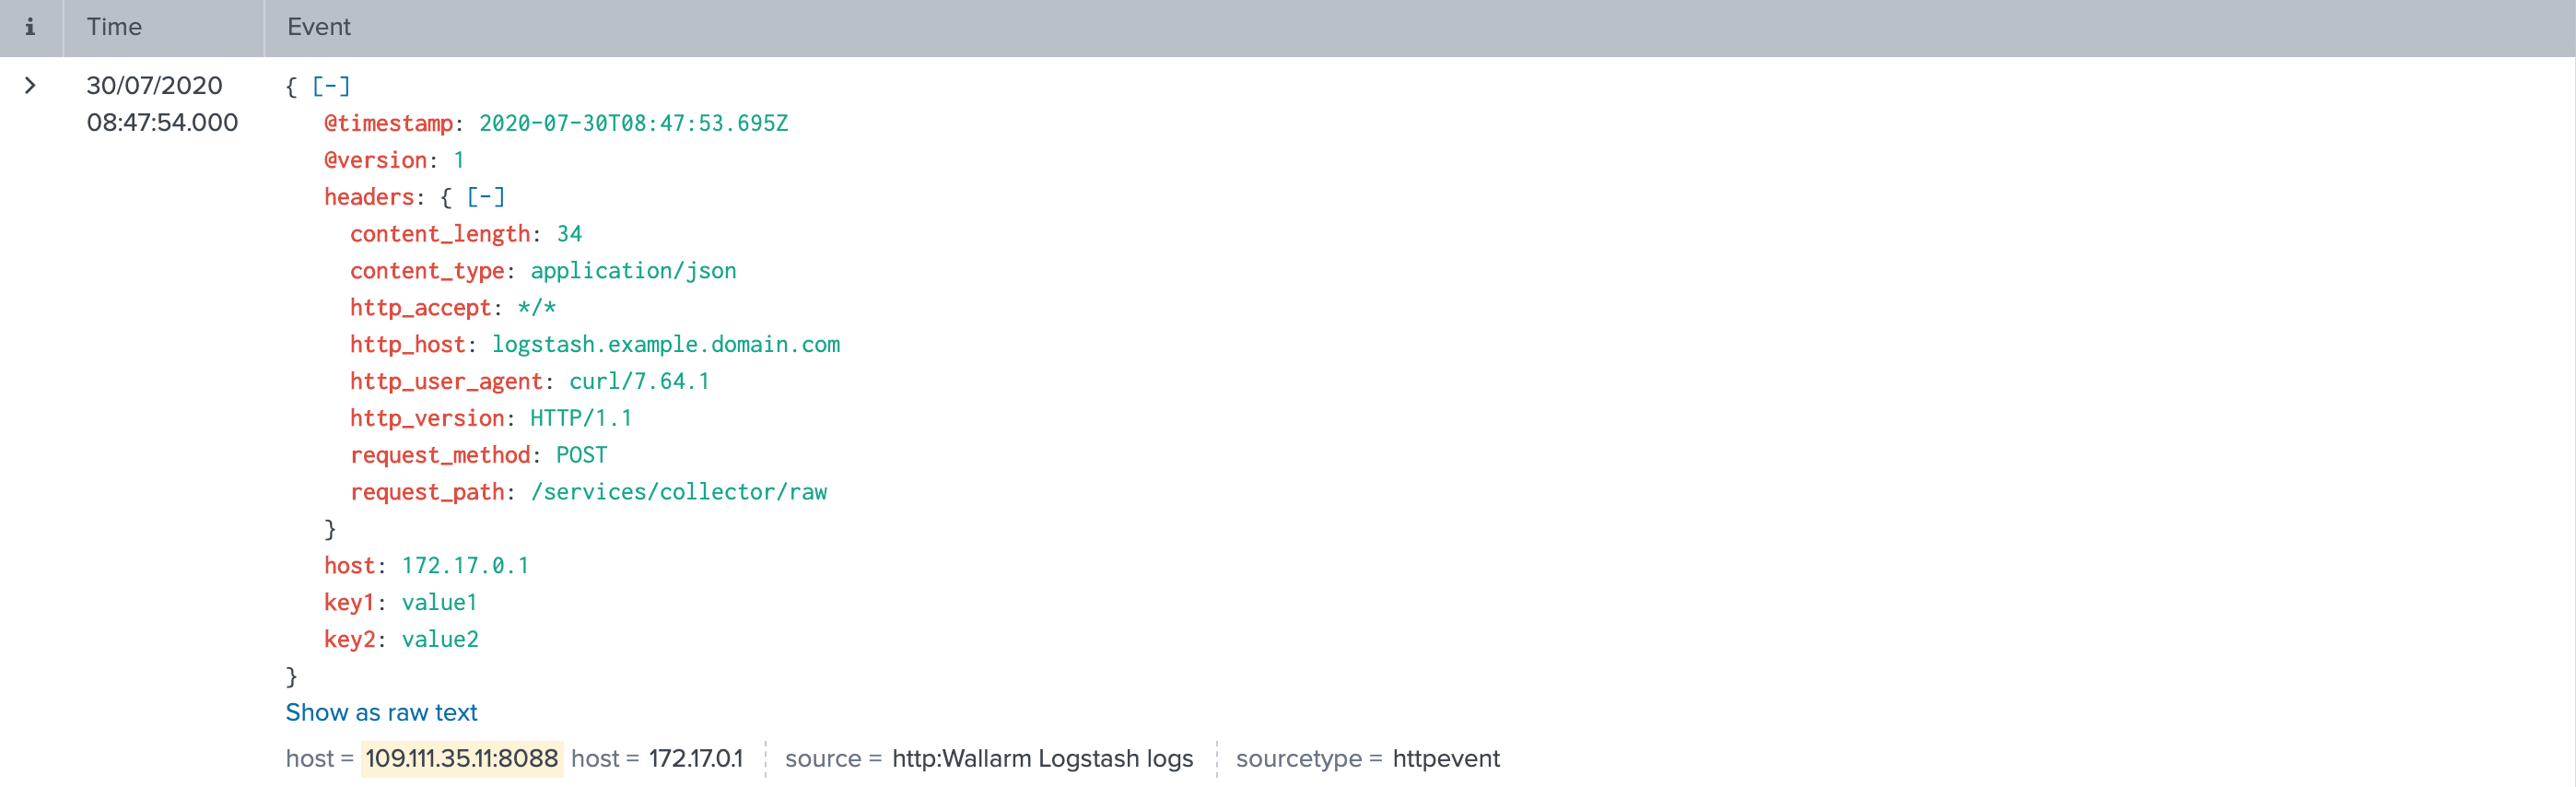
Splunk event:
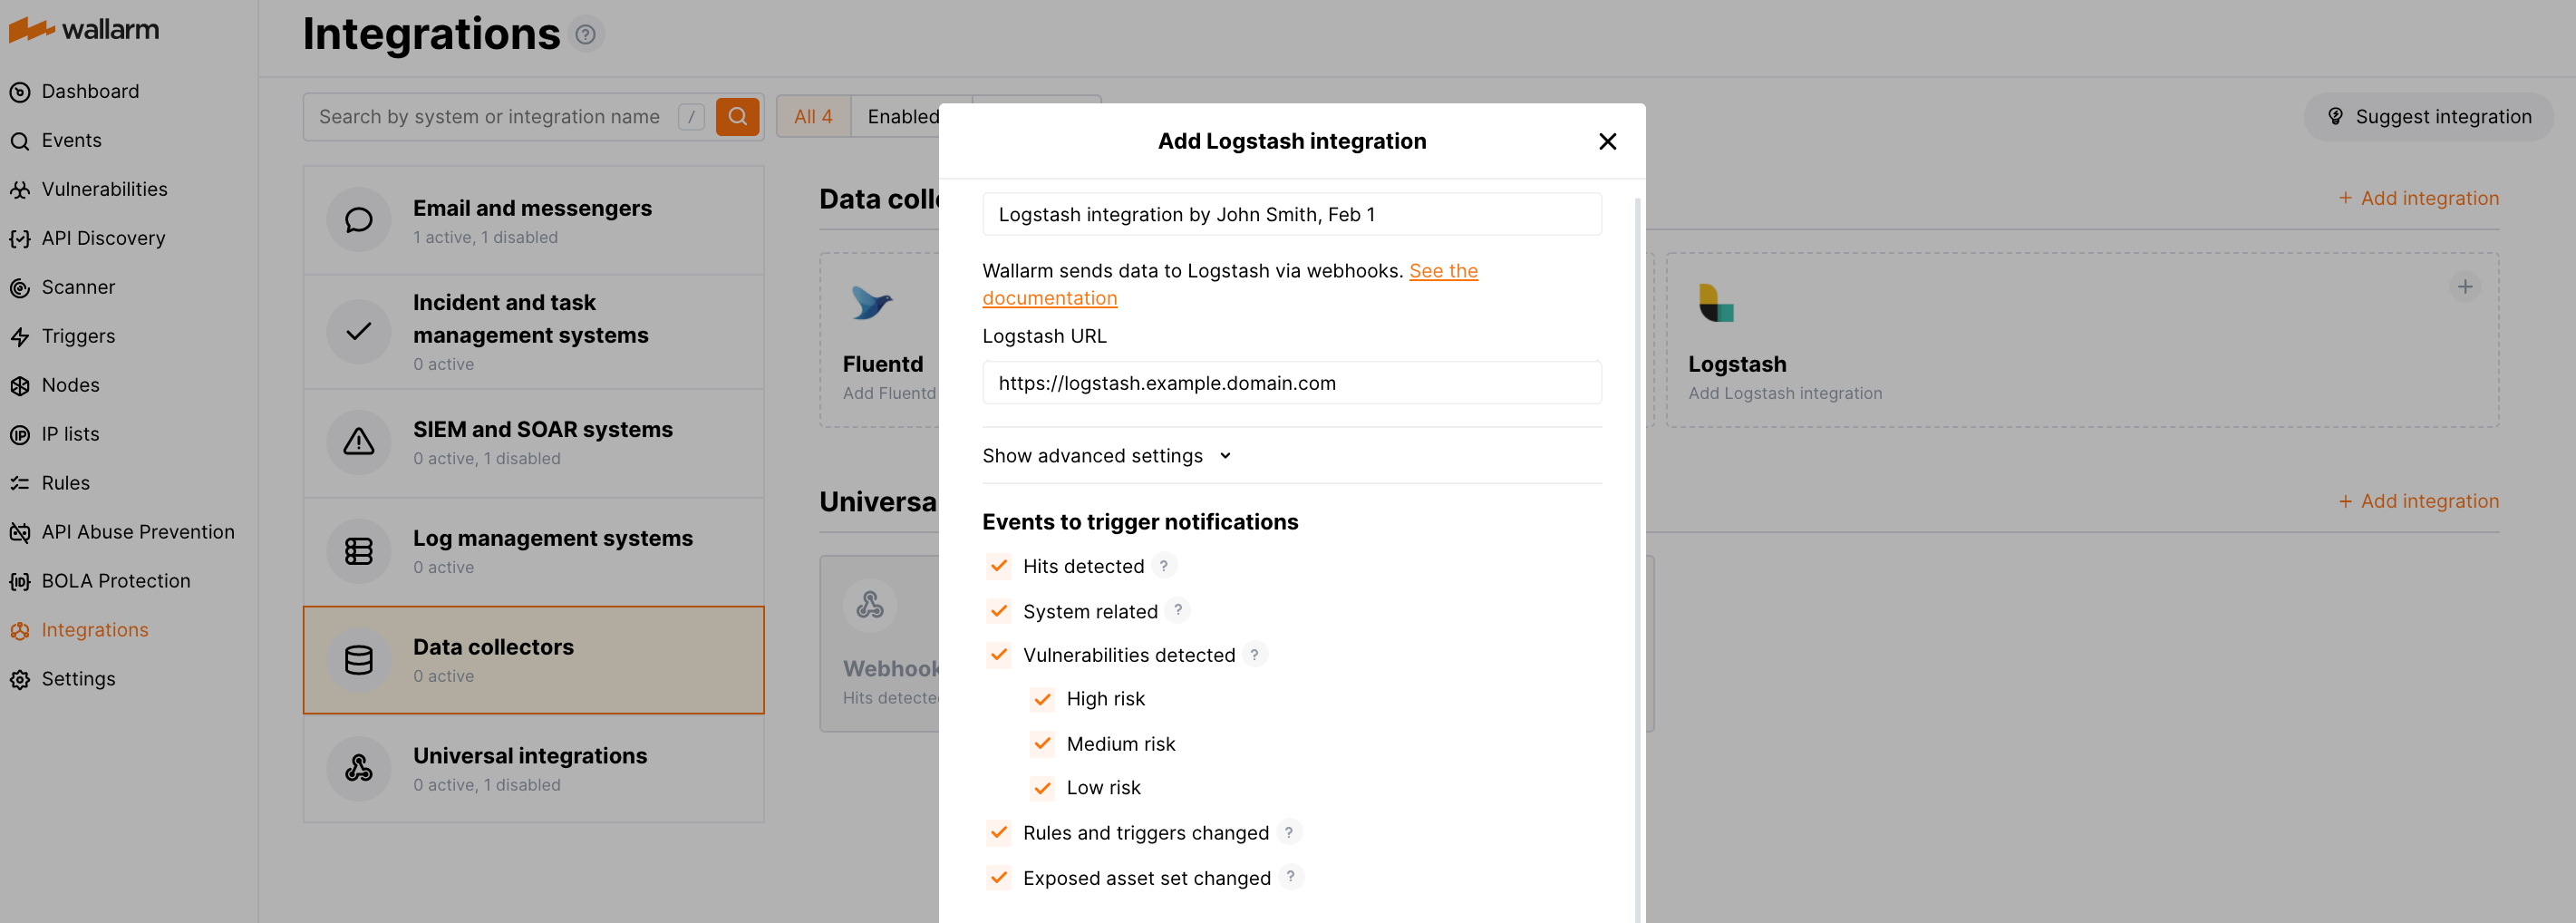
Configuration of Logstash integration
-
Webhooks are sent to
https://logstash.example.domain.com -
Webhooks are sent via POST requests
-
The webhook integration has default advanced settings
-
Webhooks sent to Webhook URLs are all available events: hits, system events, vulnerabilities, scope changes
More details on the Logstash integration configuration
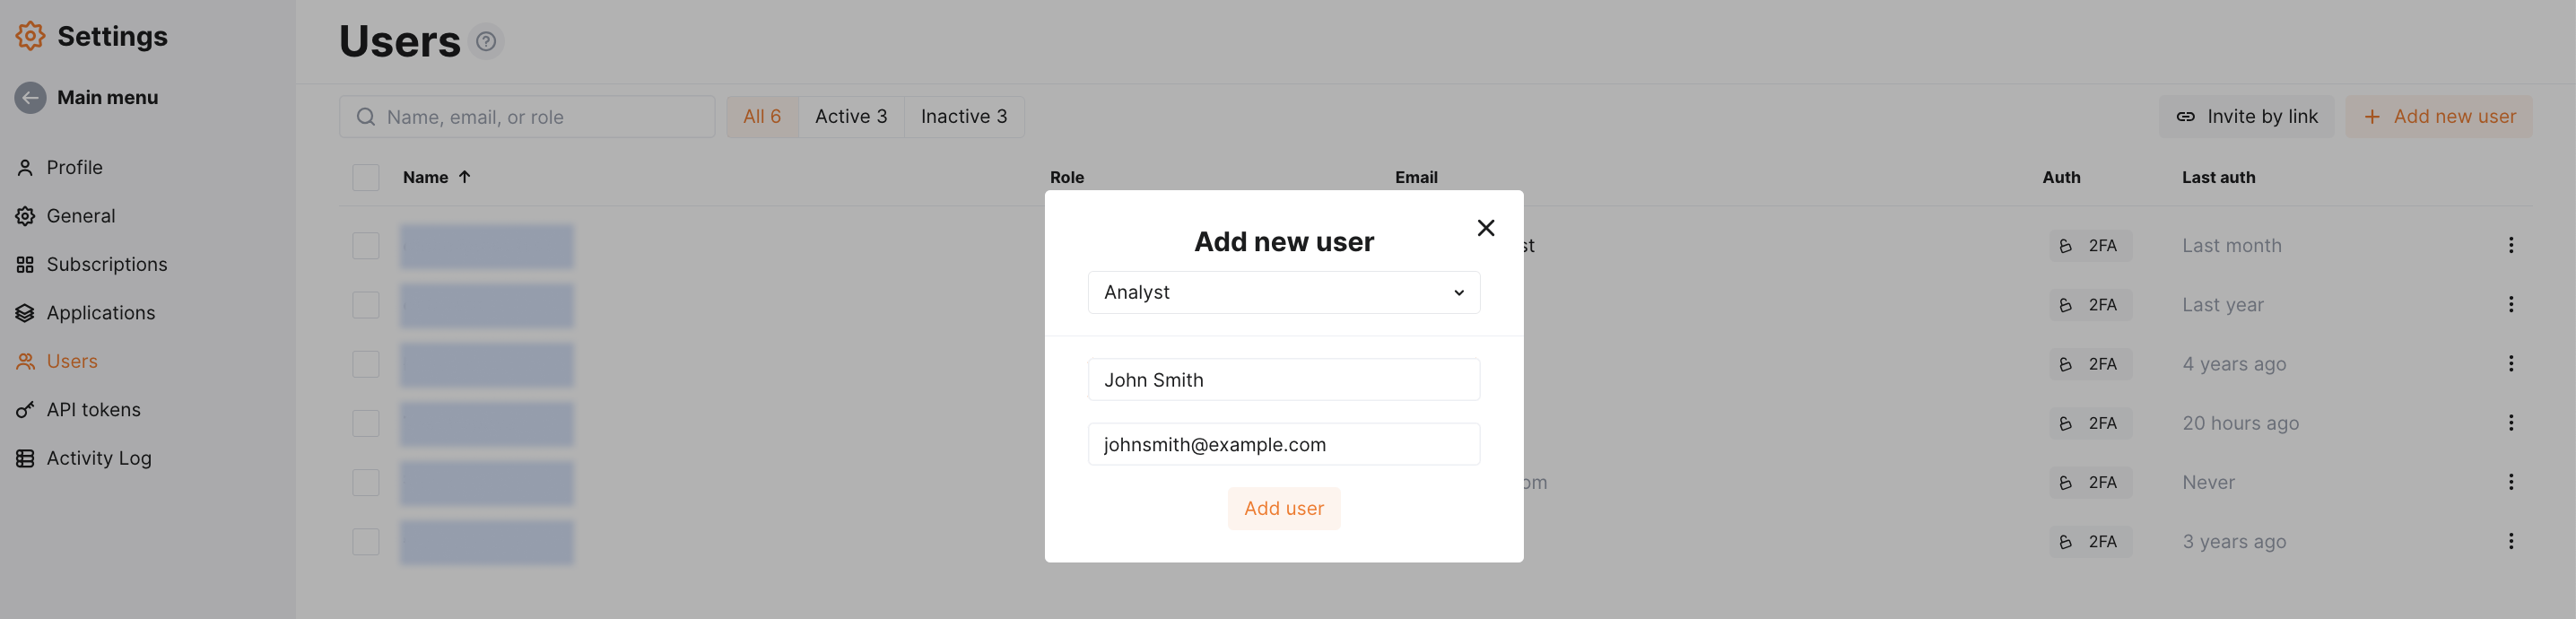
Example testing
To test the configuration, a new user is added in Wallarm Console:
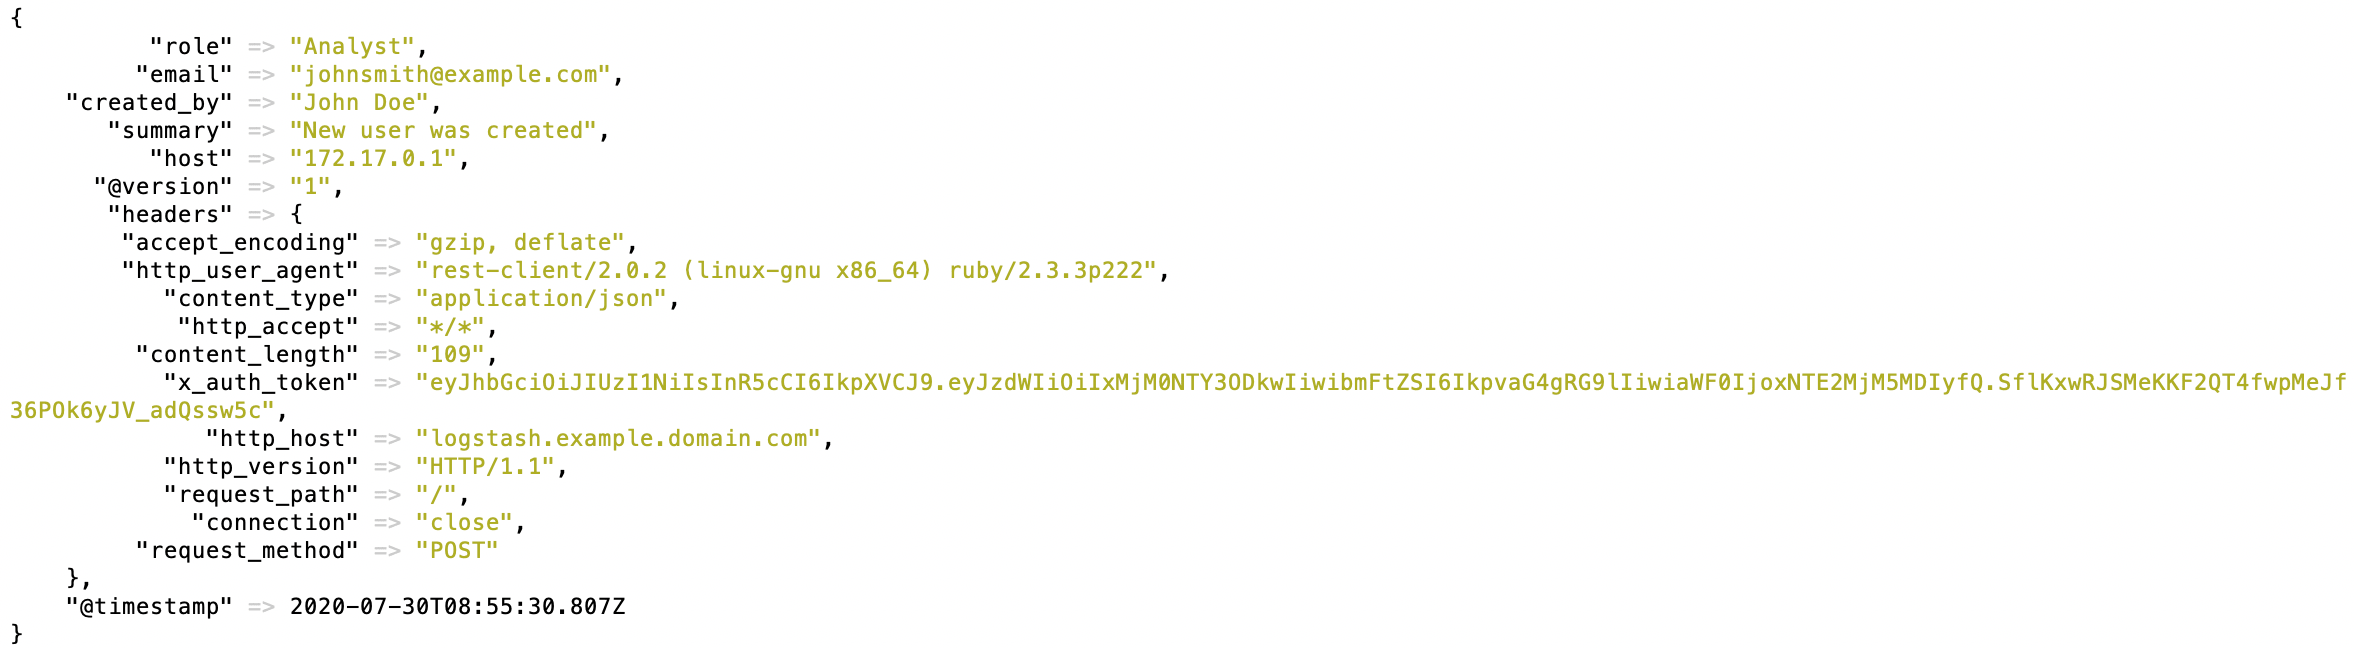
Logstash will log the event as follows:
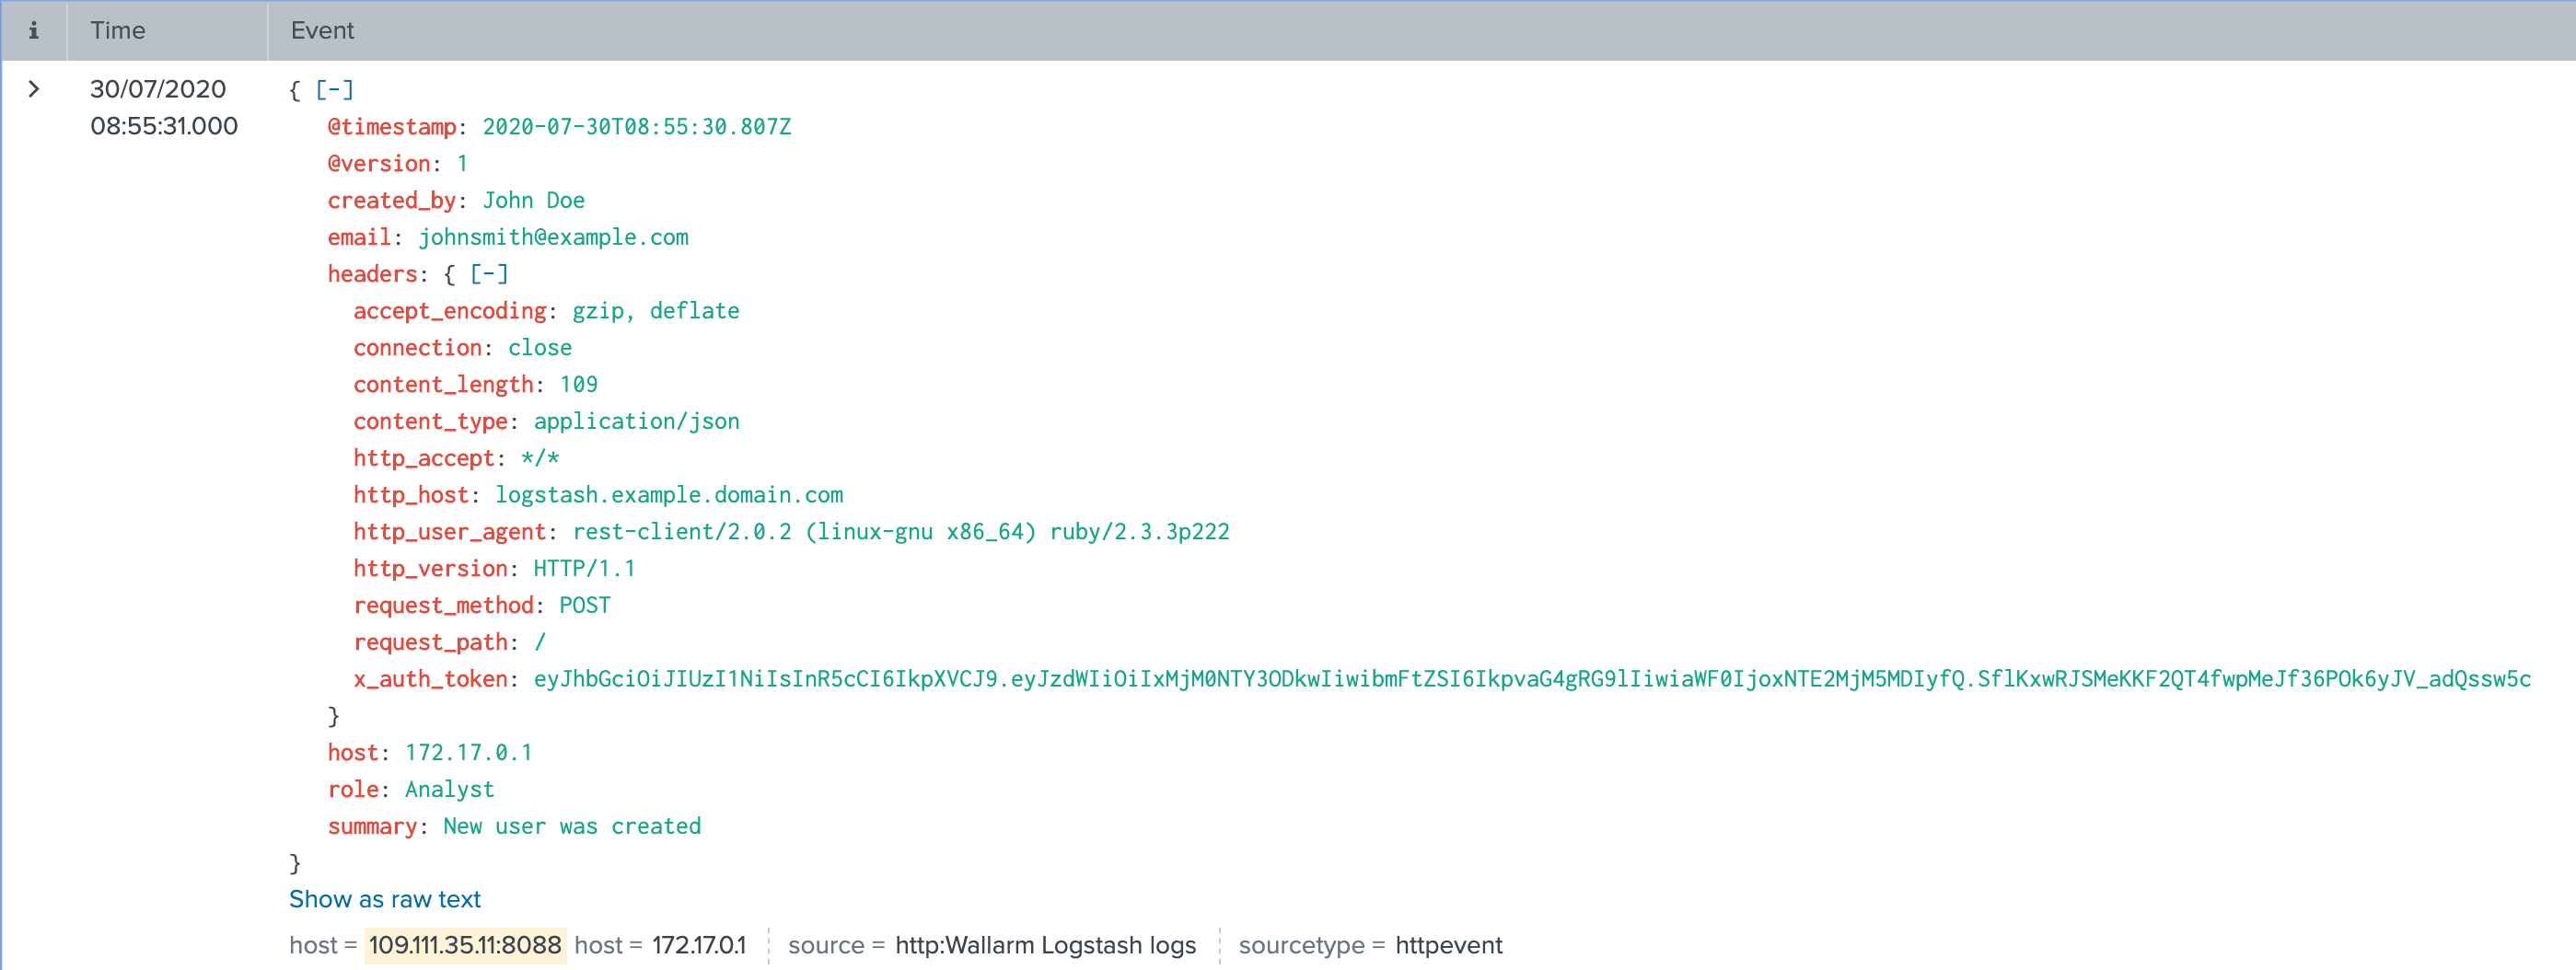
The following entry will be displayed in Splunk events:
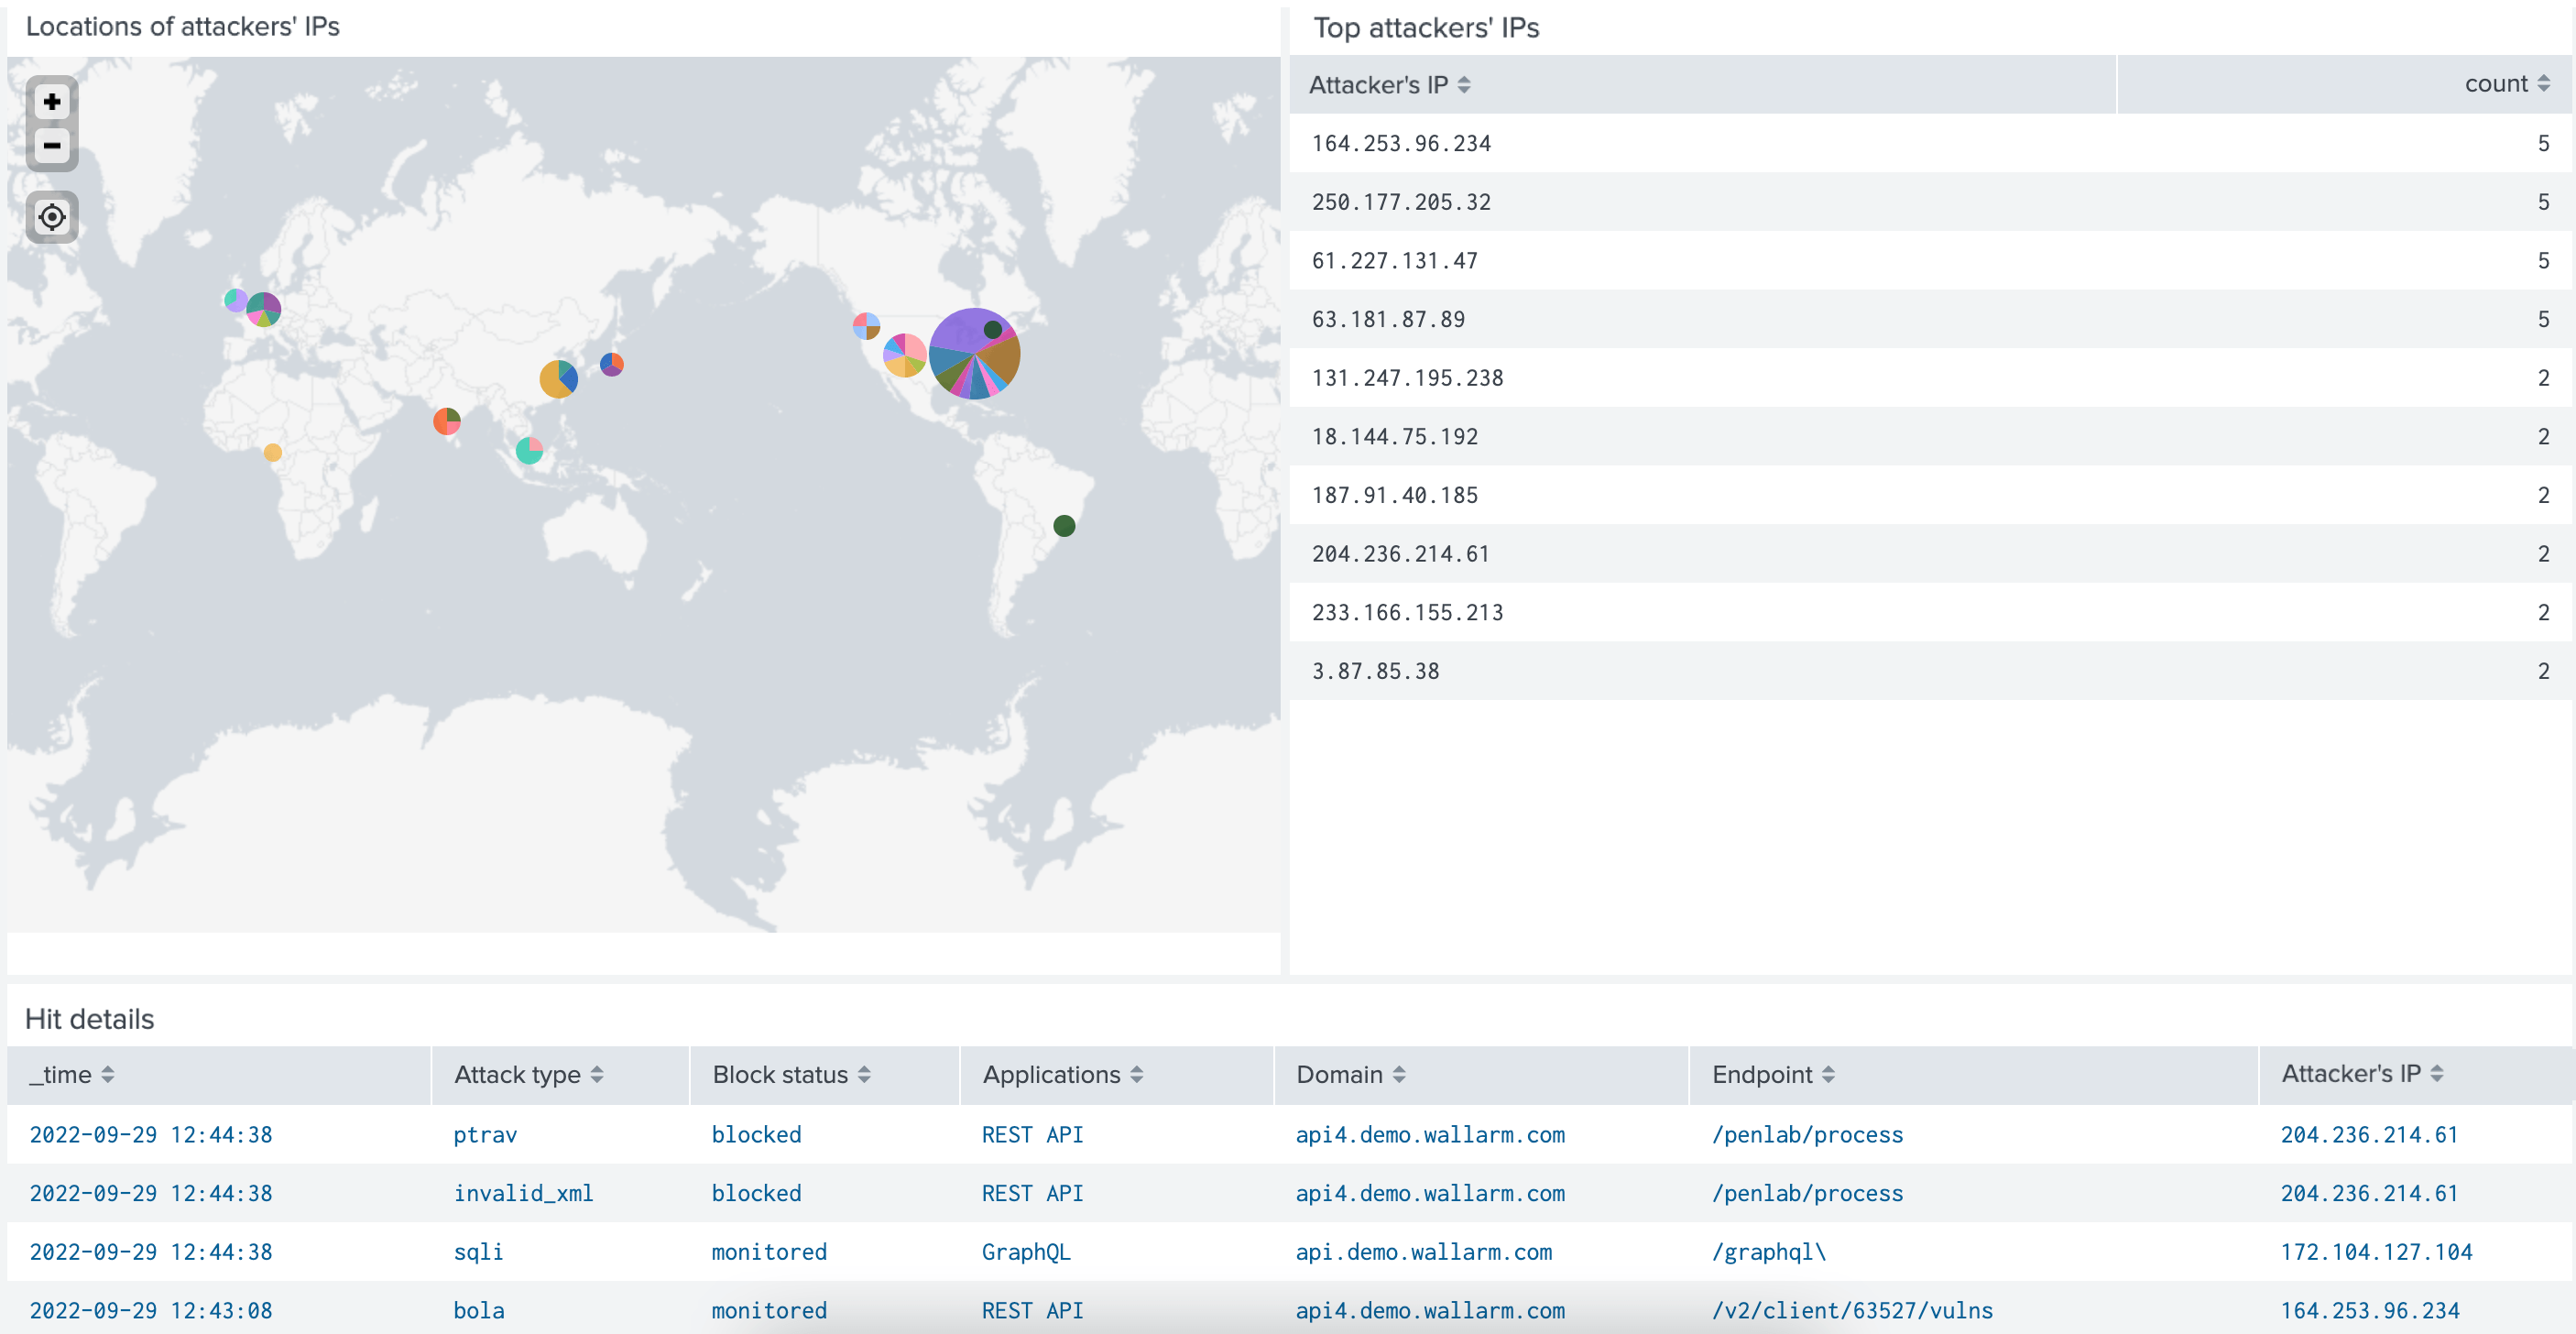
Getting events organized into a dashboard
To get Wallarm events organized into a ready-to-use dashboard in Splunk 9.0 or later, you can install the Wallarm application for Splunk.
This application provides you with a pre-configured dashboard that is automatically filled with the events received from Wallarm. In addition to that, the application enables you to proceed to detailed logs on each event and export the data from the dashboard.
To install the Wallarm application for Splunk:
-
In the Splunk UI ➝ Apps find the
Wallarm API Securityapplication. -
Click Install and input the Splunkbase credentials.
If some Wallarm events are already logged in Splunk, they will be displayed on the dashboard, as well as further events Wallarm will discover.
In addition, you can fully customize the ready-to-use dashboard, e.g. its view or search strings used to extract data from all Splunk records.