Logstash
You can set up Wallarm to send notifications of detected events to Logstash by creating an appropriate integration in Wallarm Console.
You can choose the following events to be sent to Logstash:
-
Hits detected except for:
- Experimental hits detected based on the custom regular expression. Non-experimental hits trigger notifications.
- Hits not saved in the sample.
-
System related:
- User changes (newly created, deleted, role change)
- Integration changes (disabled, deleted)
- Application changes (newly created, deleted, name change)
-
Vulnerabilities detected, all by default or only for the selected risk level(s) - high, medium or low.
-
Rules and triggers changed (creating, updating, or deleting the rule or trigger)
-
Scope (exposed assets) changed: updates in hosts, services, and domains
-
On an hourly basis, you can get a notification with the number of requests processed during the previous hour
Notification format
Wallarm sends notifications to Logstash via webhooks in the JSON format. The set of JSON objects depends on the event Wallarm notifies about.
Example of the notification of the new hit detected:
[
    {
        "summary": "[Wallarm] New hit detected",
        "details": {
        "client_name": "TestCompany",
        "cloud": "EU",
        "notification_type": "new_hits",
        "hit": {
            "domain": "www.example.com",
            "heur_distance": 0.01111,
            "method": "POST",
            "parameter": "SOME_value",
            "path": "/news/some_path",
            "payloads": [
                "say ni"
            ],
            "point": [
                "post"
            ],
            "probability": 0.01,
            "remote_country": "PL",
            "remote_port": 0,
            "remote_addr4": "8.8.8.8",
            "remote_addr6": "",
            "tor": "none",
            "request_time": 1603834606,
            "create_time": 1603834608,
            "response_len": 14,
            "response_status": 200,
            "response_time": 5,
            "stamps": [
                1111
            ],
            "regex": [],
            "stamps_hash": -22222,
            "regex_hash": -33333,
            "type": "sqli",
            "block_status": "monitored",
            "id": [
                "hits_production_999_202010_v_1",
                "c2dd33831a13be0d_AC9"
            ],
            "object_type": "hit",
            "anomaly": 0
            }
        }
    }
]
Requirements
The Logstash configuration should meet the following requirements:
-
Accept the POST or PUT requests
-
Accept HTTPS requests
-
Have public URL
Logstash confiration example:
You will find more details in the official Logstash documentation.
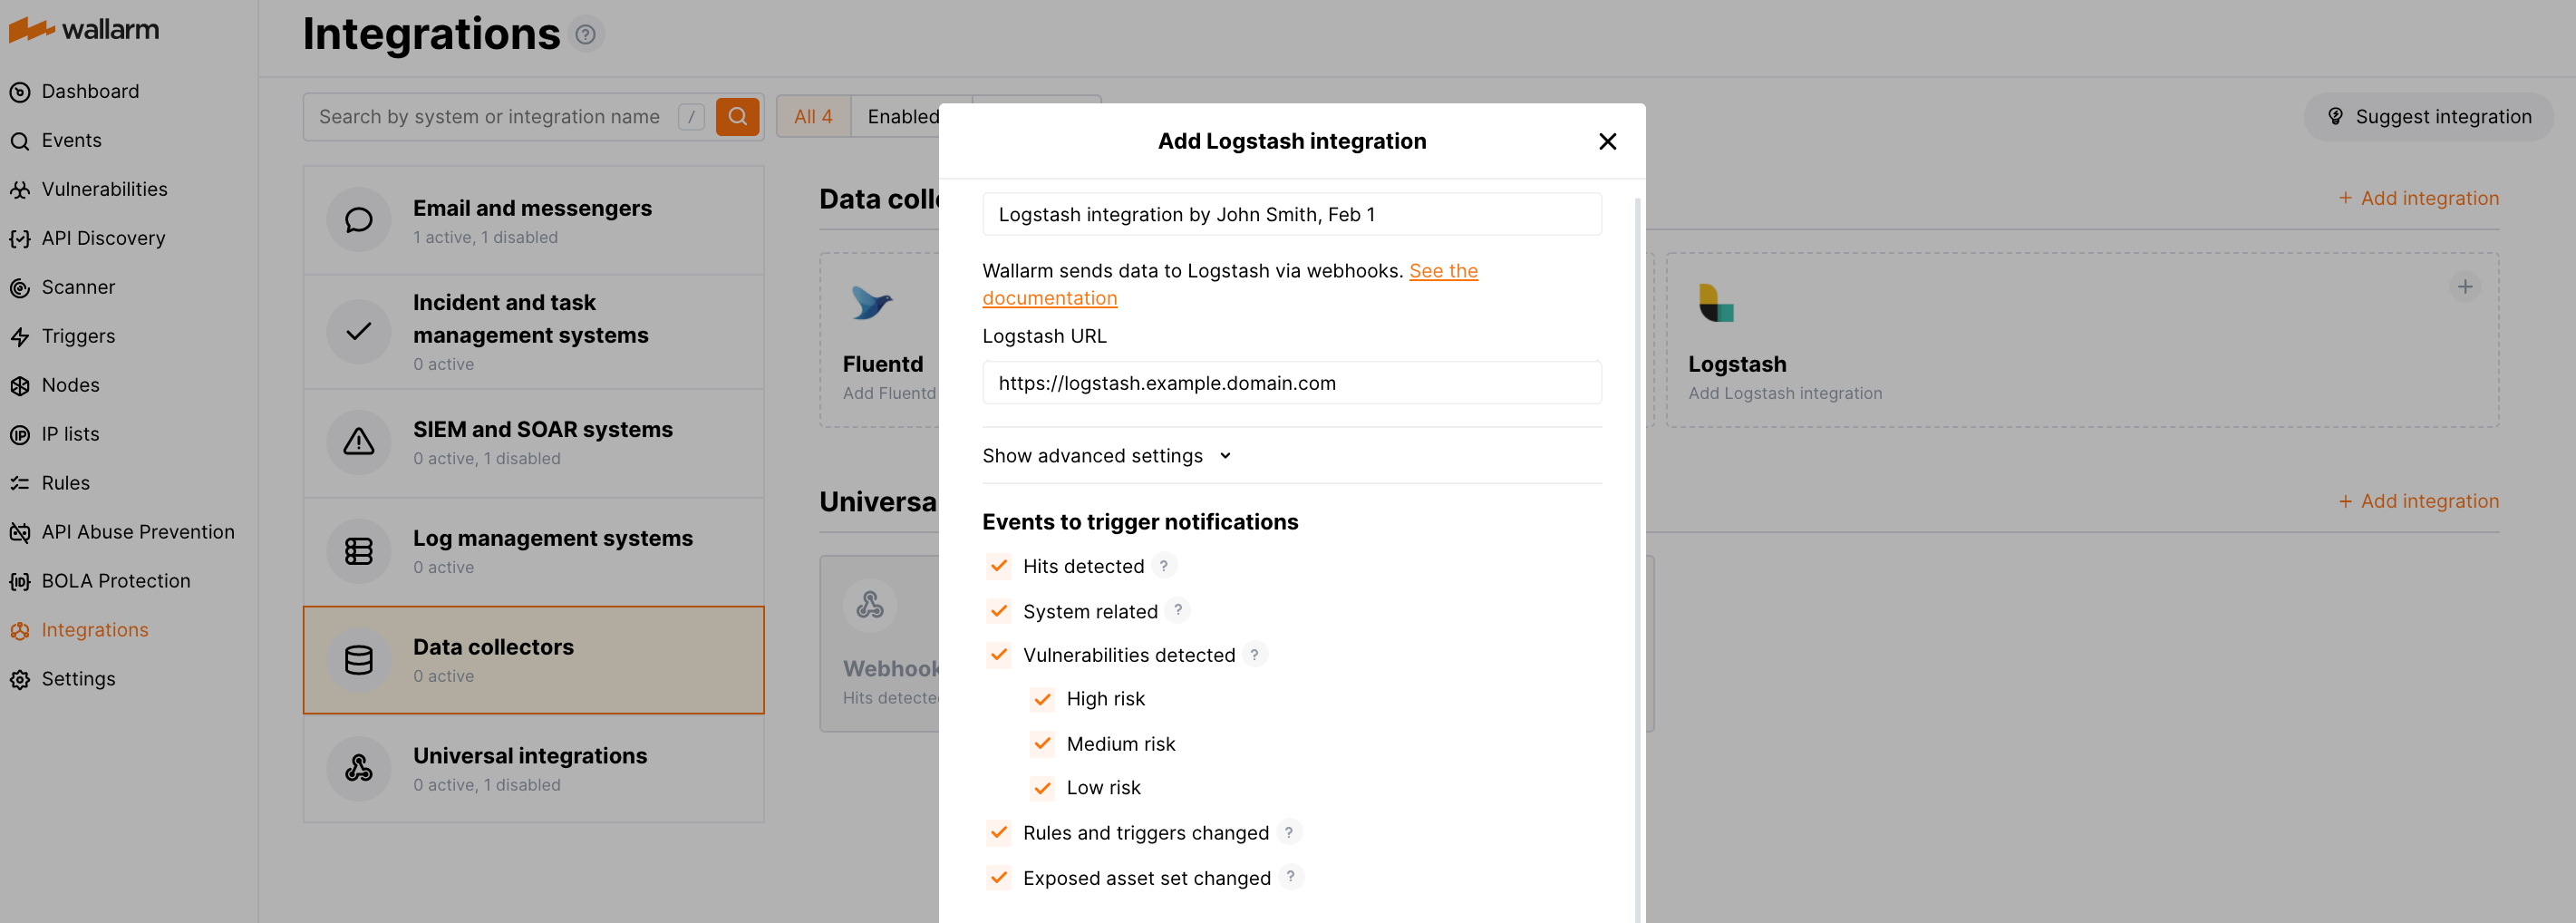
Setting up integration
-
Proceed to the Logstash integration setup in Wallarm Console → Integrations → Logstash.
-
Input the integration name.
-
Specify target Logstash URL (Webhook URL).
-
If required, configure advanced settings:
- Request method:
POSTorPUT. By default, POST requests are sent. - Request header and its value if the server requires a non-standard header to execute the request. The number of headers is not limited.
- CA certificate: certificate of CA that signed a server certificate. If CA is publicly trusted, this field is optional. If a server certificate is self-signed, this field is required and must contain a certificate of your own CA that signed a server certificate.
- Verify TLS certificate: this setting allows to disable verification of the specified server certificate. By default, Wallarm verifies whether a server certificate is signed by a publicly trusted CA. We do not recommend disabling the verification of production server certificates. If your server uses a self-signed TLS certificate, you can add a self-signed CA certificate to allow sending requests to this server.
- Request timeout, in seconds: if the server does not respond to the request within the specified time, the request fails. By default: 15 seconds.
- Connection timeout, in seconds: if the connection to the server cannot be established during the specified time, the request fails. By default: 20 seconds.
- Wallarm data format: either a JSON Array (default) or a New Line Delimited JSON (NDJSON).
- Request method:
-
Choose event types to trigger sending notifications to the specified URL. If the events are not chosen, then notifications will not be sent.
-
Test the integration and make sure the settings are correct.
-
Click Add integration.
Testing integration
Integration testing allows checking configuration correctness, availability of the Wallarm Cloud, and the notification format. To test the integration, you can use the button Test integration when creating or editing the integration.
The integration is tested as follows:
-
Test notifications with the prefix
[Test message]are sent to the selected system. -
Test notifications cover the following events (each in a single record):
- New user in the company account
- Newly detected hit
- Newly discovered IP in the company scope
- New trigger in the company account
- Newly discovered security vulnerability
-
Test notifications include test data.
The test Logstash log:
[
    {
        summary:"[Test message] [Test partner(US)] New vulnerability detected",
        description:"Notification type: vuln

                    New vulnerability was detected in your system.

                    ID:
                    Title: Test
                    Domain: example.com
                    Path:
                    Method:
                    Discovered by:
                    Parameter:
                    Type: Info
                    Threat: Medium

                    More details: https://us1.my.wallarm.com/object/555


                    Client: TestCompany
                    Cloud: US
                    ",
        details:{
            client_name:"TestCompany",
            cloud:"US",
            notification_type:"vuln",
            vuln_link:"https://us1.my.wallarm.com/object/555",
            vuln:{
                domain:"example.com",
                id:null,
                method:null,
                parameter:null,
                path:null,
                title:"Test",
                discovered_by:null,
                threat:"Medium",
                type:"Info"
            }
        }
    }
]
Updating integration
To update the settings of active integration:
-
Open an active integration.
-
Make required changes and click Save.
Disabling integration
To stop sending reports and notifications temporarily, you can disable the integration:
-
Open an active integration and click Disable.
To re-enable sending reports and notifications, open the disabled integration and click Enable.
Disabling the integration is the system event. If you receive system notifications, messages about disabled integration will be sent to the configured system.
Deleting integration
To stop sending reports and notifications permanently, you can delete the integration. Deleting an integration cannot be undone. The integration will be removed from the list permanently.
-
Open integration and click Delete.
-
Confirm the action.
Deleting the integration is the system event. If you receive system notifications, messages about deleted integration will be sent to the configured system.
Using Logstash as an intermediate data collector
The most common logging scheme in complex systems consists of the following components:
-
Data collector: accepts logs from several sources and forwards logs to the SIEM system
-
SIEM system or log management systems: used to analyze logs and monitor the system status
For example:
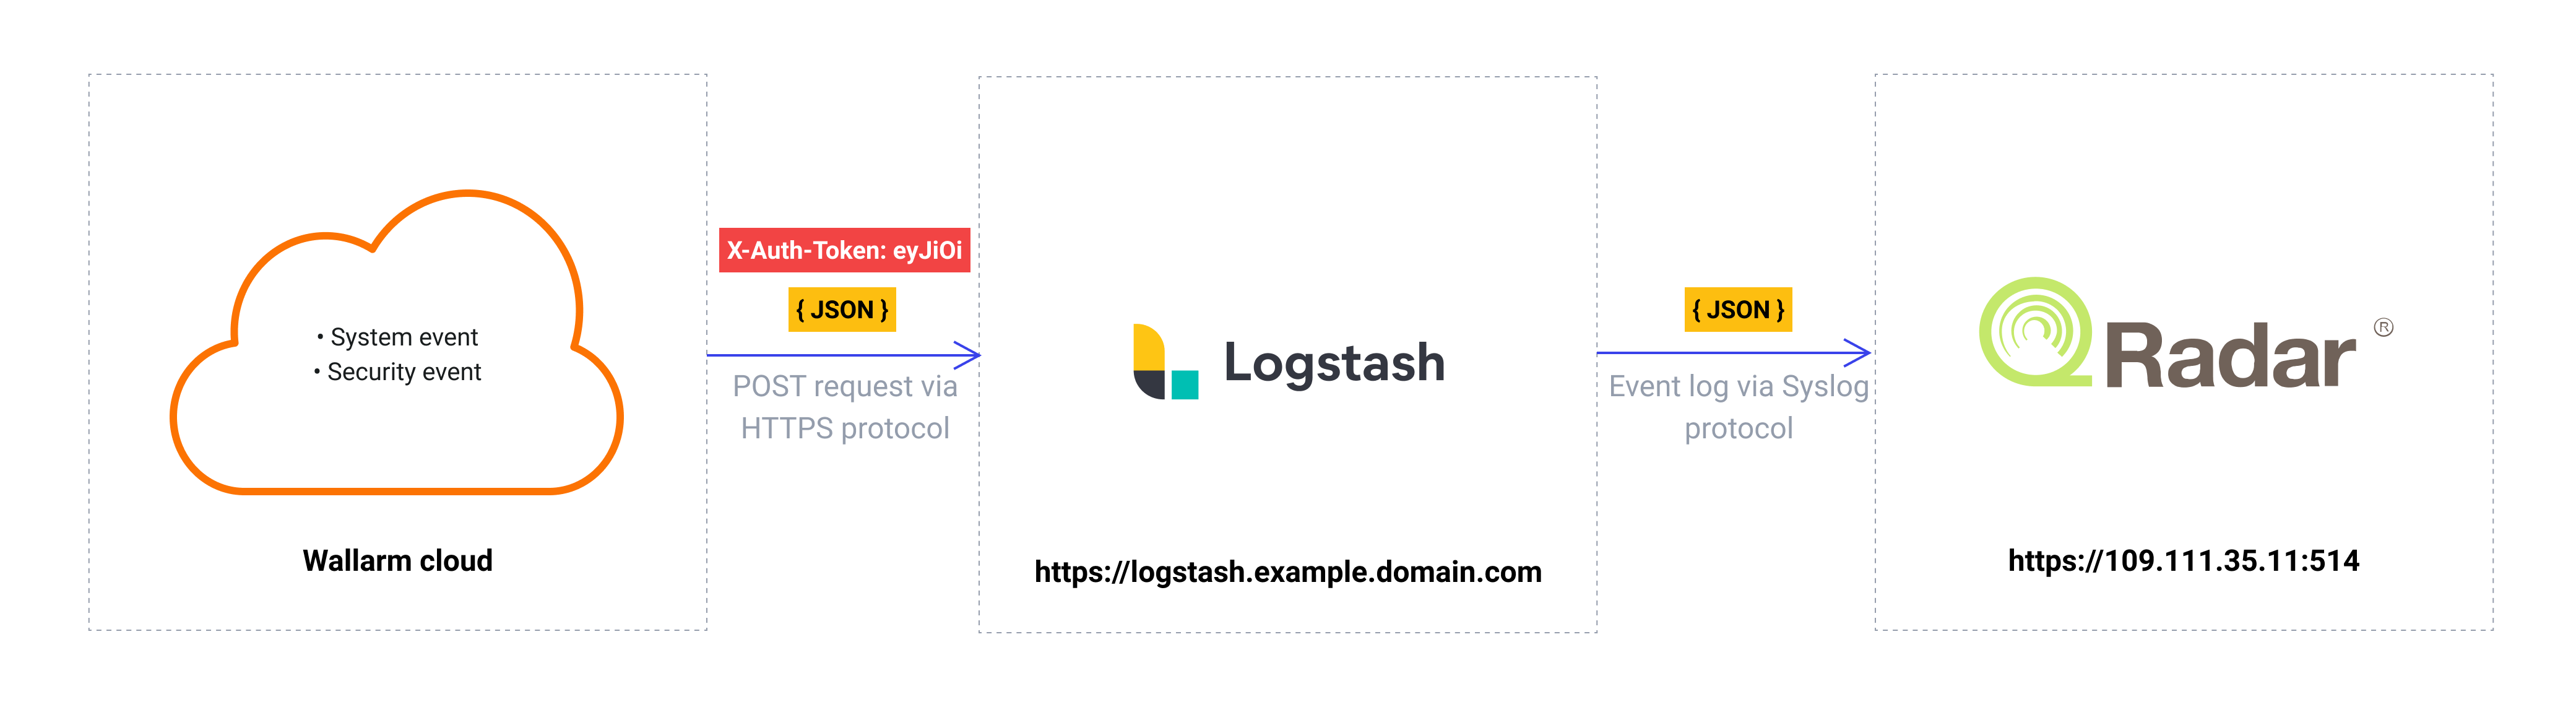
To log Wallarm events using this scheme:
-
Configure data collector to read incoming webhooks and forward logs to the next system. Wallarm sends events to data collectors via webhooks.
-
Configure a SIEM system to get and read logs from the data collector.
-
Configure Wallarm to send logs to the data collector.
Wallarm can send logs to any data collector via webhooks.
To integrate Wallarm with Fluentd or Logstash, you can use the corresponding integration cards in the Wallarm Console UI.
To integrate Wallarm with other data collectors, you can use the webhook integration card in the Wallarm Console UI.
We described some examples of how to configure the integration with the popular data collectors forwarding logs to the SIEM systems:
-
Wallarm also supports the native integration with Datadog via Datadog API. The native integration does not require the intermediate data collector to be used.