Threat Prevention Dashboard
Wallarm automatically collects metrics on processed traffic and represents them in the Dashboards → Threat Prevention section of Wallarm Console. The dashboard allows any user to analyze malicious and legitimate traffic trends and get application vulnerability status for a period of time.
Metrics are presented in the following widgets:
-
Statistics for the current month and the speed of request encountering
-
Normal and malicious traffic
-
Attack types
-
API protocols
-
Attack sources
-
Attack targets
-
Vulnerability Scanner
You can filter widget data by applications and time period. By default, widgets represent statistics on all applications for the last month.
Any widget allows to open the event list the statistics have been collected on.
Getting started with Wallarm
If you registered the Wallarm account in the US Cloud, you would be able to explore core Wallarm features in the Playground with read-only access to the Wallarm Console sections. Use it to try out major features of the Wallarm platform without having to deploy any components to your environment.
The Dashboard section also includes the Get started button for new users. When you click the button, you will get a list of helpful product discovery options with the following among them:
- The Onboarding tour option will provide you with deployment options supported by Wallarm and links to relevant deployment instructions.
- The Wallarm Playground option will forward you to the Wallarm Console playground with read-only access to its sections. This option is available only for users of the US Cloud.
Statistics for the current month and the speed of request encountering
The widget displays the following data:
-
Monthly request quota specified in the subscription plan
-
The number of detected hits and blocked ones during the current month
-
The real-time speed at which requests and hits are encountered

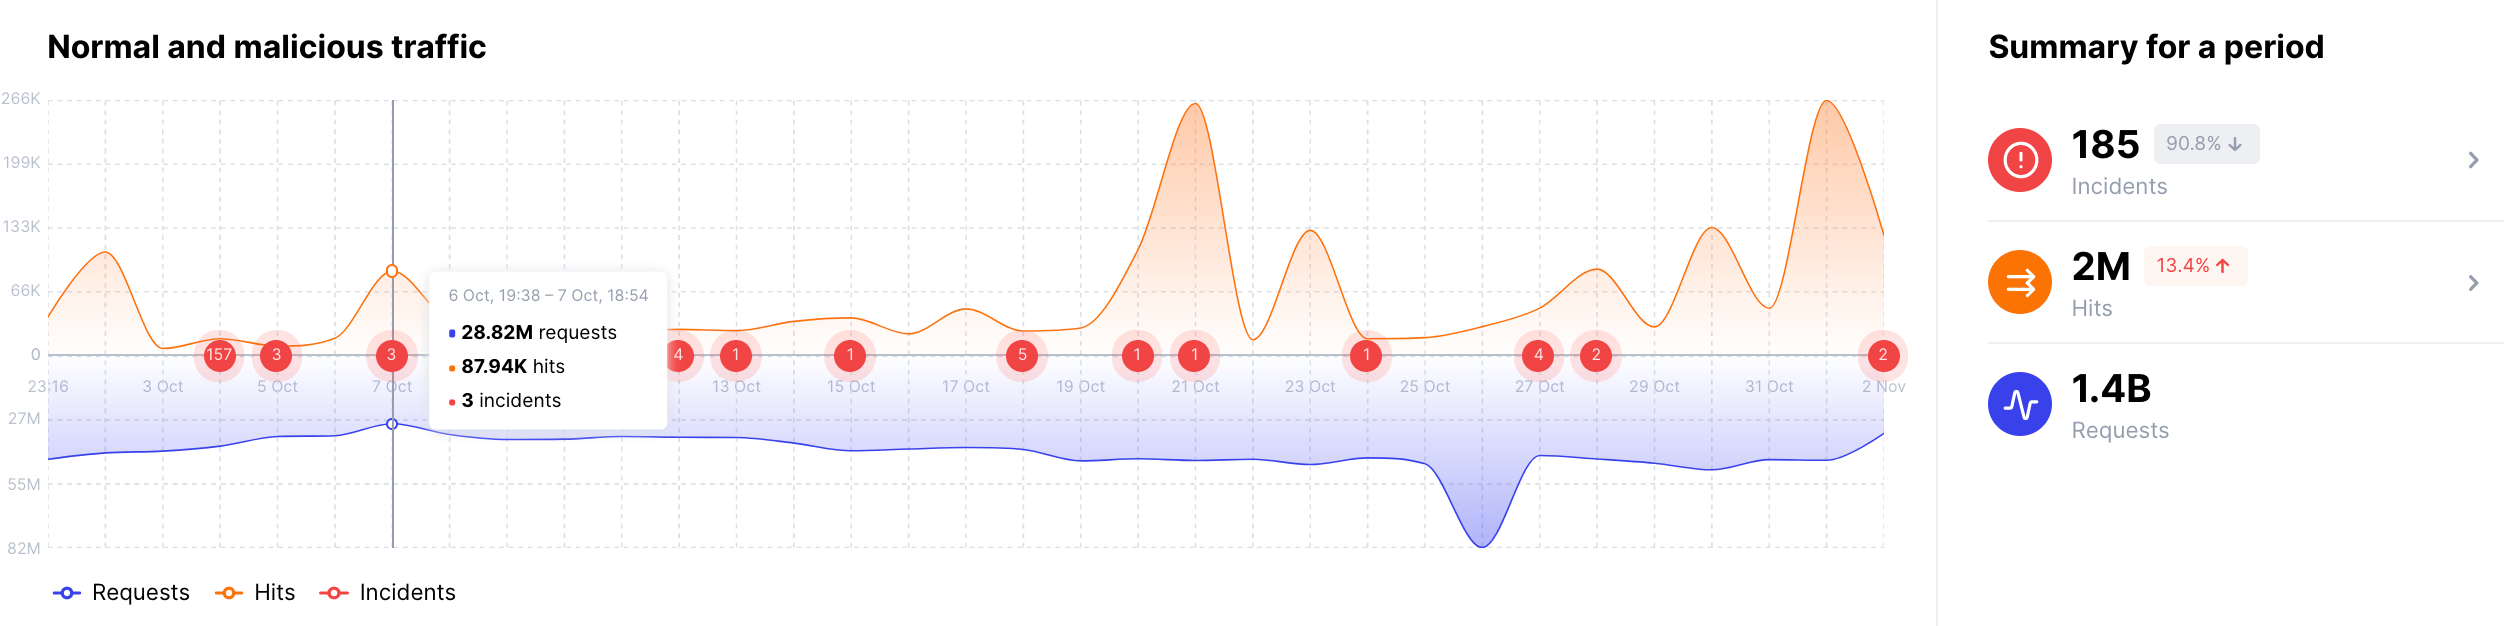
Normal and malicious traffic for a period
The widget displays the summary statistics for the traffic processed during the selected period:
-
The graph represents the data distribution over time, enabling you to track the periods of the most active activity
-
The total number of processed requests, hits, and incidents, and the number of blocked hits
-
Trends: change in the event number for a selected period and the same previous period
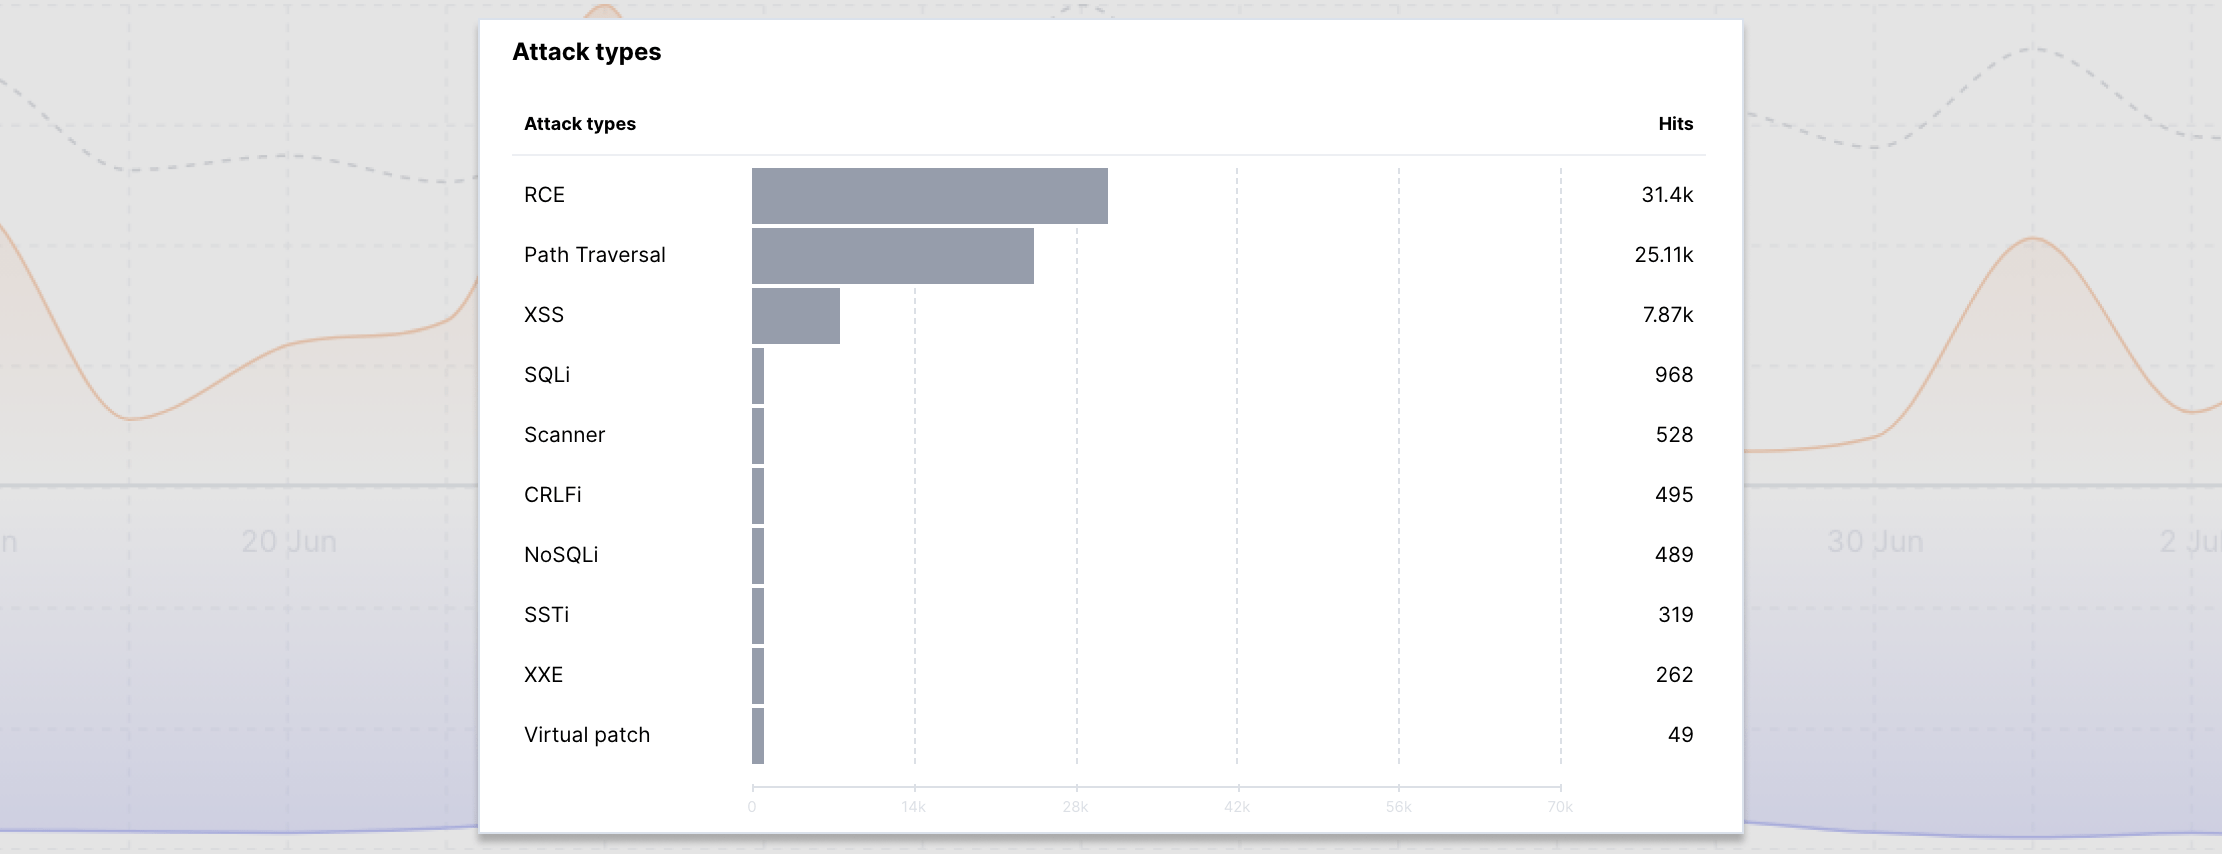
Attack types
This widget displays the top types of detected attacks which helps to analyze the patterns of malicious traffic and attacker behavior.
Using this data, you can analyze the vulnerability of your services to different attack types and take appropriate measures to improve service security.
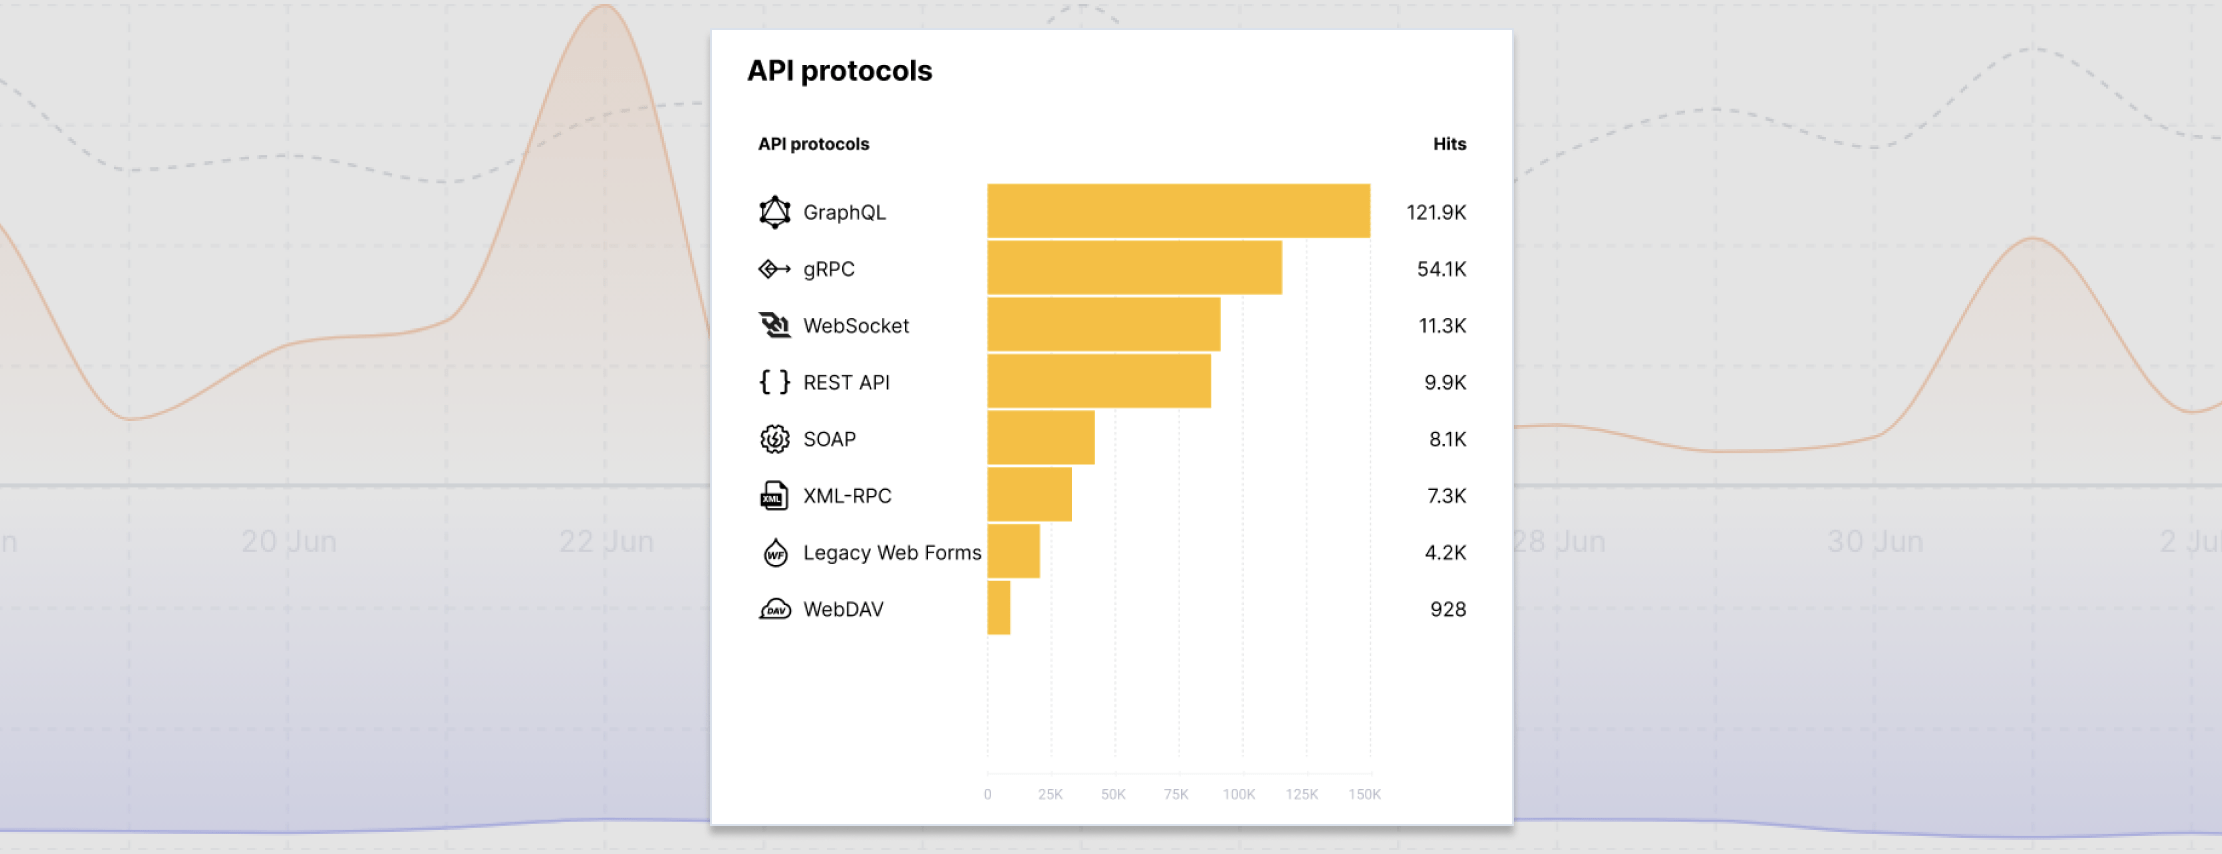
API protocols
This widget displays statistics on API protocols used by attackers. Wallarm can identify the following API protocols:
-
GraphQL
-
gRPC
-
WebSocket
-
REST API
-
SOAP
-
XML-RPC
-
JSON-RPC
-
WebDAV
Using the widget, you can analyze malicious requests sent via certain protocols and assess the vulnerability of your system to such requests.
CVEs
The CVEs widget displays the top of the CVE vulnerabilities attackers have exploited during the selected time frame. By changing the sorting type, you can be aware of the latest CVEs, can track the CVEs attacked the most.
Each CVE is accompanied by the details like CVSS v3.0 score, attack complexity, privileges required and others received from the Vulnerability database. Vulnerabilities registered earlier than 2015 are not provided with the CVSS v3.0 score.
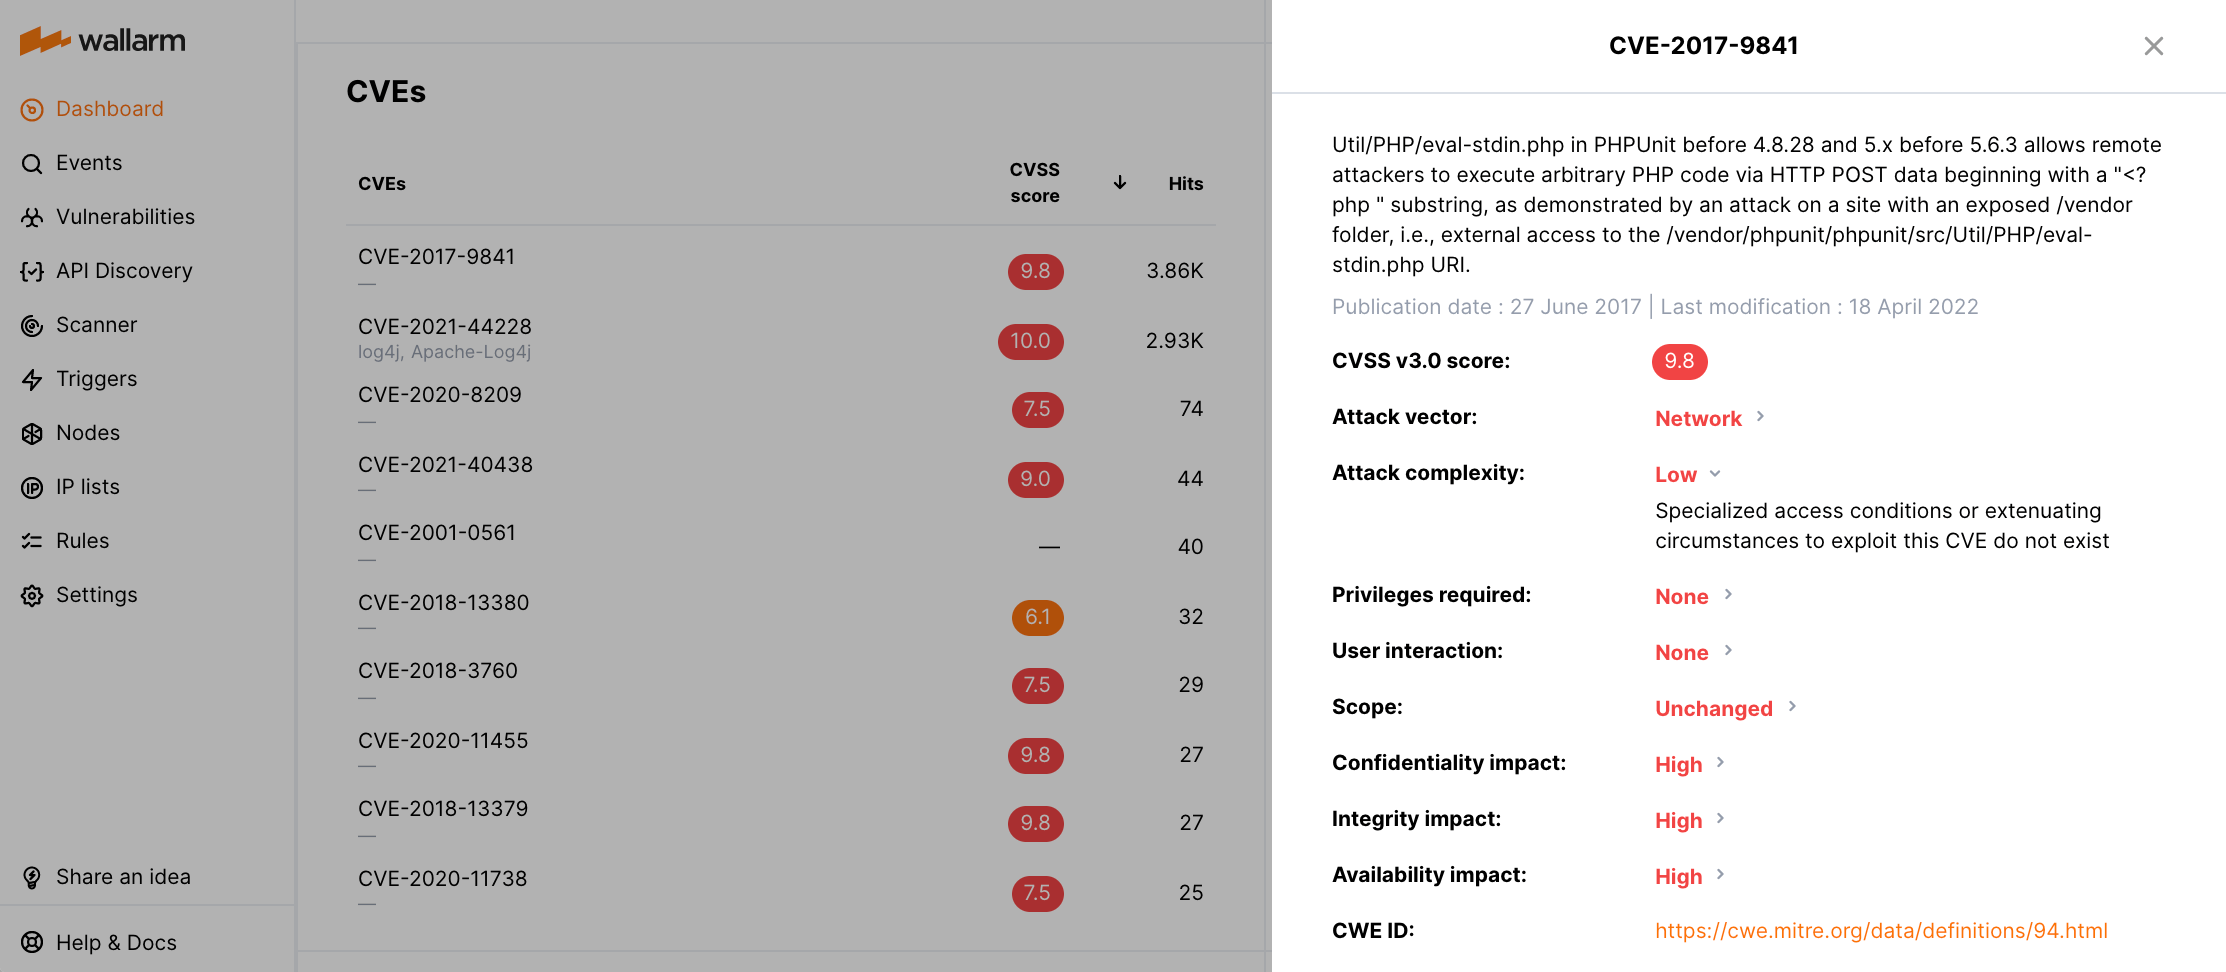
You can review your system for highlighted vulnerabilities and if found, implement appropriate remediation recommendations to eliminate the risk of vulnerability exploitation.
Authentication
This widget displays authentication methods attackers have used during the specified time frame, e.g.:
-
API Key
-
Basic Auth
-
Bearer Token
-
Cookie Auth, etc.

This information allows you to identify weak authentication methods and then take preventative steps.
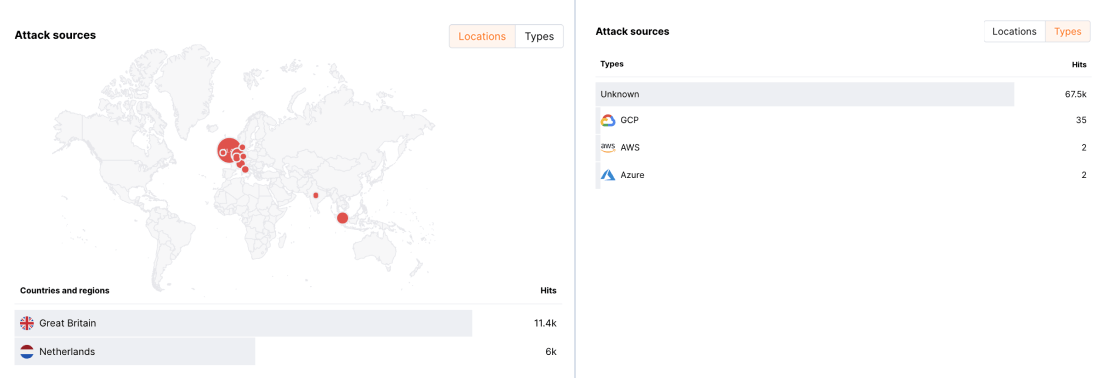
Attack sources
This widget displays the statistics on the attack source groups:
-
Locations
-
Types, e.g. Tor, Proxy, VPN, AWS, GCP, etc.
This data can help to define abusive attack sources and enable the blocking of requests originating from them by using gray or deny lists of IP addresses.
You can view data on each source group on separate tabs.
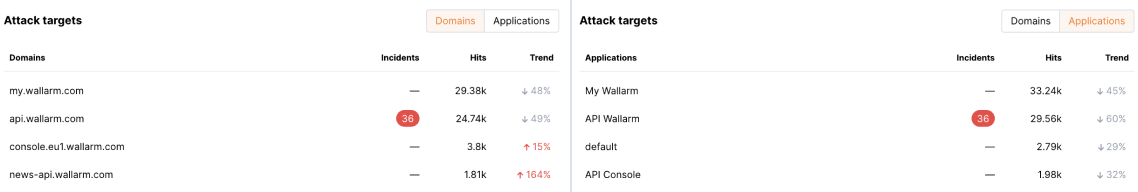
Attack targets
This widget displays domains and applications being attacked the most. The following metrics are displayed for each object:
-
The number of detected incidents
-
The number of detected hits
-
Trends: change in the hit number for a selected period and for the same previous period. For example: if you check the statistics for the last month, the trend displays the difference in the hits number between the last and previous months as a percentage
You can view data on domains and applications on separate tabs.
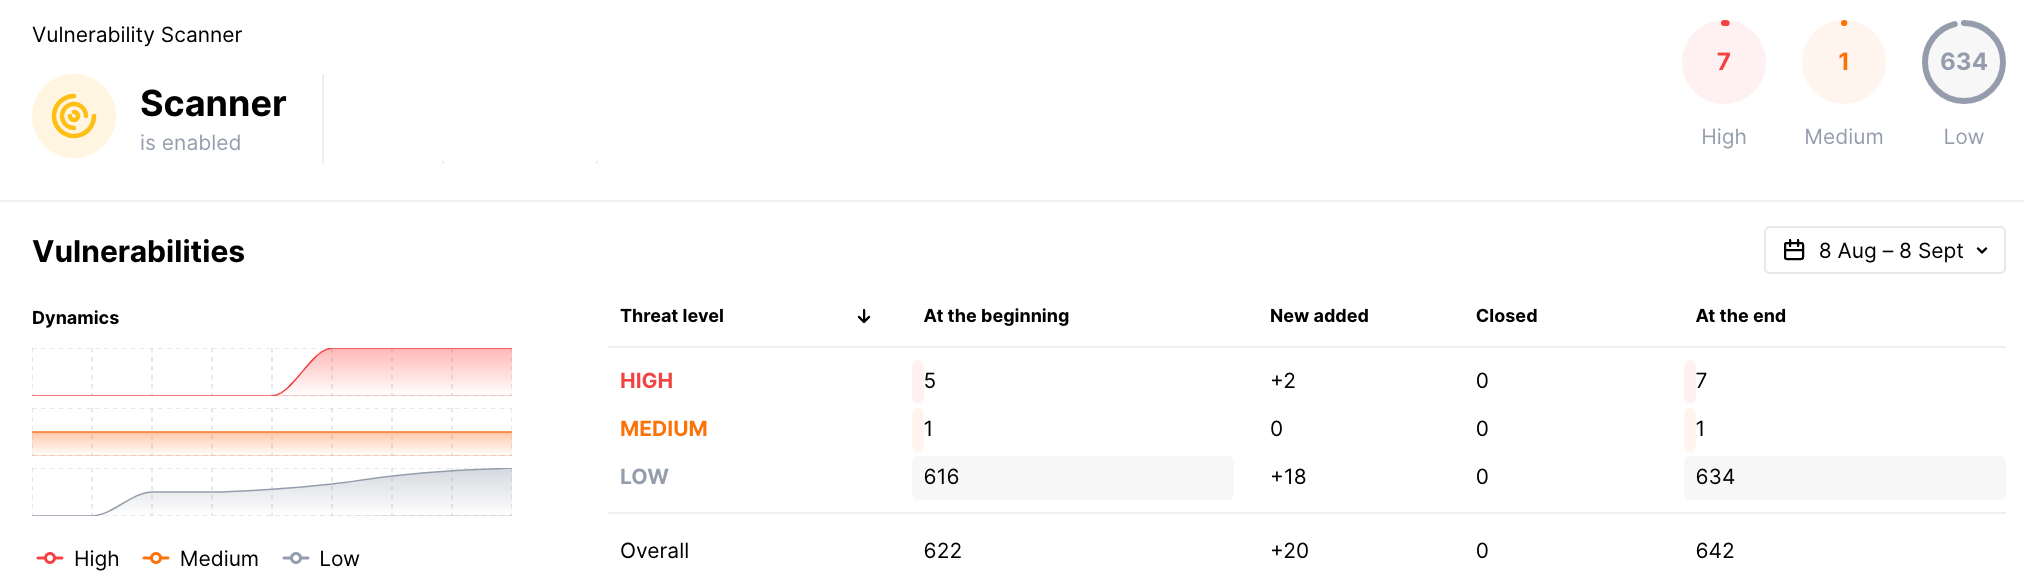
Vulnerability Scanner
The Scanner widget shows statistics on vulnerabilities detected in public assets:
-
The number of vulnerabilities of all risk levels detected over the selected period
-
The number of active vulnerabilities of all risk levels at the end of the selected period
-
Changes in the number of vulnerabilities of all risk levels for the selected period