Working with the Filter Node Metrics in Grafana
If you have configured the export of metrics in InfluxDB or Graphite, then you can visualize the metrics with Grafana.
A few assumptions
This document assumes that you have deployed Grafana alongside InfluxDB or Graphite.
The curl_json-wallarm_nginx/gauge-abnormal metric, which shows the number of requests processed by the node.example.local filter node, is used as an example.
However, you can monitor any supported metric.
In your browser, go to http://10.0.30.30:3000 to open the Grafana web console, then log in to the console using the standard username (admin) and password (admin).
In order to monitor a filter node using Grafana, you will need to
-
Connect a data source.
-
Fetch the required metrics from the data source.
-
Set up metric visualization.
It is assumed that you are using one of the following data sources:
-
InfluxDB
-
Graphite
Connecting a Data Source
InfluxDB
To connect an InfluxDB server as the data source take the following steps:
-
On the main page of the Grafana console, click the Add data source button.
-
Select “InfluxDB” as the data source type.
-
Fill in the required parameters:
- Name: InfluxDB
- URL:
http://influxdb:8086 - Database:
collectd - User:
root - Password:
root
-
Click the Save & Test button.
Graphite
To connect a Graphite server as the data source take the following steps:
-
On the main page of the Grafana console, click the Add data source button.
-
Select “Graphite” as the data source type.
-
Fill in the required parameters:
- Name: Graphite
- URL:
http://graphite:8080. - Version: select the newest available version from the drop-down list.
-
Click the Save & Test button.
Checking a Data Source Status
If a data source was connected successfully, the “Data source is working” message should appear.
Further Actions
Perform the following actions to enable Grafana to monitor metrics:
-
Click the Grafana icon in the upper left corner of the console to return to the main page.
-
Create a new dashboard by clicking the New Dashboard button. Then add a query to fetch a metric to the dashboard by clicking the Add Query button.
Fetching the Required Metrics from the Data Source
InfluxDB
To fetch a metric from the InfluxDB data source do the following:
-
Select the newly created “InfluxDB” data source from the Query drop-down list.
-
Design a query to the InfluxDB
-
either by using the graphical query design tool,
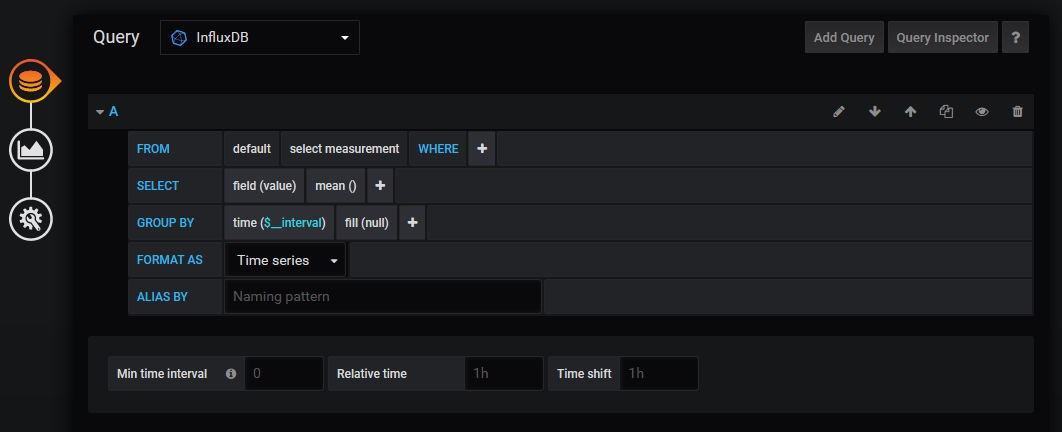
-
or by manually filling in a query in plain text (to do this, click the Toggle text edit button, which is highlighted in the screenshot below).
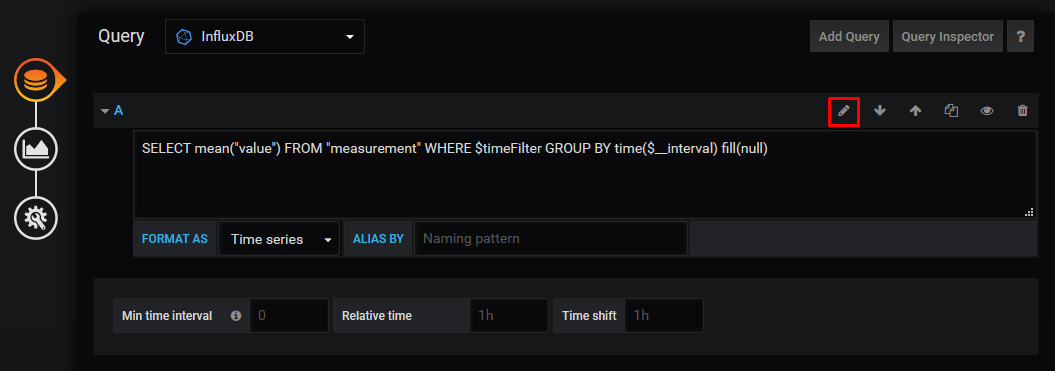
-
The query to fetch the curl_json-wallarm_nginx/gauge-abnormal metric is:
SELECT value FROM curl_json_value WHERE (host = 'node.example.local' AND instance = 'wallarm_nginx' AND type = 'gauge' AND type_instance = 'abnormal')
Graphite
To fetch a metric from the Graphite data source do the following:
-
Select the newly created “Graphite” data source from the Query drop-down list.
-
Select the elements of the required metric in a sequential manner by clicking the select metric button for the metric’s element in the Series line.
The elements of the
curl_json-wallarm_nginx/gauge-abnormalmetric go as follows:-
The hostname, as it was set in the
write_graphiteplugin configuration file.The
_character serves as a delimiter by default in this plugin; therefore, thenode.example.localdomain name will be represented asnode_example_localin the query. -
The name of the
collectdplugin that provides a specific value. For this metric, the plugin iscurl_json. - The name of the plugin instance. For this metric, the name is
wallarm_nginx. - The type of value. For this metric, the type is
gauge. - The name of value. For this metric, the name is
abnormal.
-
Further Actions
After the creation of the query, set up a visualization for the corresponding metric.
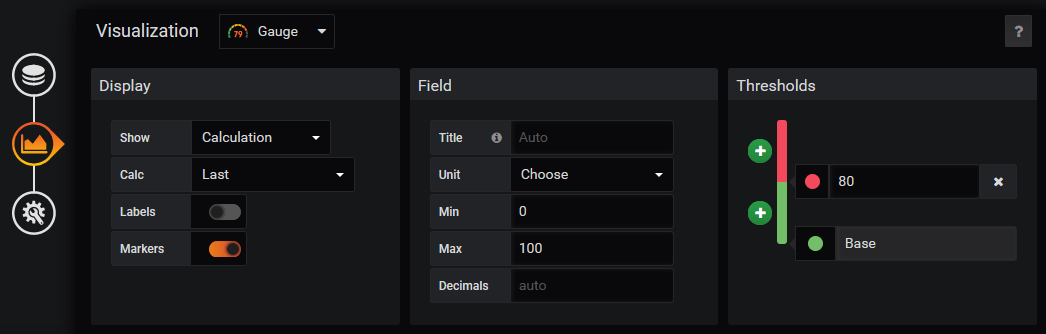
Setting Up Metric Visualization
Switch from the Query tab to the Visualization tab, and select the desired visualization for the metric.
For the curl_json-wallarm_nginx/gauge-abnormal metric, we recommend using the “Gauge” visualization:
-
Select the Calc: Last option to display the current metric value.
-
If necessary, you can configure thresholds and other parameters.
Further Actions
After configuring visualization take the following steps:
-
Complete the query configuration by clicking on the “←” button in the upper left corner of the console.
-
Save any changes that were made to the dashboard.
-
Verify and confirm that Grafana is successfully monitoring the metric.
Verifying Monitoring
After you have connected one of the data sources and configured the query and visualization for the curl_json-wallarm_nginx/gauge-abnormal metric, check the monitoring operation:
-
Enable automatic metric updates at five-second intervals (select a value from the drop-down list in the upper right corner of the Grafana console).
-
Make sure that the current number of requests on the Grafana dashboard matches the output from
wallarm-statuson the filter node:- Execute the
curl http://127.0.0.8/wallarm-statuscommand if the default configuration of the statistics service is in use. - Otherwise, see the
/etc/nginx/conf.d/wallarm-status.confconfiguration file to construct the correct command similar to the one above.
{"requests":0,"attacks":0,"blocked":0,"abnormal":0,"tnt_errors":0,"api_errors":0,"requests_lost":0,"segfaults":0,"memfaults":0,"softmemfaults":0,"time_detect":0,"db_id":46,"custom_ruleset_id":4,"proton_instances": { "total":2,"success":2,"fallback":0,"failed":0 },"stalled_workers_count":0,"stalled_workers":[] }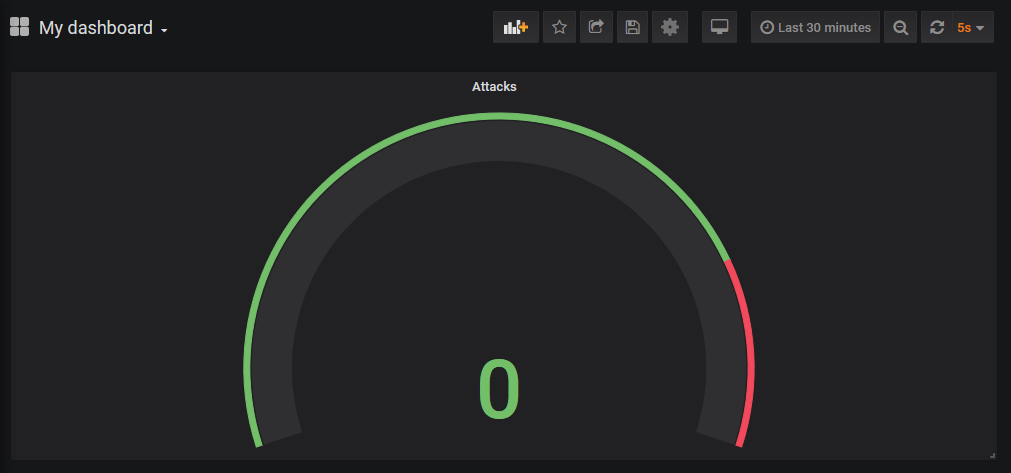
- Execute the
-
Perform a test attack on an application protected by the filter node. To do this, you can send a malicious request to the application either with the
curlutility or a browser. -
Make sure that the request counter has increased both in the
wallarm-statusoutput and on the Grafana dashboard:{"requests":64,"attacks":16,"blocked":0,"abnormal":64,"tnt_errors":0,"api_errors":0,"requests_lost":0,"segfaults":0,"memfaults":0,"softmemfaults":0,"time_detect":0,"db_id":46,"custom_ruleset_id":4,"proton_instances": { "total":2,"success":2,"fallback":0,"failed":0 },"stalled_workers_count":0,"stalled_workers":[] }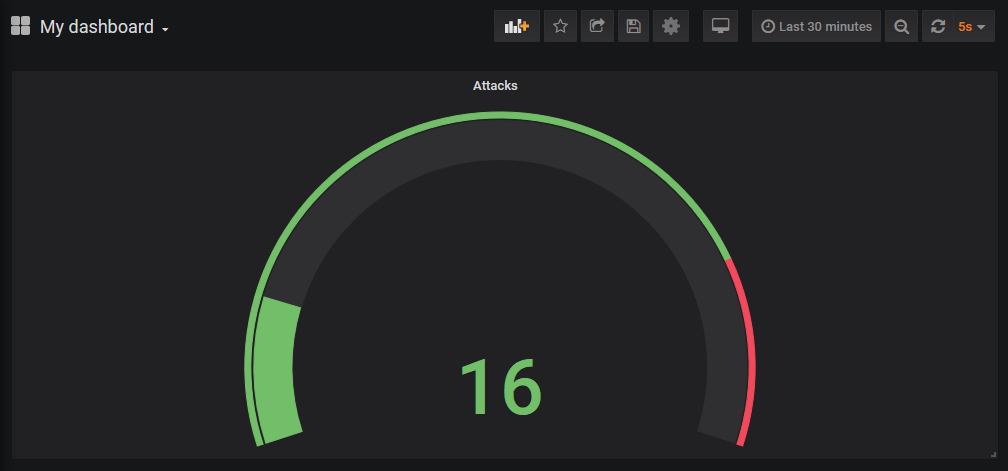
The Grafana dashboard now displays the curl_json-wallarm_nginx/gauge-abnormal metric values for the node.example.local filter node.