Exporting Metrics to InfluxDB via the collectd Network Plugin
This document provides an example of using the Network plugin to export metrics to the InfluxDB temporal database. It will also demonstrate how to visualize the metrics collected in InfluxDB using Grafana.
Example Workflow
Example of metric
This example shows how to work with the single curl_json-wallarm_nginx/gauge-abnormal metric, which shows the number of requests processed by the filter node.
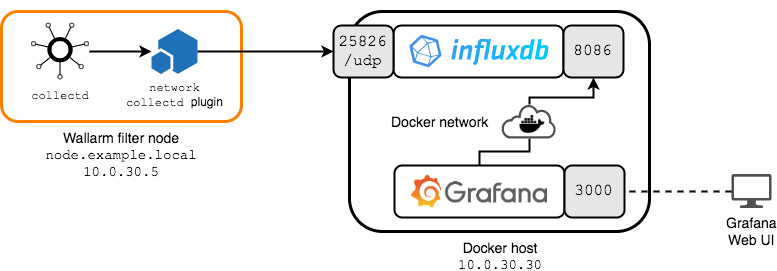
The following deployment scheme is used in this document:
-
The Wallarm filter node is deployed on a host accessible via the
10.0.30.5IP address and thenode.example.localfully qualified domain name.The
networkplugin forcollectdon the filter node is configured in such a way that all metrics will be sent to the10.0.30.30InfluxDB server on port25826/UDP.Network plugin features
Please note that the plugin operates over UDP (see using examples and documentation of the
networkplugin). -
Both
influxdband grafana services are deployed as Docker containers on a separate host with the10.0.30.30IP address.The
influxdbservice with the InfluxDB database is configured as follows:- A
collectddata source has been created (thecollectdinput according to InfluxDB terminology), which listens on the25826/UDPport and writes incoming metrics to a database calledcollectd. - Communication with the InfluxDB API occurs via the
8086/TCPport. - The service shares a
sample-netDocker network with thegrafanaservice.
The
grafanaservice with Grafana is configured as follows:- The Grafana web console is available at
http://10.0.30.30:3000. - The service shares the
sample-netDocker network with theinfluxdbservice.
- A
Configuring Metrics Export to InfluxDB
Prerequisites
It is assumed that
- Docker Community Edition and
docker-composeare already installed on the10.0.30.30Docker host. - The
node.example.localfilter node is already deployed, configured, available for further configuration (for example, via the SSH protocol), and working.
Deploying InfluxDB and Grafana
Deploy InfluxDB and Grafana on the Docker host:
-
Create a working directory, for example,
/tmp/influxdb-grafana, and navigate to it: -
For the InfluxDB data source to work, you will need a file named
types.dbthat contains thecollectdvalue types.This file describes the dataset specifications used by
collectd. Such datasets include definitions of measurable types. Detailed information about this file is available here.Download the
types.dbfile from the GitHub repository of thecollectdproject and put it in the working directory. -
Get the basic InfluxDB configuration file by running the following command:
-
Enable the
collectddata source in theinfluxdb.confInfluxDB configuration file by changing the value of theenabledparameter in the[[collectd]]section fromfalsetotrue.Leave other parameters unchanged.
The section should look like this:
[[collectd]] enabled = true bind-address = ":25826" database = "collectd" retention-policy = "" batch-size = 5000 batch-pending = 10 batch-timeout = "10s" read-buffer = 0 typesdb = "/usr/share/collectd/types.db" security-level = "none" auth-file = "/etc/collectd/auth_file" parse-multivalue-plugin = "split" -
Create a
docker-compose.yamlfile in the working directory with the following content:version: "3" services: influxdb: image: influxdb container_name: influxdb ports: - 8086:8086 - 25826:25826/udp networks: - sample-net volumes: - ./:/var/lib/influxdb - ./influxdb.conf:/etc/influxdb/influxdb.conf:ro - ./types.db:/usr/share/collectd/types.db:ro grafana: image: grafana/grafana container_name: grafana restart: always ports: - 3000:3000 networks: - sample-net networks: sample-net:According to the settings in
volumes:, InfluxDB will use
1. The working directory as storage for the database.
2. Theinfluxdb.confconfiguration file that is located in the working directory.
3. Thetypes.dbfile with the types of measurable values that is located in the working directory. -
Build the services by executing the
docker-compose buildcommand. -
Run the services by executing the
docker-compose up -d influxdb grafanacommand. -
Create a database named
collectdfor the corresponding InfluxDB data source by executing the following command:The InfluxDB server should return a response similar to:
At this point, InfluxDB should be running, ready to receive metrics from collectd, and Grafana should be ready to monitor and visualize the data stored in InfluxDB.
Configuring collectd
Configure collectd to export metrics to InfluxDB:
-
Connect to the filter node (for example, by using the SSH protocol). Make sure you are logged in as root or another account with superuser privileges.
-
Create a file named
/etc/collectd/collectd.conf.d/export-to-influxdb.confwith the following content:The following entities are configured here:
- The server, to send metrics to (
10.0.30.30) - The port that server listens on (
25826/UDP)
- The server, to send metrics to (
-
Restart the
collectdservice by running the appropriate command:
Now InfluxDB receives all the metrics of the filter node. You can visualize the metrics you are interested in and monitor them with Grafana.