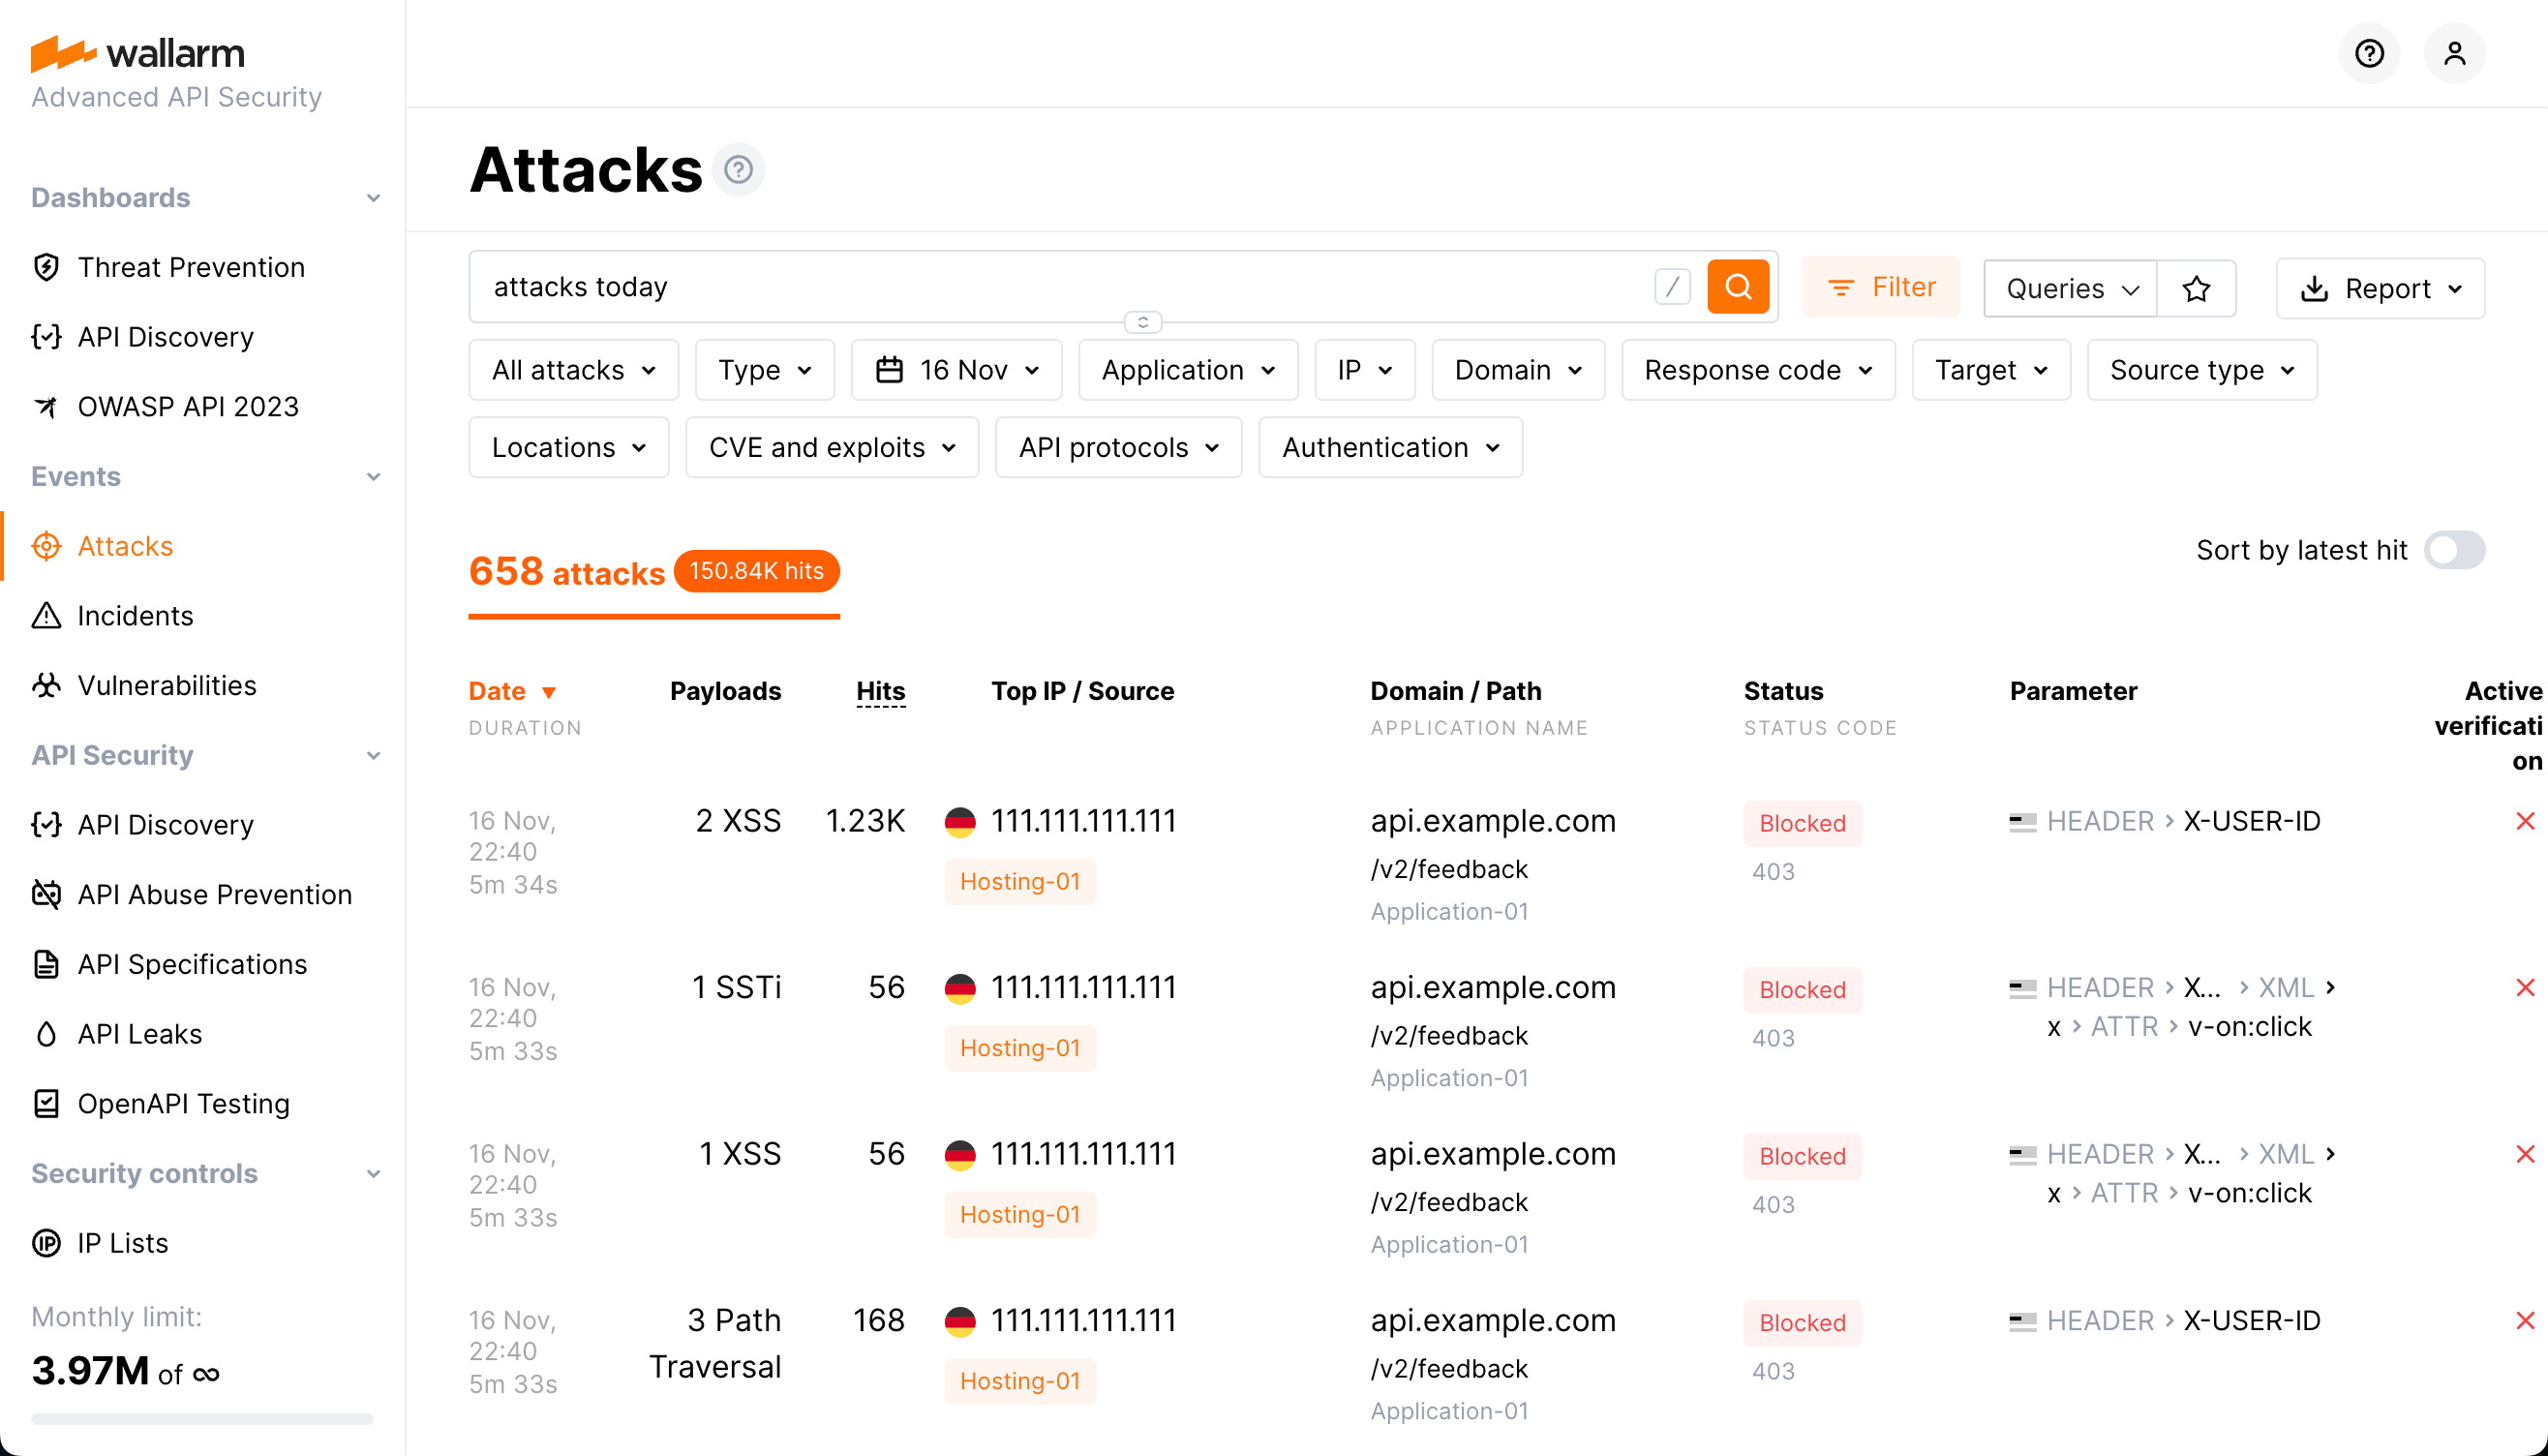
Checking Attacks
In Wallarm Console, you can check detected attacks in the Attacks section. To find required data, please use the search field as described here or manually set required search filters.
Attacks
-
Date: The date and time of the malicious request.
- If several requests of the same type were detected at short intervals, the attack duration appears under the date. Duration is the time period between the first request of a certain type and the last request of the same type in the specified timeframe.
- If the attack is happening at the current moment, an appropriate label is displayed.
-
Payloads: Attack type and the number of unique malicious payload.
-
Hits: The number of hits (requests) in the attack in the specified time frame.
-
Top IP / Source: The IP address from which the malicious requests originated. When the malicious requests originate from several IP addresses, the interface shows the IP address responsible for the most requests. There is also the following data displayed for the IP address:
- The total number of IP addresses from which the requests in the same attack originated during the specified timeframe.
- The country/region in which the IP address is registered (if it was found in the databases like IP2Location or others)
- The source type, like Public proxy, Web proxy, Tor or the cloud platform the IP registered in, etc (if it was found in the databases like IP2Location or others)
- The Malicious IPs label will appear if the IP address is known for malicious activities. This is based on public records and expert validations
-
Domain / Path: The domain, path and the application ID that the request targeted.
-
Status: The attack blocking status (depends on the traffic filtration mode):
- Blocked: all hits of the attack were blocked by the filtering node.
- Partially blocked: some hits of the attack were blocked and others were only registered.
- Monitoring: all hits of the attack were registered but not blocked.
-
Parameter: The malicious request's parameters and tags of parsers applied to the request
-
Active verification: The attack verification status.
To sort attacks by the time of the last request, you can use the Sort by latest hit switch.
Attacks that are currently happening
You can check attacks in real time. If your company resources are receiving malicious requests, the following data is displayed in Wallarm Console:
-
The number of events that have happened in the last 5 minutes, which will be displayed next to the Attacks section name and inside the section.
-
Special label, which is shown under the event date in the attacks or the incidents table.
You may also add the now keyword to the search field to only display those events happening at the moment: attacks now.
API calls to get attacks
To get the attack details, you can call the Wallarm API directly besides using the Wallarm Console UI. Below is the example of the API call for getting the first 50 attacks detected in the last 24 hours.
Please replacing TIMESTAMP with the date 24 hours ago converted to the Unix Timestamp format.
curl -v -X POST "https://us1.api.wallarm.com/v1/objects/attack" -H "X-WallarmApi-Token: <YOUR_TOKEN>" -H "accept: application/json" -H "Content-Type: application/json" -d "{ \"filter\": { \"clientid\": [YOUR_CLIENT_ID], \"time\": [[TIMESTAMP, null]] }, \"offset\": 0, \"limit\": 50, \"order_by\": \"last_time\", \"order_desc\": true}"
curl -v -X POST "https://api.wallarm.com/v1/objects/attack" -H "X-WallarmApi-Token: <YOUR_TOKEN>" -H "accept: application/json" -H "Content-Type: application/json" -d "{ \"filter\": { \"clientid\": [YOUR_CLIENT_ID], \"time\": [[TIMESTAMP, null]] }, \"offset\": 0, \"limit\": 50, \"order_by\": \"last_time\", \"order_desc\": true}"
Getting 100 or more attacks
For attack and hit sets containing 100 or more records, it is best to retrieve them in smaller pieces rather than fetching large datasets all at once, in order to optimize performance. Explore the corresponding request example

