What is new in Wallarm node (if upgrading an EOL node)
This page lists the changes available when upgrading the node of the deprecated version (3.6 and lower) up to version 5.0. Listed changes are available for both the regular (client) and multi-tenant Wallarm nodes.
Wallarm nodes 3.6 and lower are deprecated
Wallarm nodes 3.6 and lower are recommended to be upgraded since they are deprecated.
Node configuration and traffic filtration have been significantly simplified in the Wallarm node of version 5.x. Some settings of node 5.x are incompatible with the nodes of older versions. Before upgrading the modules, please carefully review the list of changes and general recommendations.
All-in-one installer and DEB/RPM packages deprecation
Now, when installing and upgrading Wallarm node as a dynamic module for NGINX in various environments, you use the all-in-one installer designed to streamline and standardize the process of installation. This installer automatically identifies your operating system’s and NGINX versions, and install all the necessary dependencies.
The installer simplifies the process by automatically performing the following actions:
-
Checking your OS and NGINX version.
-
Adding Wallarm repositories for the detected OS and NGINX version.
-
Installing Wallarm packages from these repositories.
-
Connecting the installed Wallarm module to your NGINX.
-
Connecting the filtering node to Wallarm Cloud using the provided token.
See details on how to upgrade the node with all-in-one installer →
The DEB/RPM packages for the node installation have the "deprecated" status now.
Removal of collectd
The collectd service, previously installed on all filtering nodes, has been removed along with its related plugins. Metrics are now collected and sent using Wallarm's built-in mechanisms, reducing dependencies on external tools.
Use the /wallarm-status endpoint, which replaces collectd by providing the same metrics in Prometheus and JSON formats.
As a result of this change, also the following changed in the configuration rules:
-
The
/opt/wallarm/etc/collectd/wallarm-collectd.conf.d/wallarm-tarantool.confcollectd configuration file is no longer used. -
If you previously used collectd to forward metrics via a network plugin, such as:
LoadPlugin network

<Plugin "network">
    Server "<Server IPv4/v6 address or FQDN>" "<Server port>"
</Plugin>
you should now switch to scraping
/wallarm-statusvia Prometheus.
API Sessions
We introduce a unique security feature tailored for the API economy - API Sessions. This addition gives you visibility into attacks, anomalies, and user behavior across your APIs, providing transparency into how users interact with your APIs and applications.
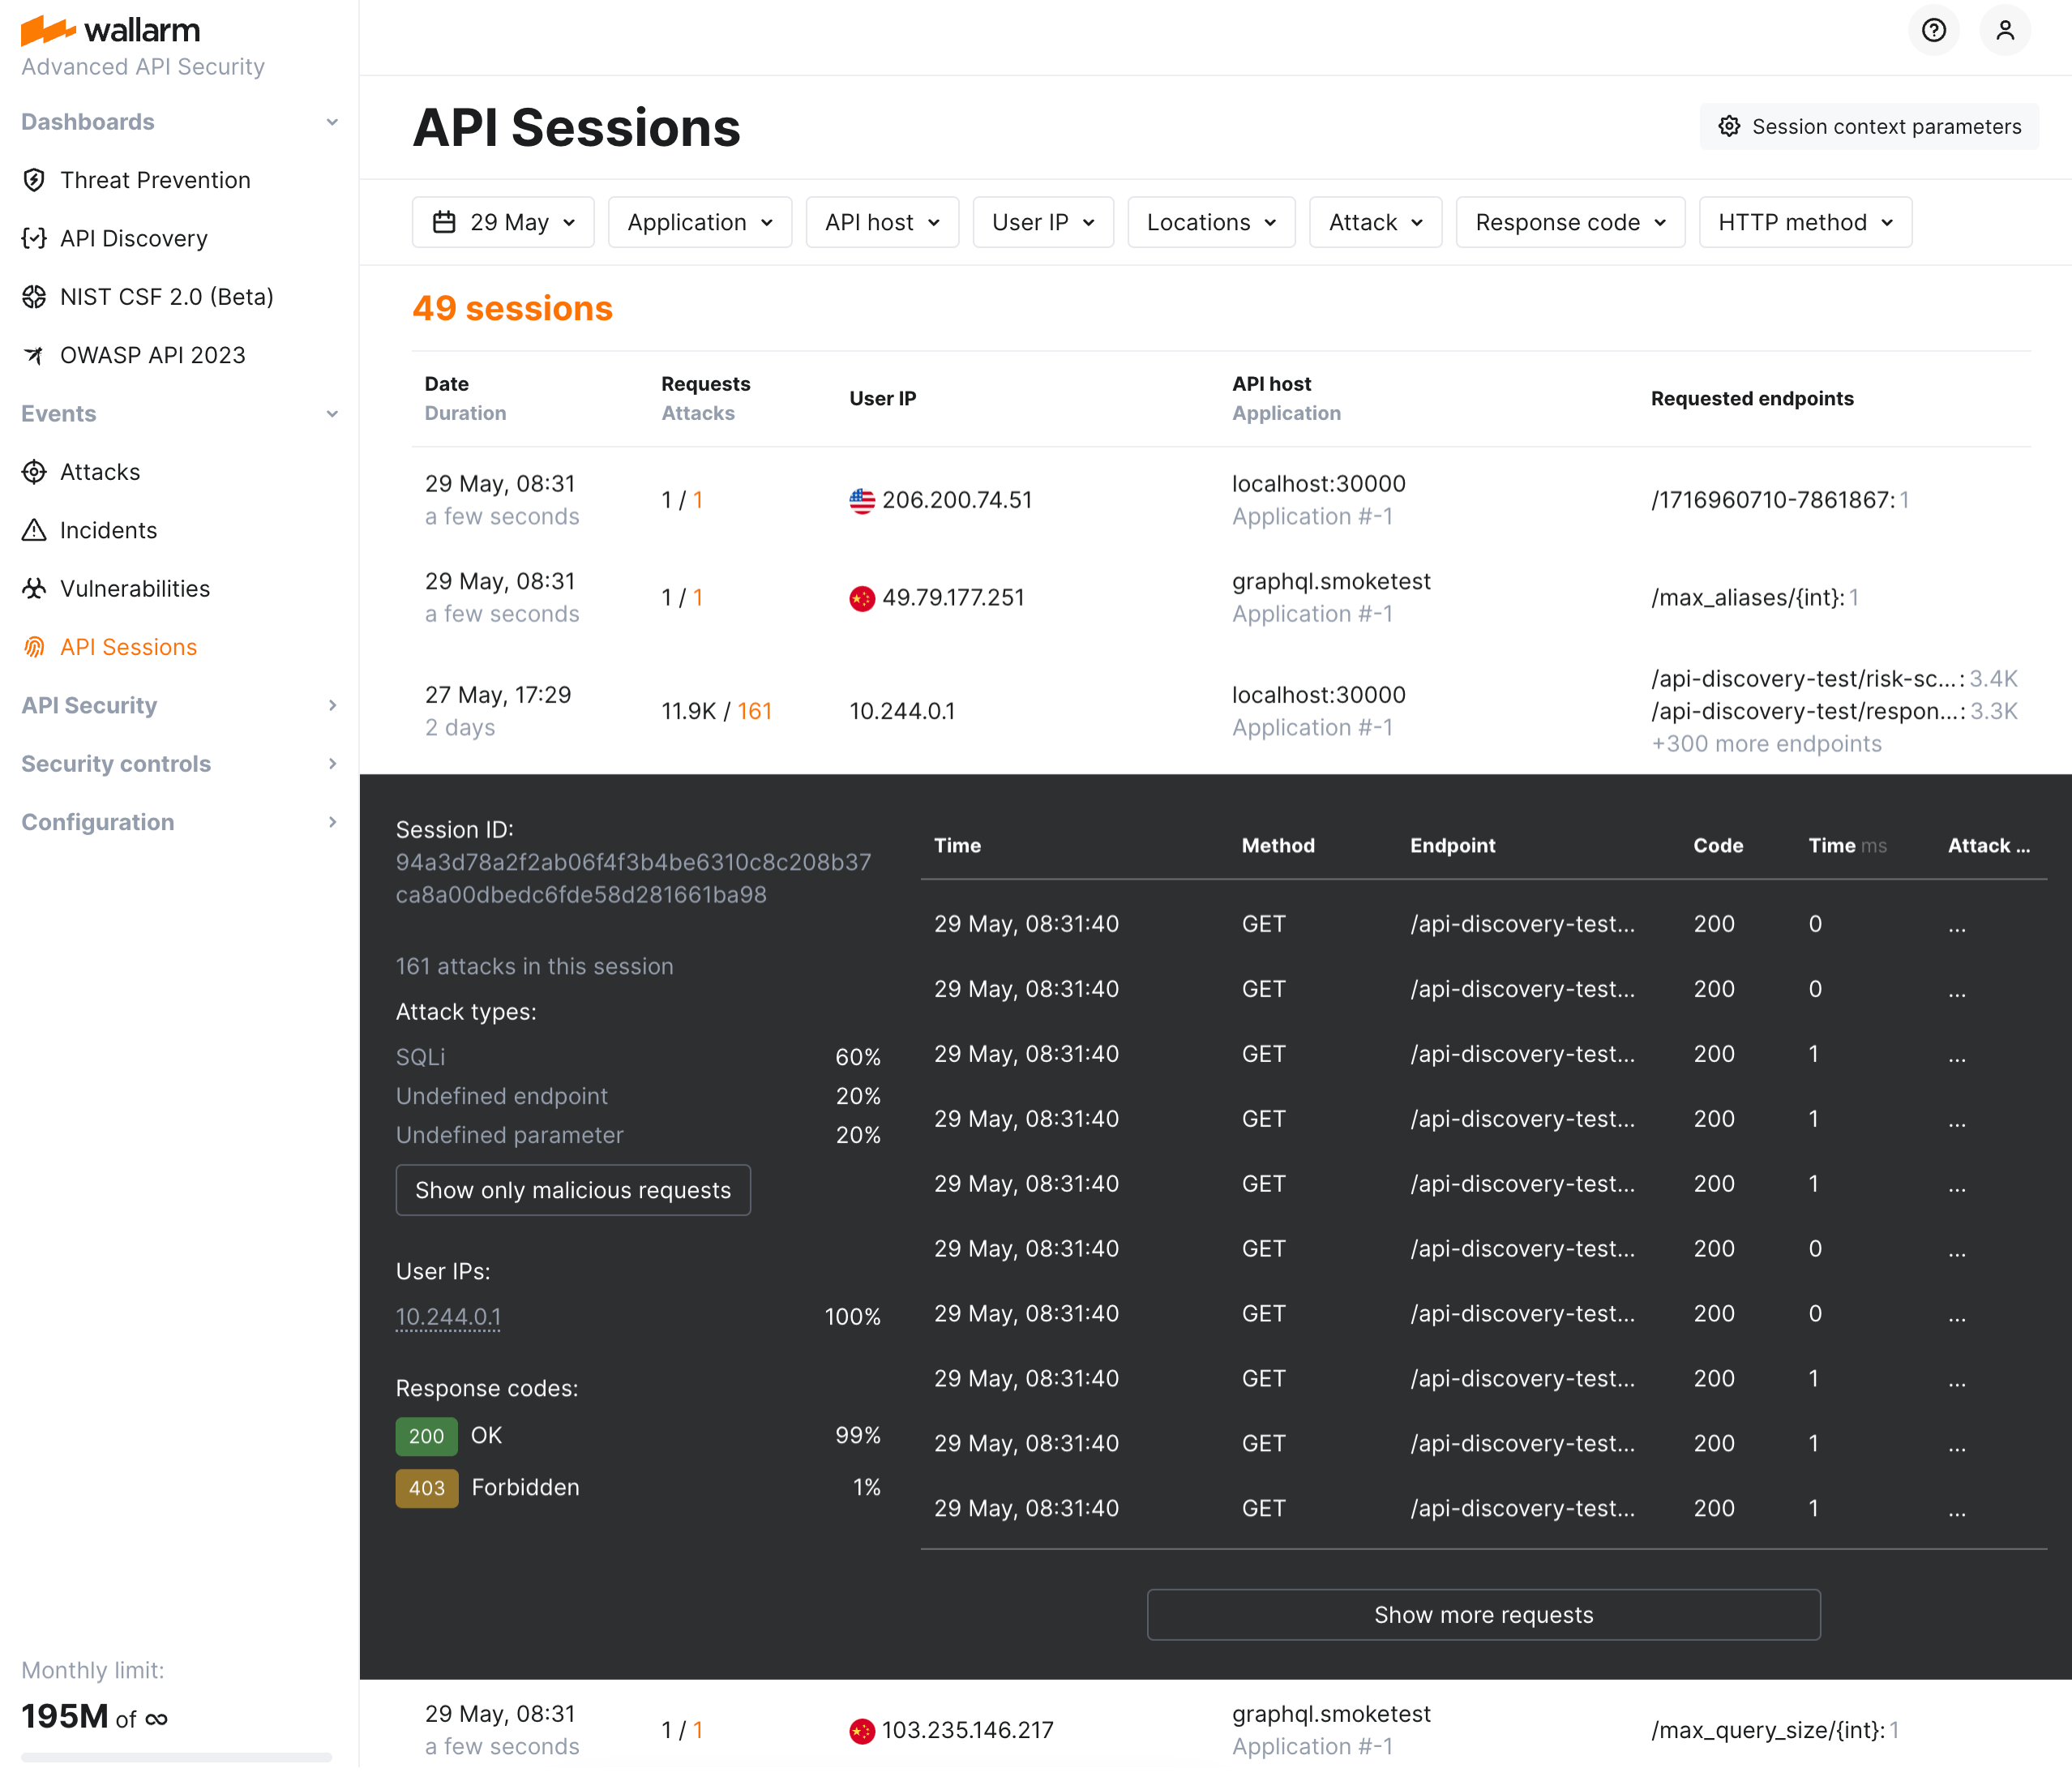
Attackers often exploit vulnerable endpoints by blending their actions with legitimate user behavior. Without the full context of how those sessions unfold, identifying patterns or threats becomes a time-consuming process involving multiple tools and systems. Organizations do not have an appropriate visibility at the API level.
With API Sessions, security teams now have the ability to see all relevant activity grouped by user session, offering unparalleled visibility into attack sequences, user anomalies, and normal behaviors. Investigations that once took hours or days can now be conducted directly from the Wallarm Console in just minutes.
Key features:
-
Visibility into attacks, anomalies, and user behavior: View and analyze every request made in a session to track attack vectors and suspicious patterns.
-
Support for both legacy and modern sessions: Whether your applications rely on cookie-based sessions or JWT/OAuth, Wallarm API Sessions ensures full compatibility and visibility.
-
Seamlessly navigate between individual attacks and their sessions.
With API Sessions, security teams can now easily:
-
Investigate the full activity of threat actors to understand potential attack paths and compromised resources.
-
Identify how shadow or zombie APIs are being accessed, mitigating risks from undocumented or outdated APIs.
-
Share key insights with colleagues to foster collaboration during security investigations.
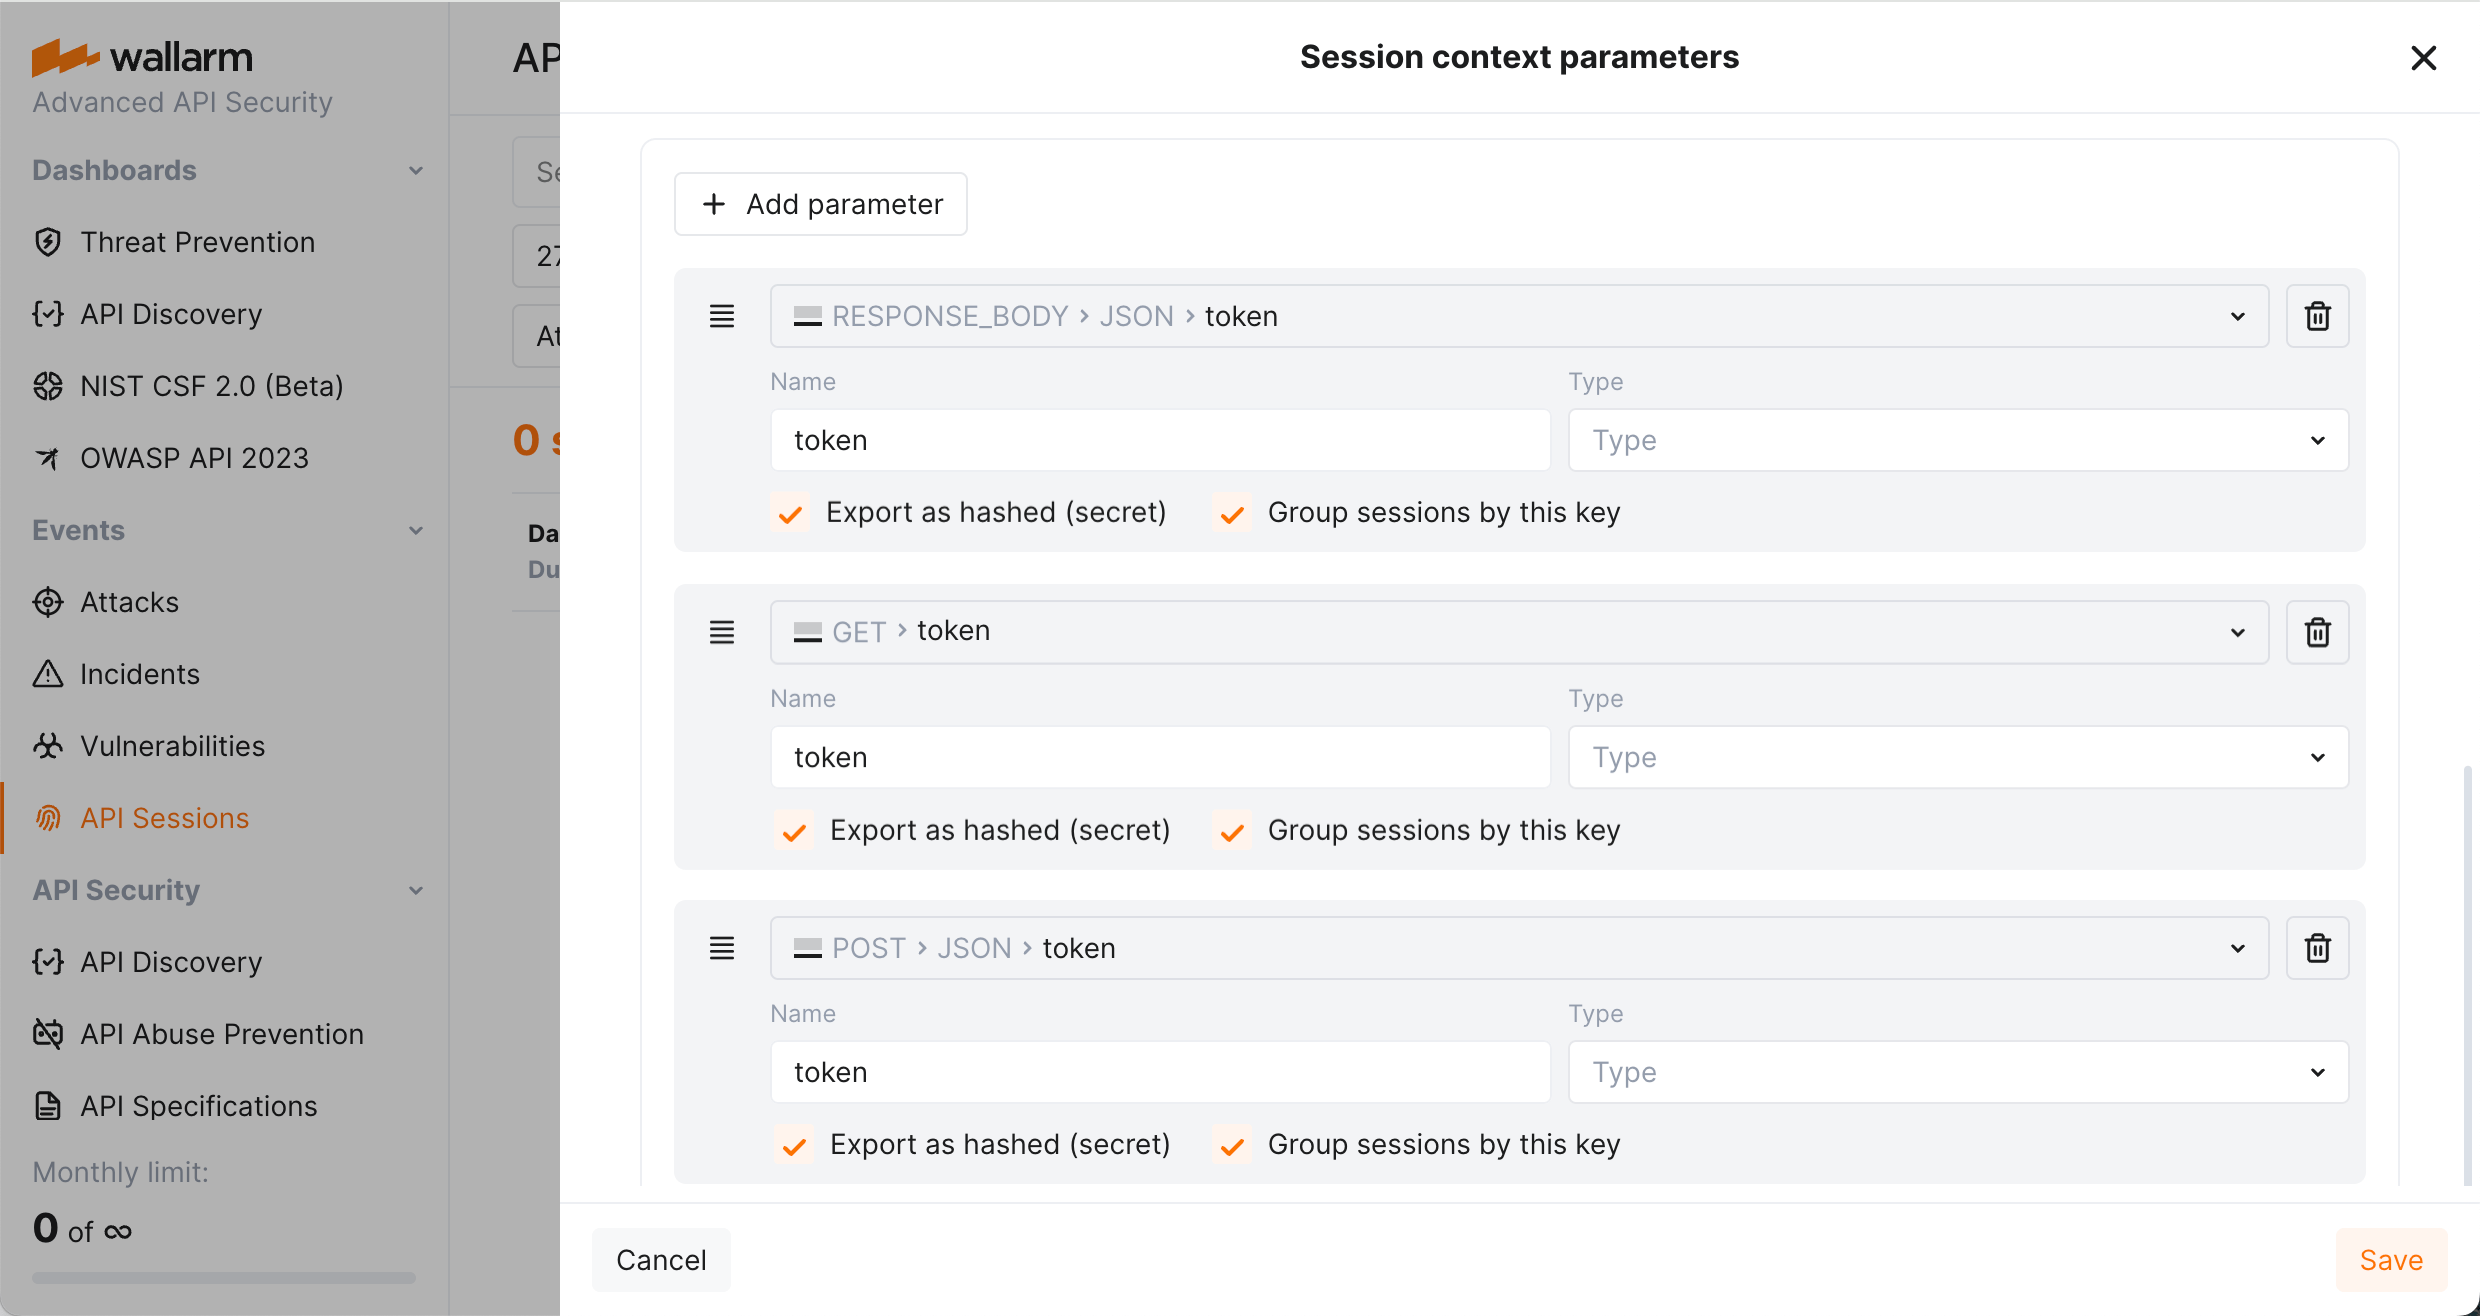
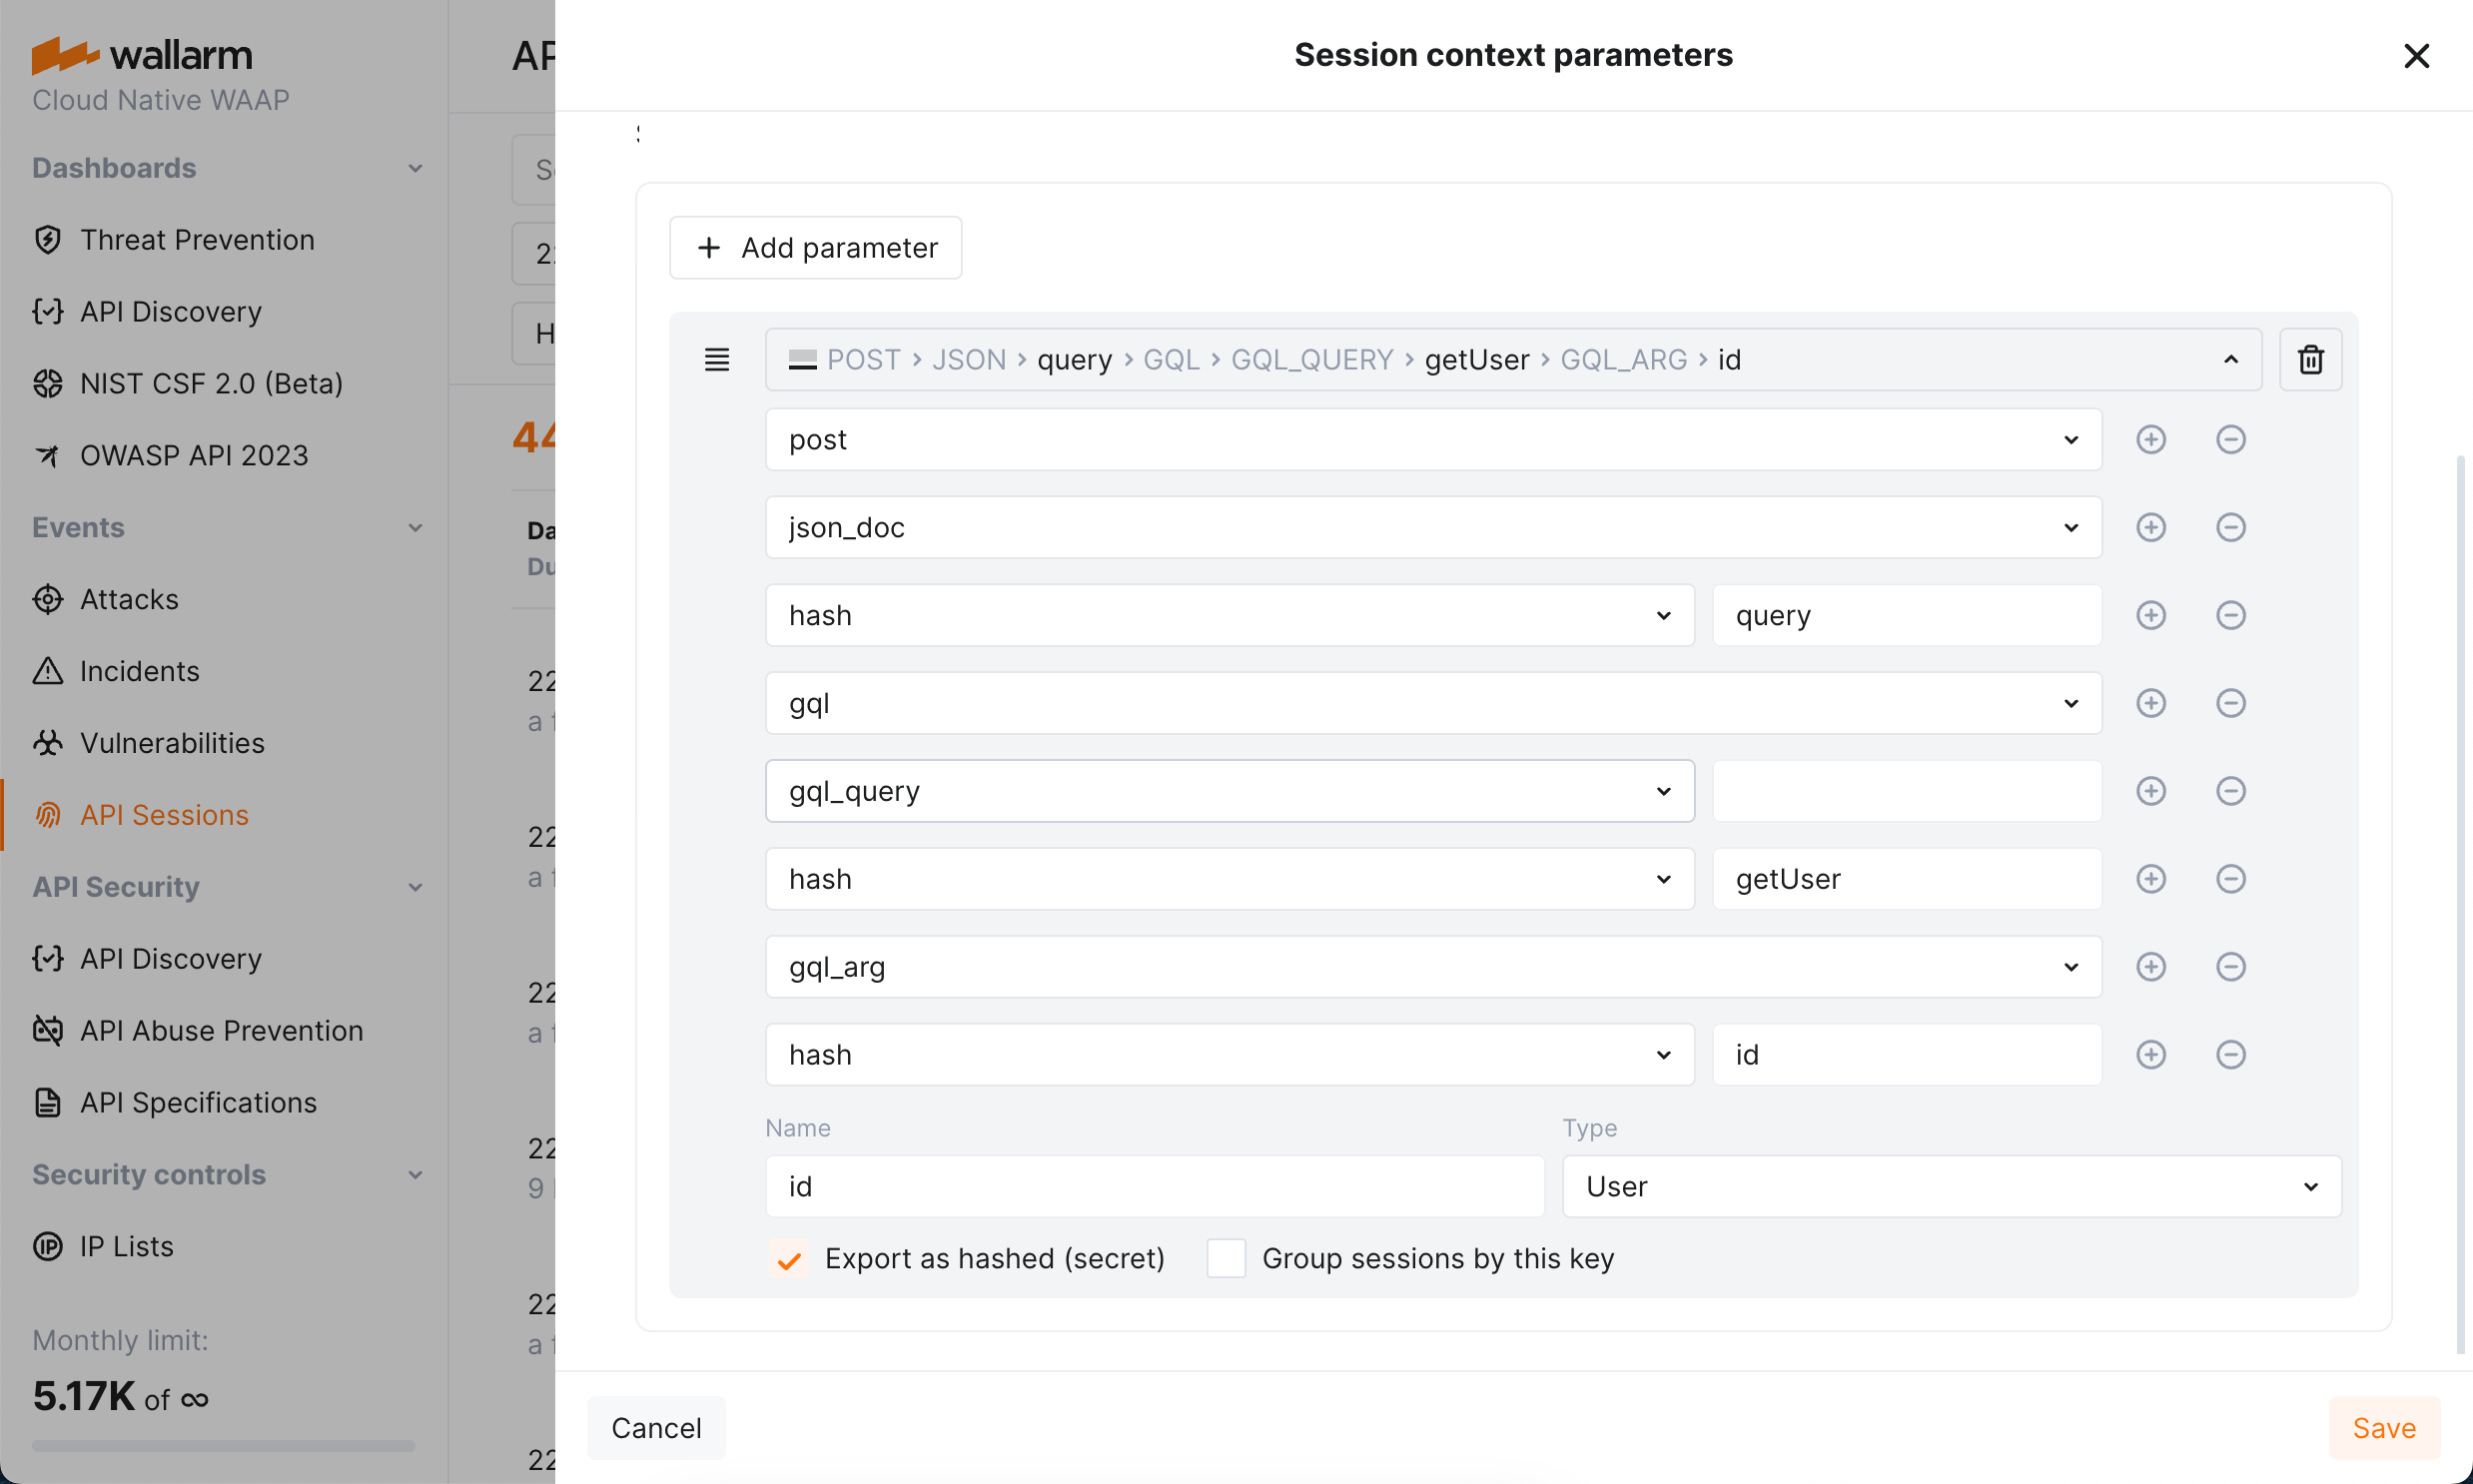
Response parameters in API Sessions
Wallarm's API Sessions provide visibility into sequences of user activities. With this addition not only request but also response information is available within each session:
-
You can configure any headers and parameters of responses to be displayed within their corresponding requests providing a clear and full picture of user activities.
-
You can use response parameters as grouping keys for sessions (see example), which makes grouping of requests into sessions more precise.
Rate limits
The lack of proper rate limiting has been a significant problem for API security, as attackers can launch high-volume requests causing a denial of service (DoS) or overload the system, which hurts legitimate users.
With Wallarm's rate limiting feature, security teams can effectively manage the service's load and prevent false alarms, ensuring that the service remains available and secure for legitimate users. This feature offers various connection limits based on request and session parameters, including traditional IP-based rate limiting, JSON fields, base64 encoded data, cookies, XML fields, and more.
For example, you can limit API connections for each user, preventing them from making thousands of requests per minute. This would put a heavy load on your servers and could cause the service to crash. By implementing rate limiting, you can protect your servers from overload and ensure that all users have fair access to the API.
You can configure rate limits easily in the Wallarm Console UI → Rules → Advanced rate limiting by specifying the rate limit scope, rate, burst, delay, and response code for your particular use case.
Guide on rate limit configuration →
Although the rate limiting rule is the recommended method for setting up the feature, you can also configure rate limits using the new NGINX directives:
Credential stuffing detection  
Wallarm introduces real-time detection and notifications for credential stuffing attempts. Credential stuffing, the automated submission of stolen or weak username/email and password pairs into website login forms to illegitimately access user accounts, is now closely monitored. This feature allows you to identify accounts with compromised credentials and take action to secure them, such as notifying account owners and temporarily suspending account access.
Learn how to configure Credential Stuffing Detection
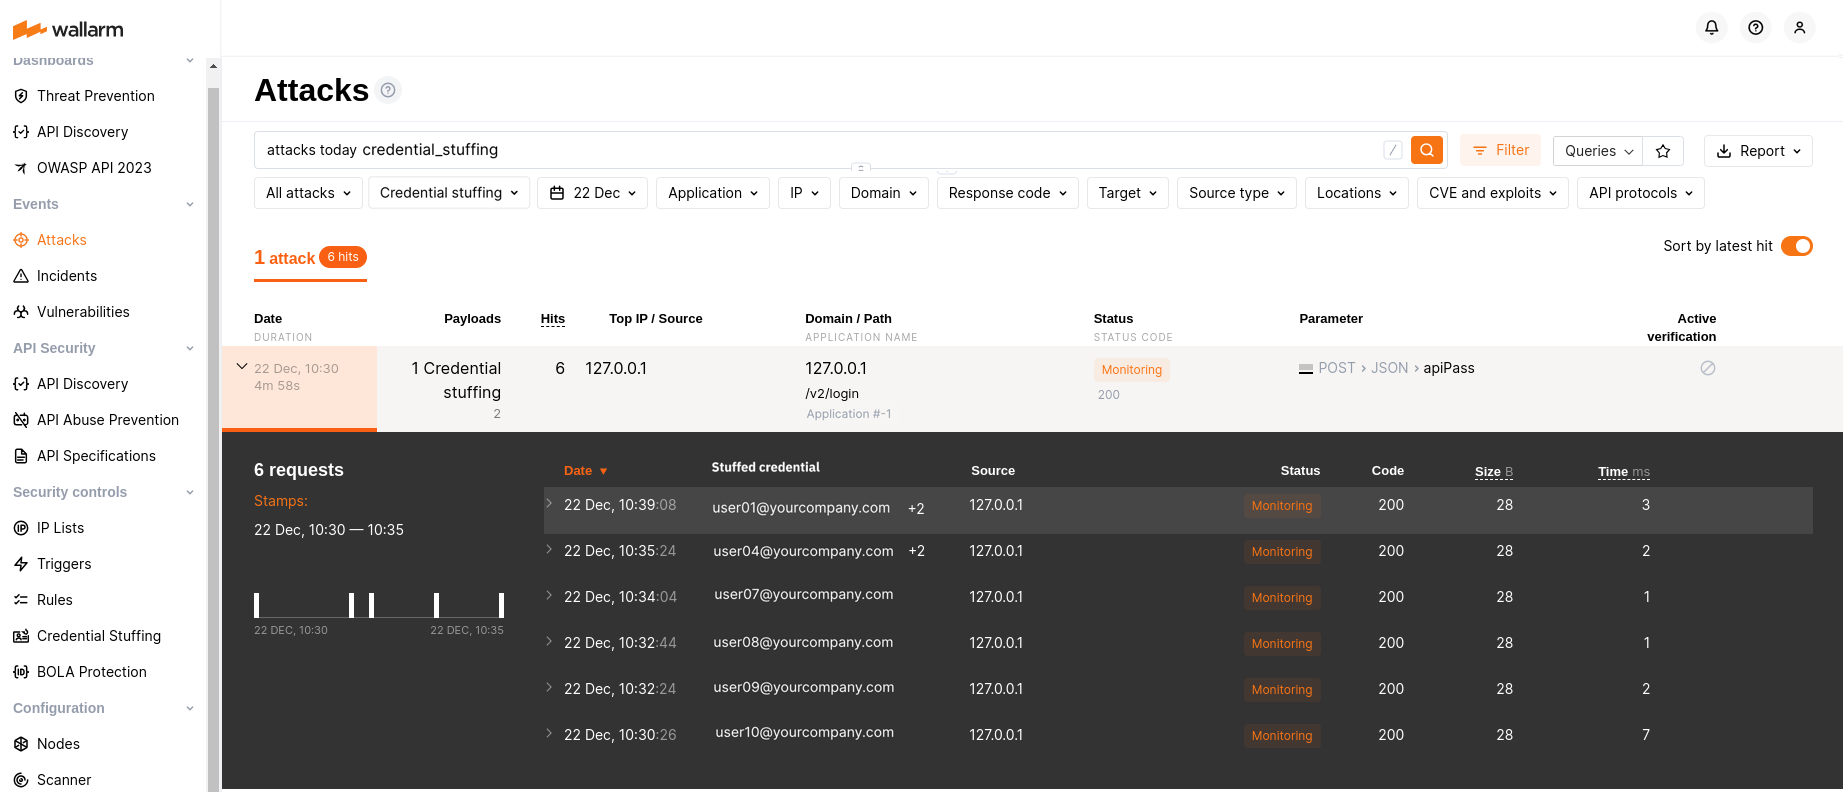
Selected artifacts supporting credential stuffing detection
A limited selection of artifacts, such as the all-in-one installer, NGINX Ingress Controller, NGINX-based Docker image, and cloud images (AMI, GCP Image), now support the newly introduced credential stuffing detection feature.
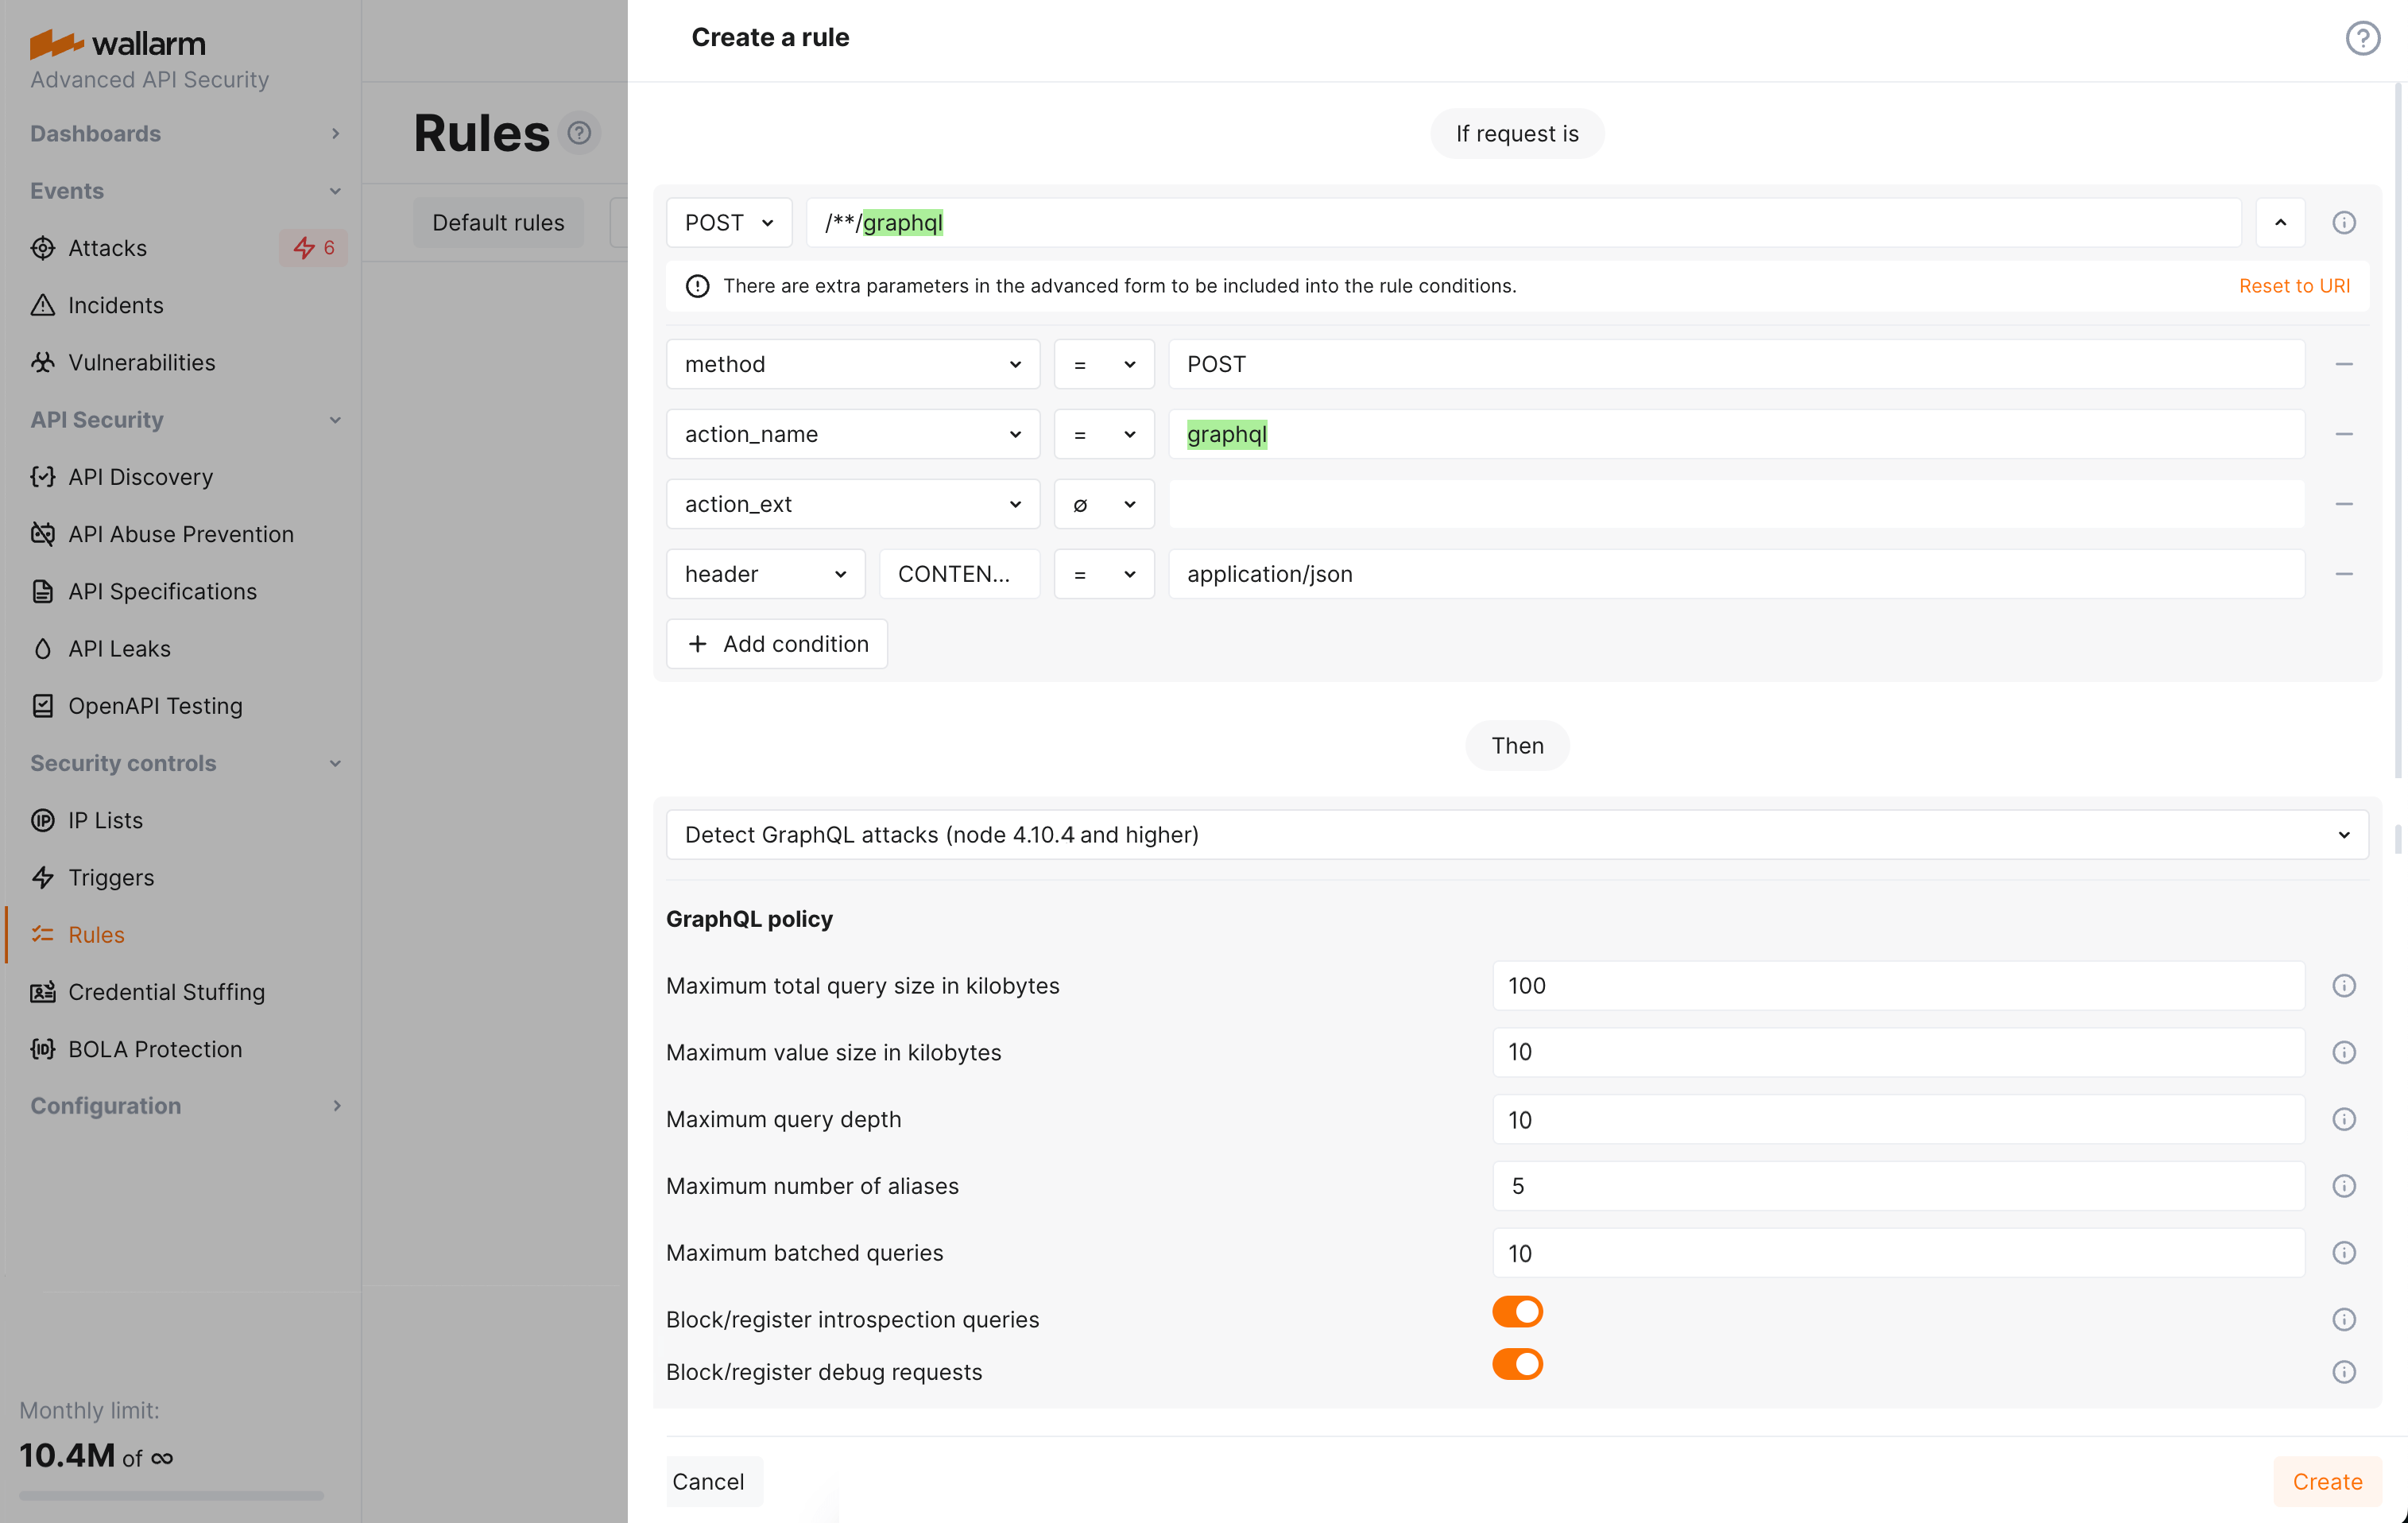
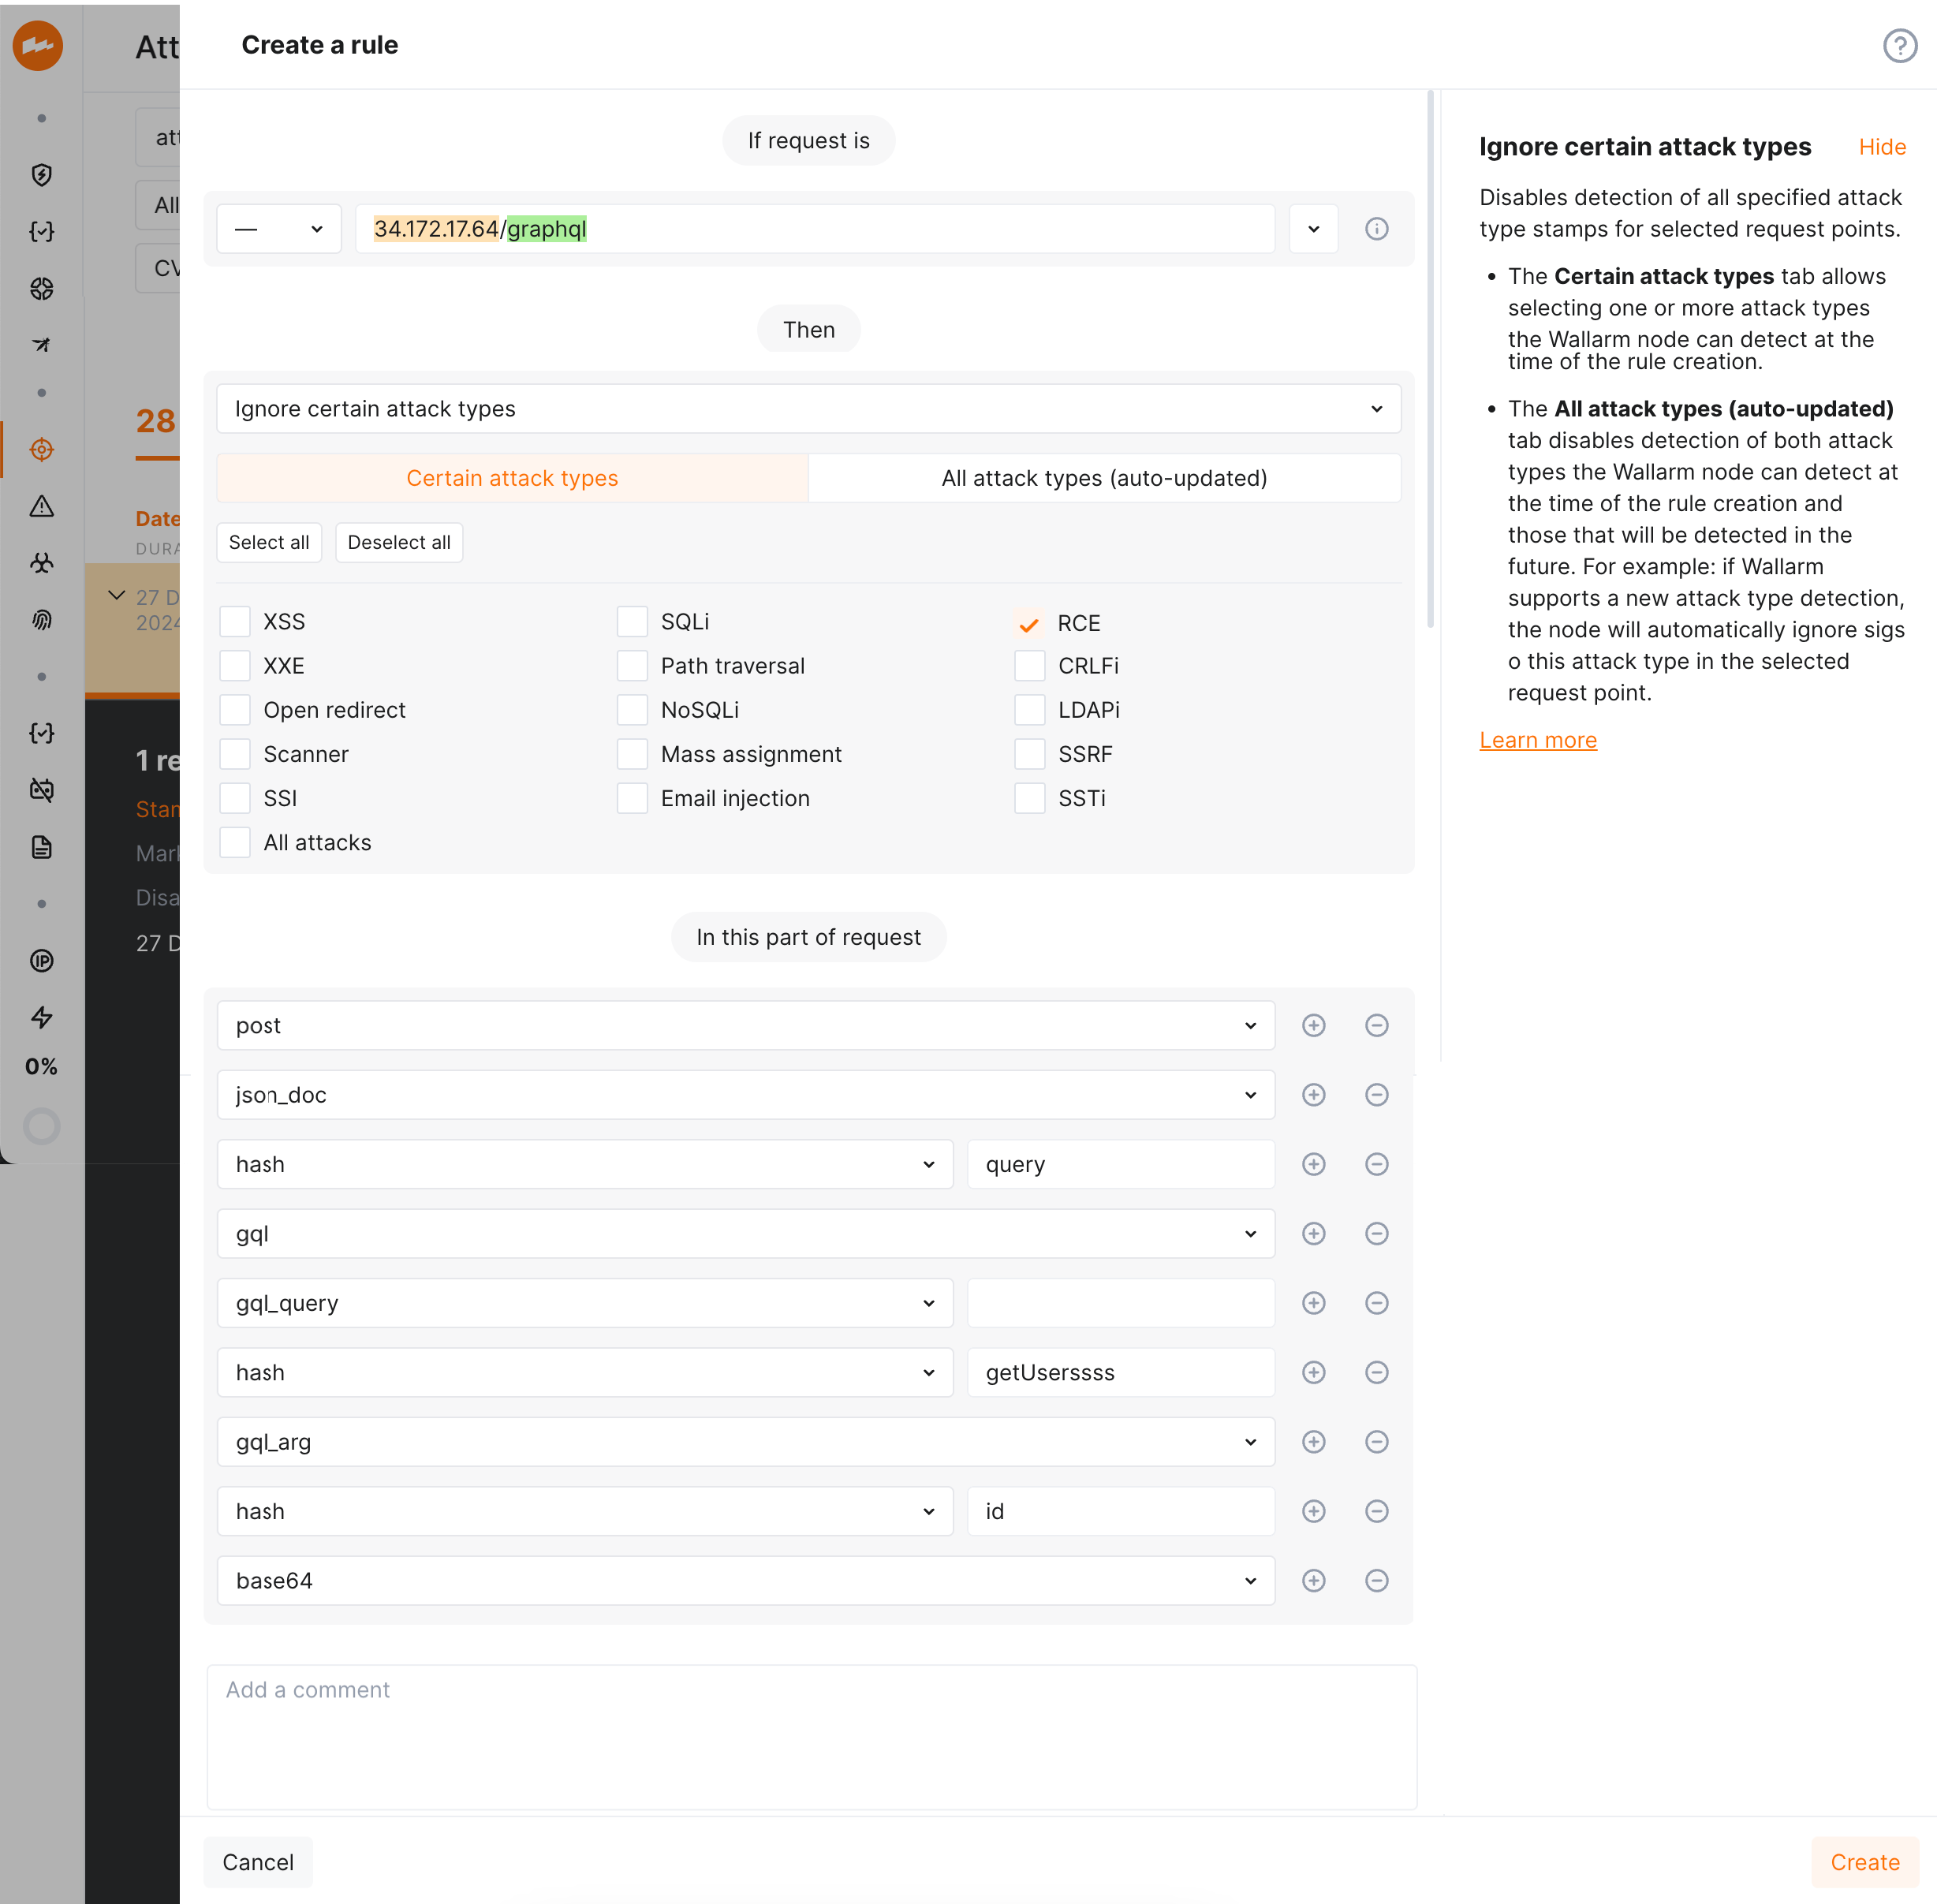
GraphQL API protection 
Wallarm detects regular attacks (SQLi, RCE, etc.) in GraphQL by default. However, some aspects of the protocol allow implementing GraphQL specific attacks related to excessive information exposure and DoS.
Wallarm introduces protection from these attacks. Protection is set by configuring your organization's GraphQL policy - a set of limits for the GraphQL requests. Requests exceeding any of set limits the filtering node will handle in accordance with the active filtration mode - will only register policy violations or will register and block such attempts.
To start using the functionality, you need to create at least one Detect GraphQL attacks rule in Wallarm Console.
Learn how to configure GraphQL API Protection
Mitigation Controls
We introduce a unified management center for all Wallarm attack mitigation settings - Mitigation Controls. With mitigation controls you can:
-
View and manage all Wallarm mitigation settings in one place.
-
Manage all in a unified way (all controls have similar configuration UI and options).
-
Easily overview the current mode of each control: is it active? is it just monitoring or also blocking?
-
Get quick overview of attacks caught by each control.
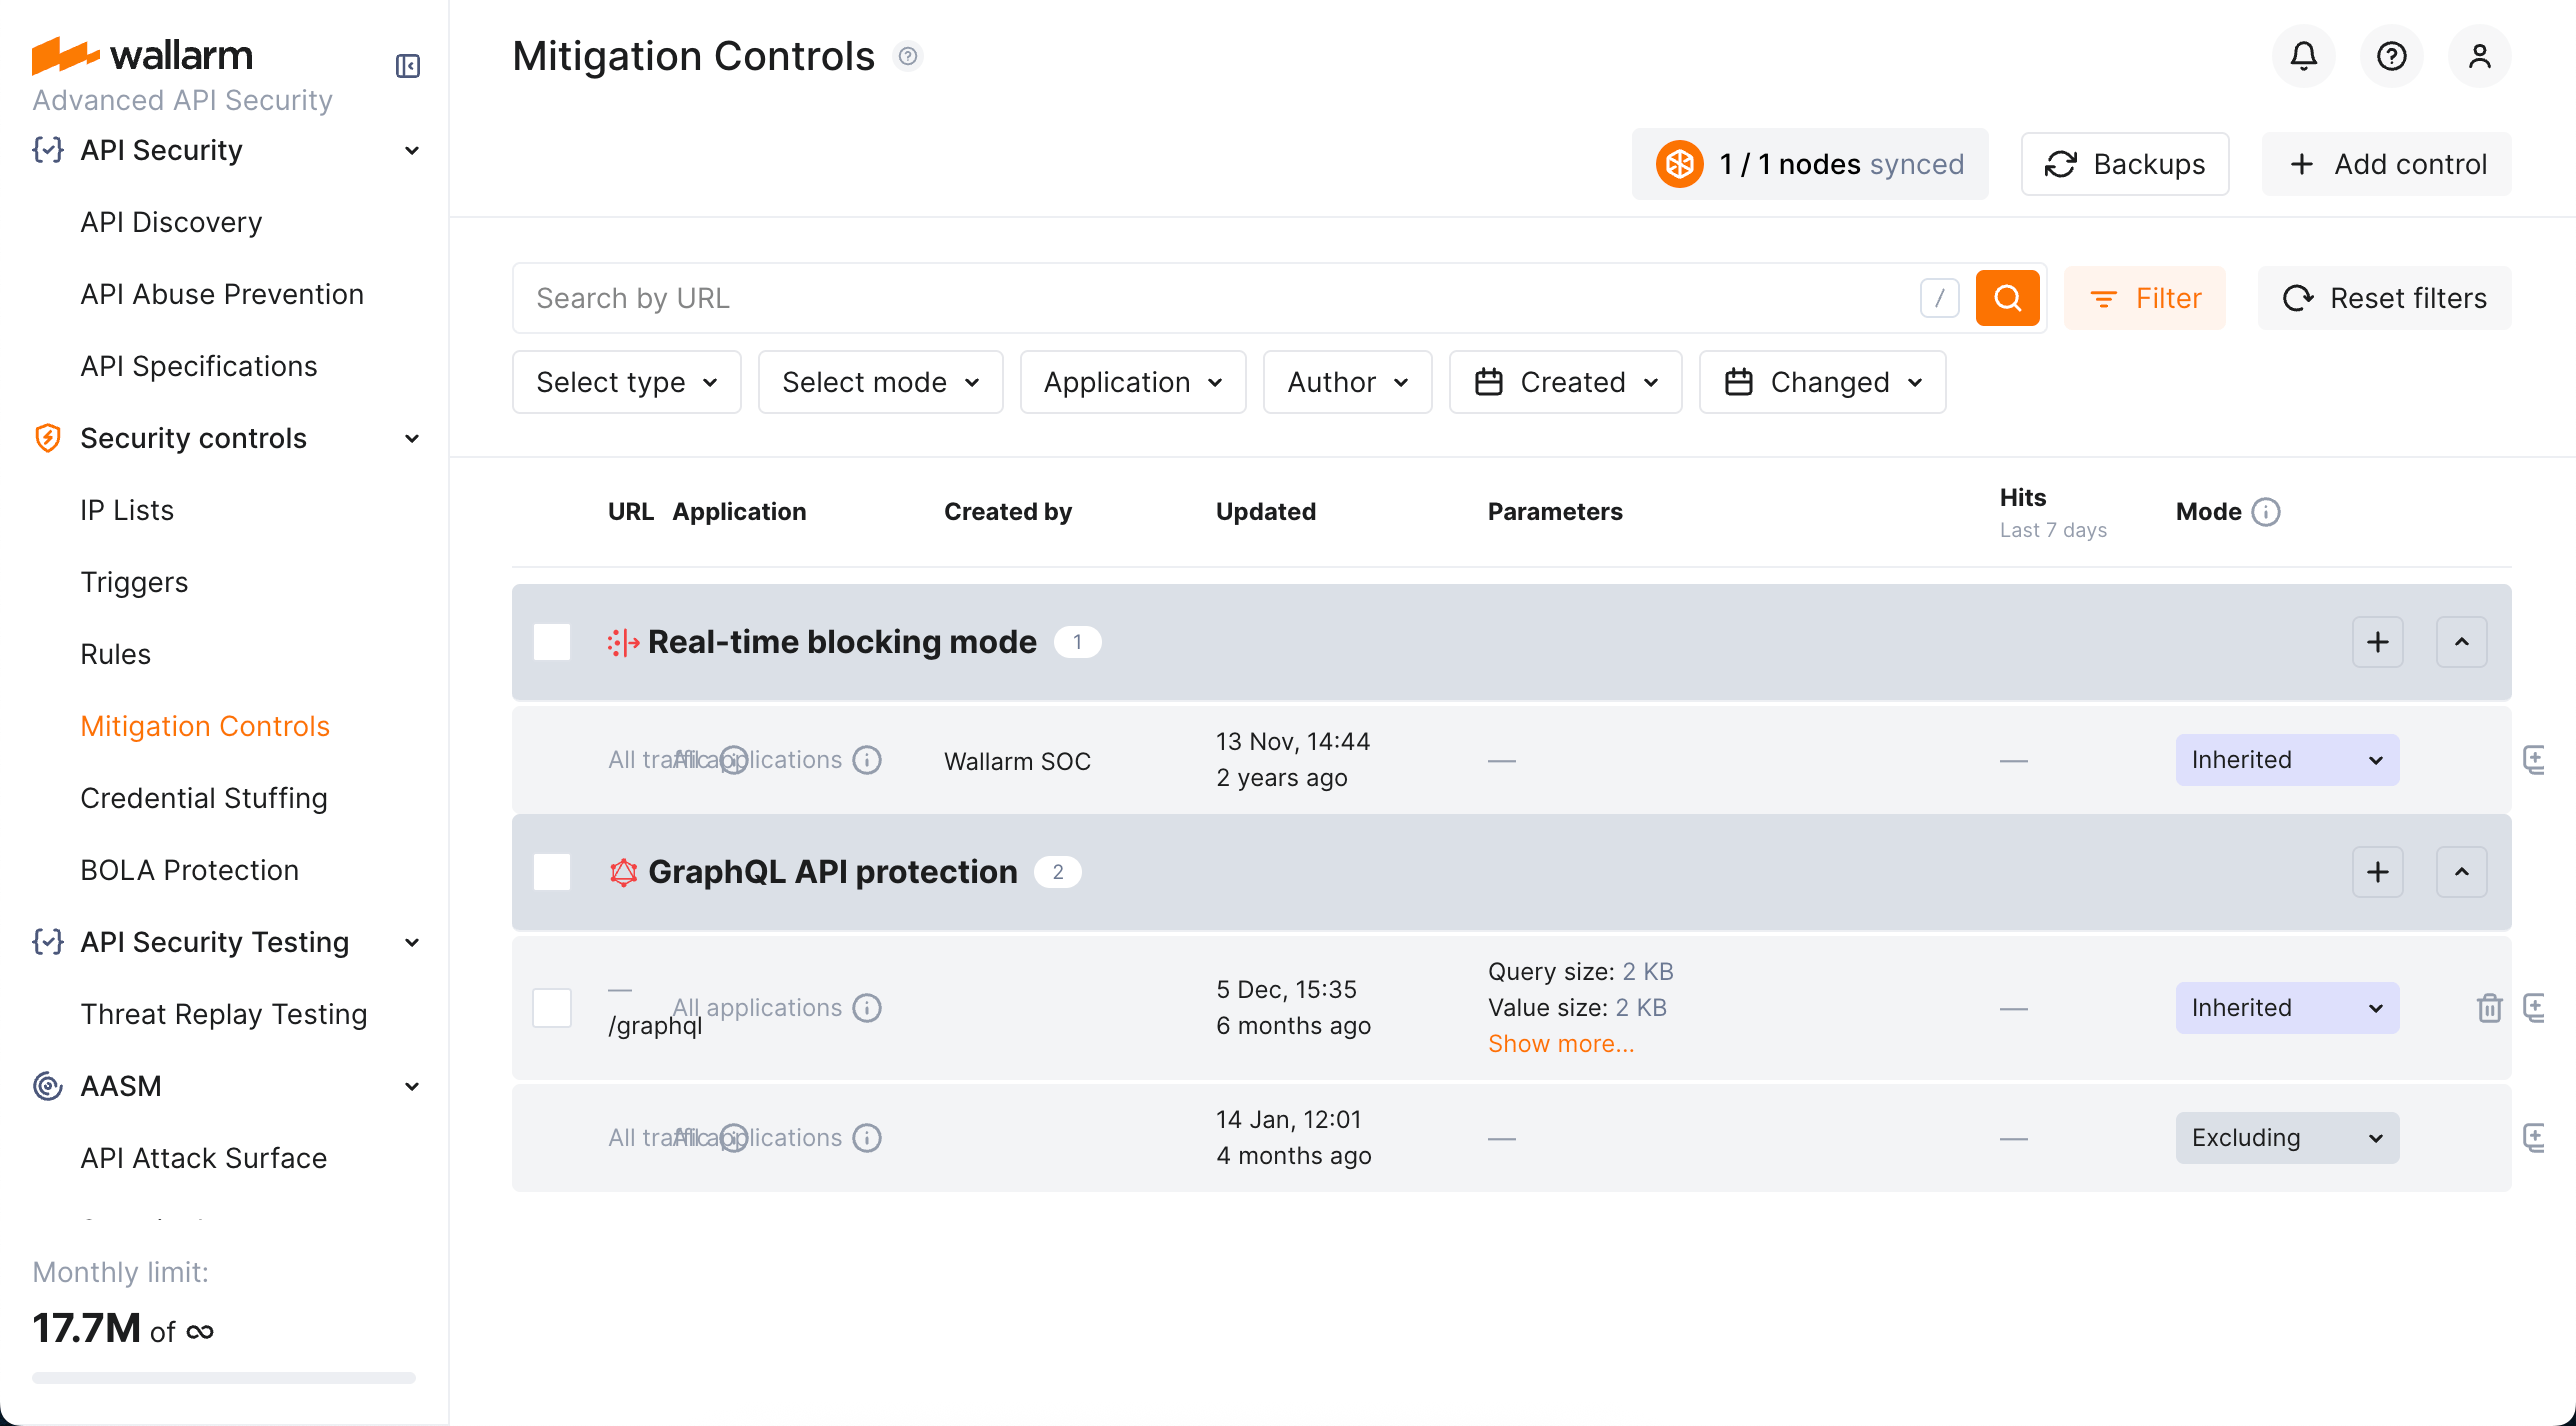
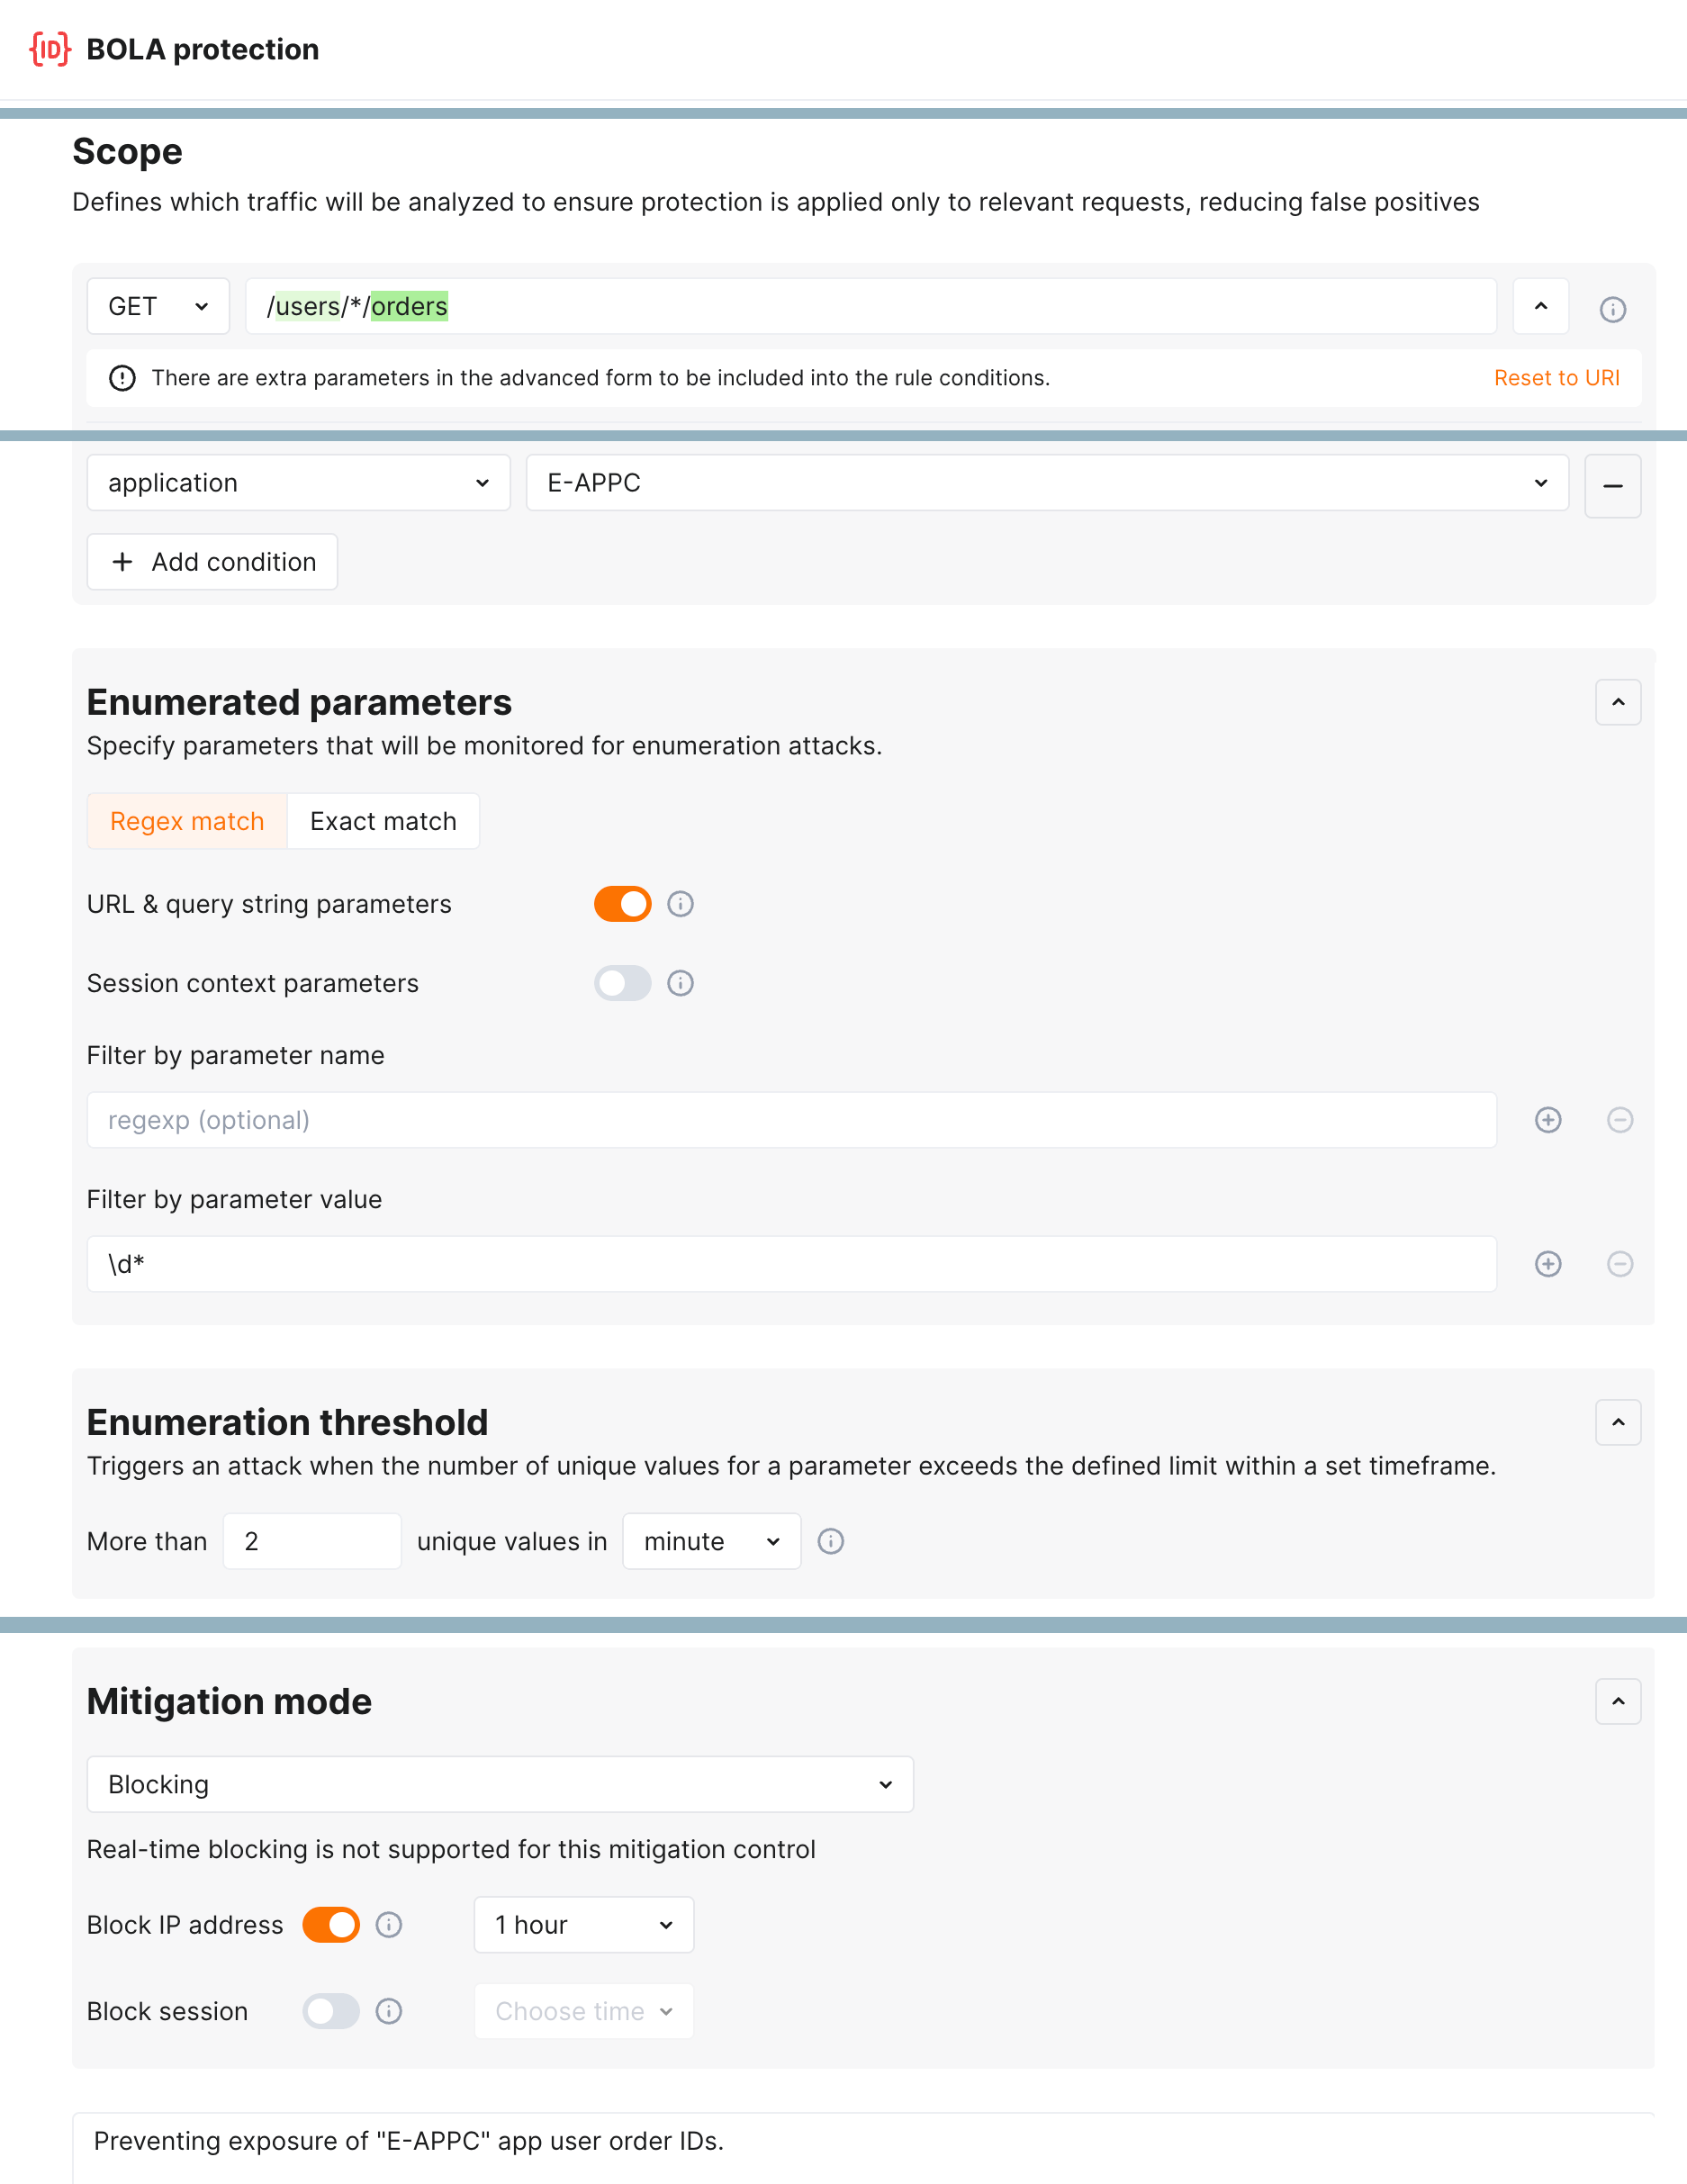
Enumeration attack protection
New level of protection from enumeration attacks comes with enumeration mitigation controls:
Comparing to triggers that were used for this protection before, mitigation controls:
-
Allow selecting which parameters will be monitored for enumeration attempts.
-
Allow advanced sophisticated filtering of which exact requests will be counted.
-
Provide deep integration with API Sessions: the detected attacks are displayed within a corresponding session, providing you with full context of what was happening and why the session activities were marked as attack and blocked.
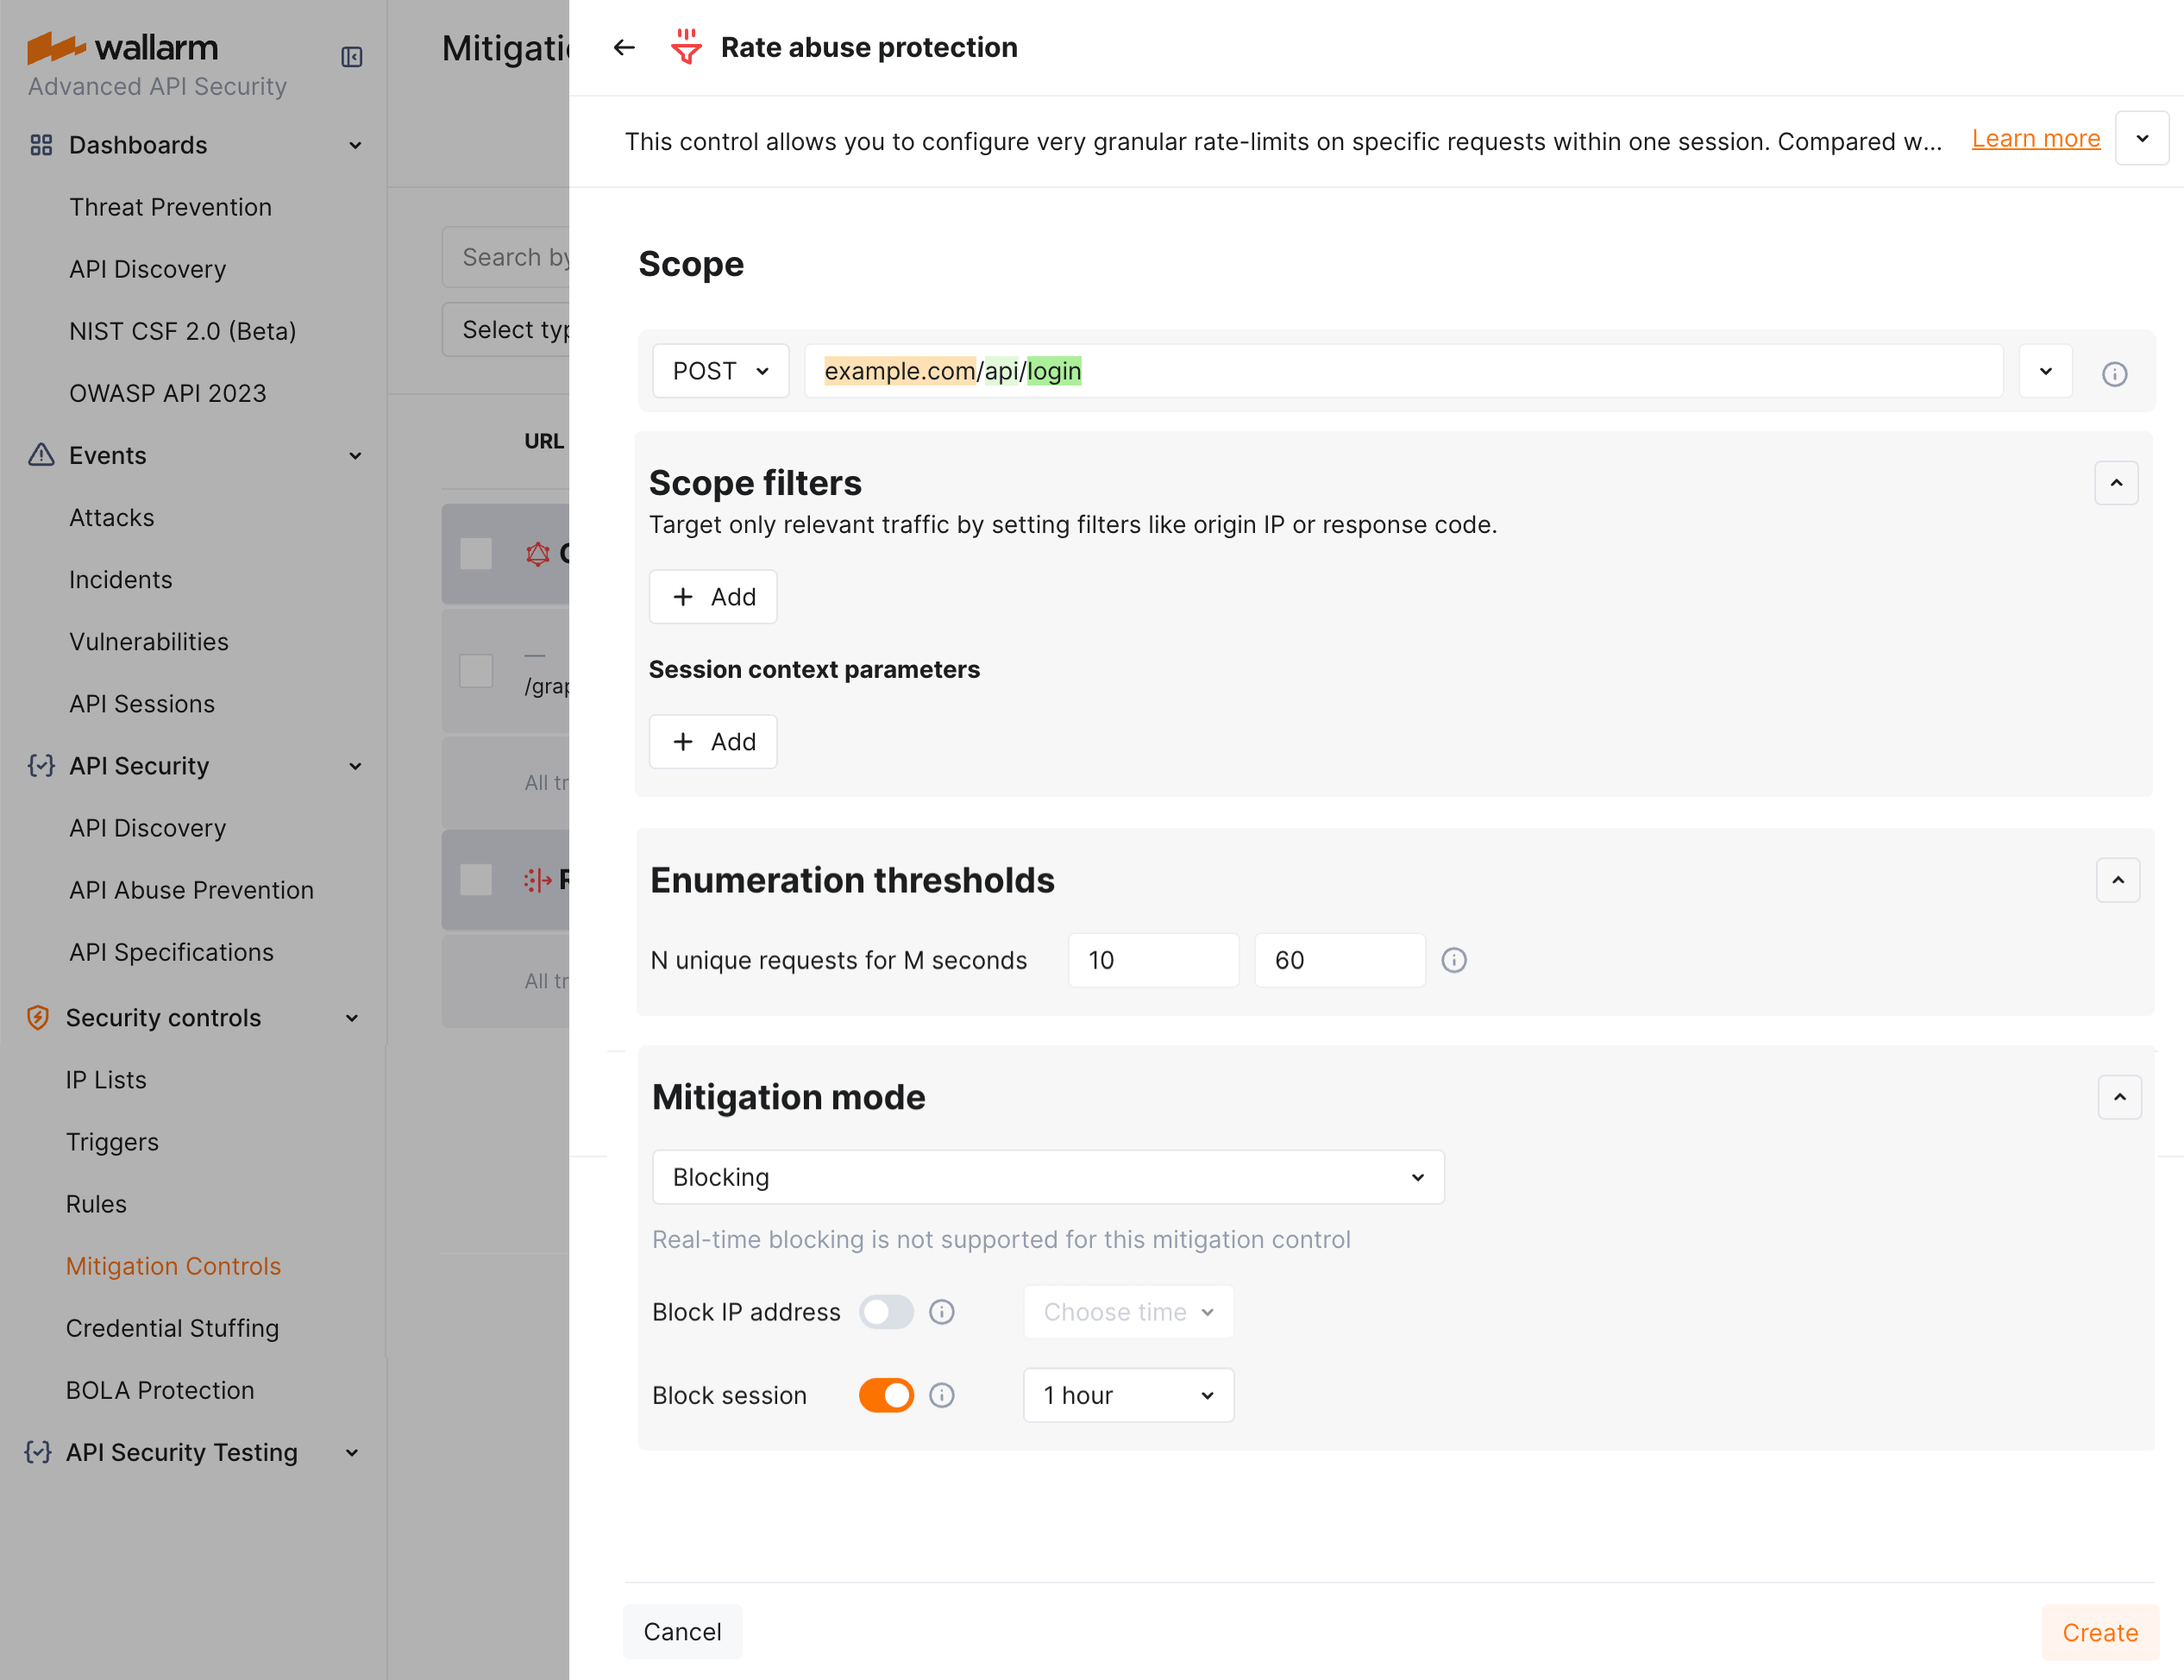
Rate abuse protection
The unrestricted resource consumption is included in the OWASP API Top 10 2023 list of most serious API security risks. Being a threat by itself (service slow-down or complete down by overload), this also serves as foundation to different attack types, for example, enumeration attacks. Allowing too many requests per time is one of the main causes of these risks.
Wallarm provides the new Rate abuse protection mitigation control to help prevent excessive traffic to your API.
API Specification Enforcement
In this latest update, we introduce API Specification Enforcement feature. This filters incoming traffic, permitting only requests that comply with your API specifications. Using the Wallarm node, which sits between clients and your applications, it compares endpoint descriptions in your specifications with actual API requests. Discrepancies, such as undefined endpoint requests or those with unauthorized parameters, are either blocked or monitored as configured.
This strengthens security by preventing potential attack attempts and also optimizes API performance by avoiding overloading and misuse.
Additionally, this update introduces new parameters for some deployment options, enabling technical control over the feature's operation:
-
For all-in-one installer: the
wallarm_enable_apifwNGINX directive. -
For NGINX Ingress Controller: the
controller.wallarm.apifirewallvalues group. -
For NGINX-based Docker image: the environment variable
WALLARM_APIFW_ENABLE.
Learn how to configure API Specification Enforcement
Detection of the new attack types
Wallarm detects new attack types:
-
Broken Object Level Authorization (BOLA), also known as Insecure Direct Object References (or IDOR), became one of the most common API vulnerabilities. When an application includes an IDOR / BOLA vulnerability, it has a strong probability of exposing sensitive information or data to attackers. All the attackers need to do is exchange the ID of their own resource in the API call with an ID of a resource belonging to another user. The absence of proper authorization checks enables attackers to access the specified resource. Thus, every API endpoint that receives an ID of an object and performs any type of action on the object can be an attack target.
To prevent exploitation of this vulnerability, Wallarm node contains a new trigger which you can use to protect your endpoints from BOLA attacks. The trigger monitors the number of requests to a specified endpoint and creates a BOLA attack event when thresholds from the trigger are exceeded.
-
During a Mass Assignment attack, attackers try to bind HTTP request parameters into program code variables or objects. If an API is vulnerable and allows binding, attackers may change sensitive object properties that are not intended to be exposed, which could lead to privilege escalation, bypassing security mechanisms, and more.
-
A successful SSRF attack may allow an attacker to make requests on behalf of the attacked web server; this potentially leads to revealing the network ports in use, scanning the internal networks, and bypassing authorization.
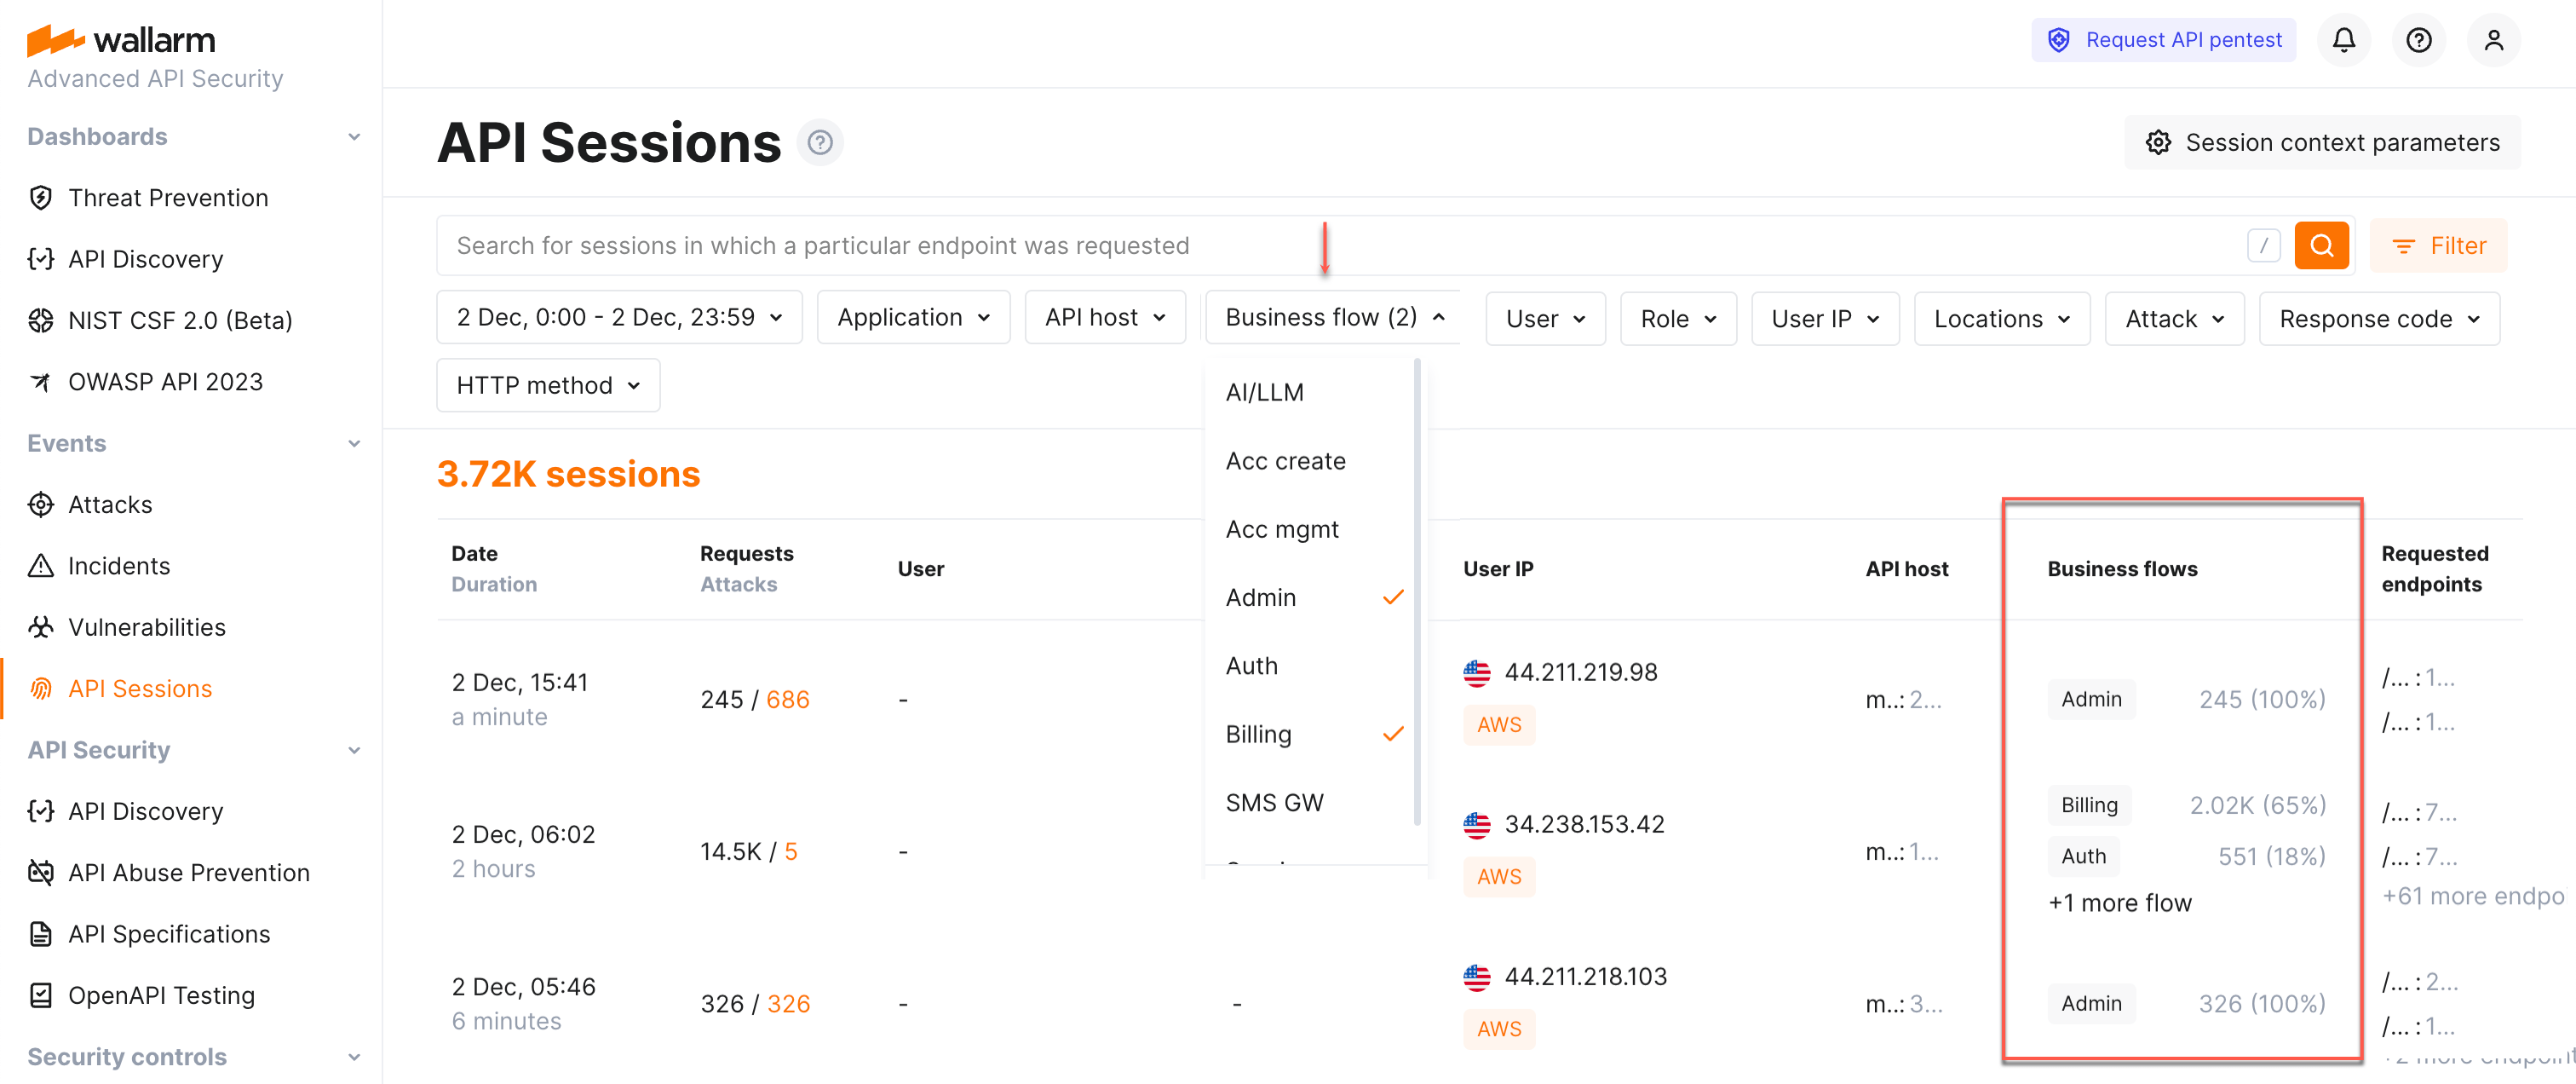
Sensitive business flows in API Discovery and API Sessions
With the sensitive business flow capability, Wallarm's API Discovery can automatically identify endpoints that are critical to specific business flows and functions, such as authentication, account management, billing, and similar critical capabilities.
This allows regular monitoring and audit of endpoints related to sensitive business flows for vulnerabilities or breaches and prioritizing them for development, maintenance, and security efforts.
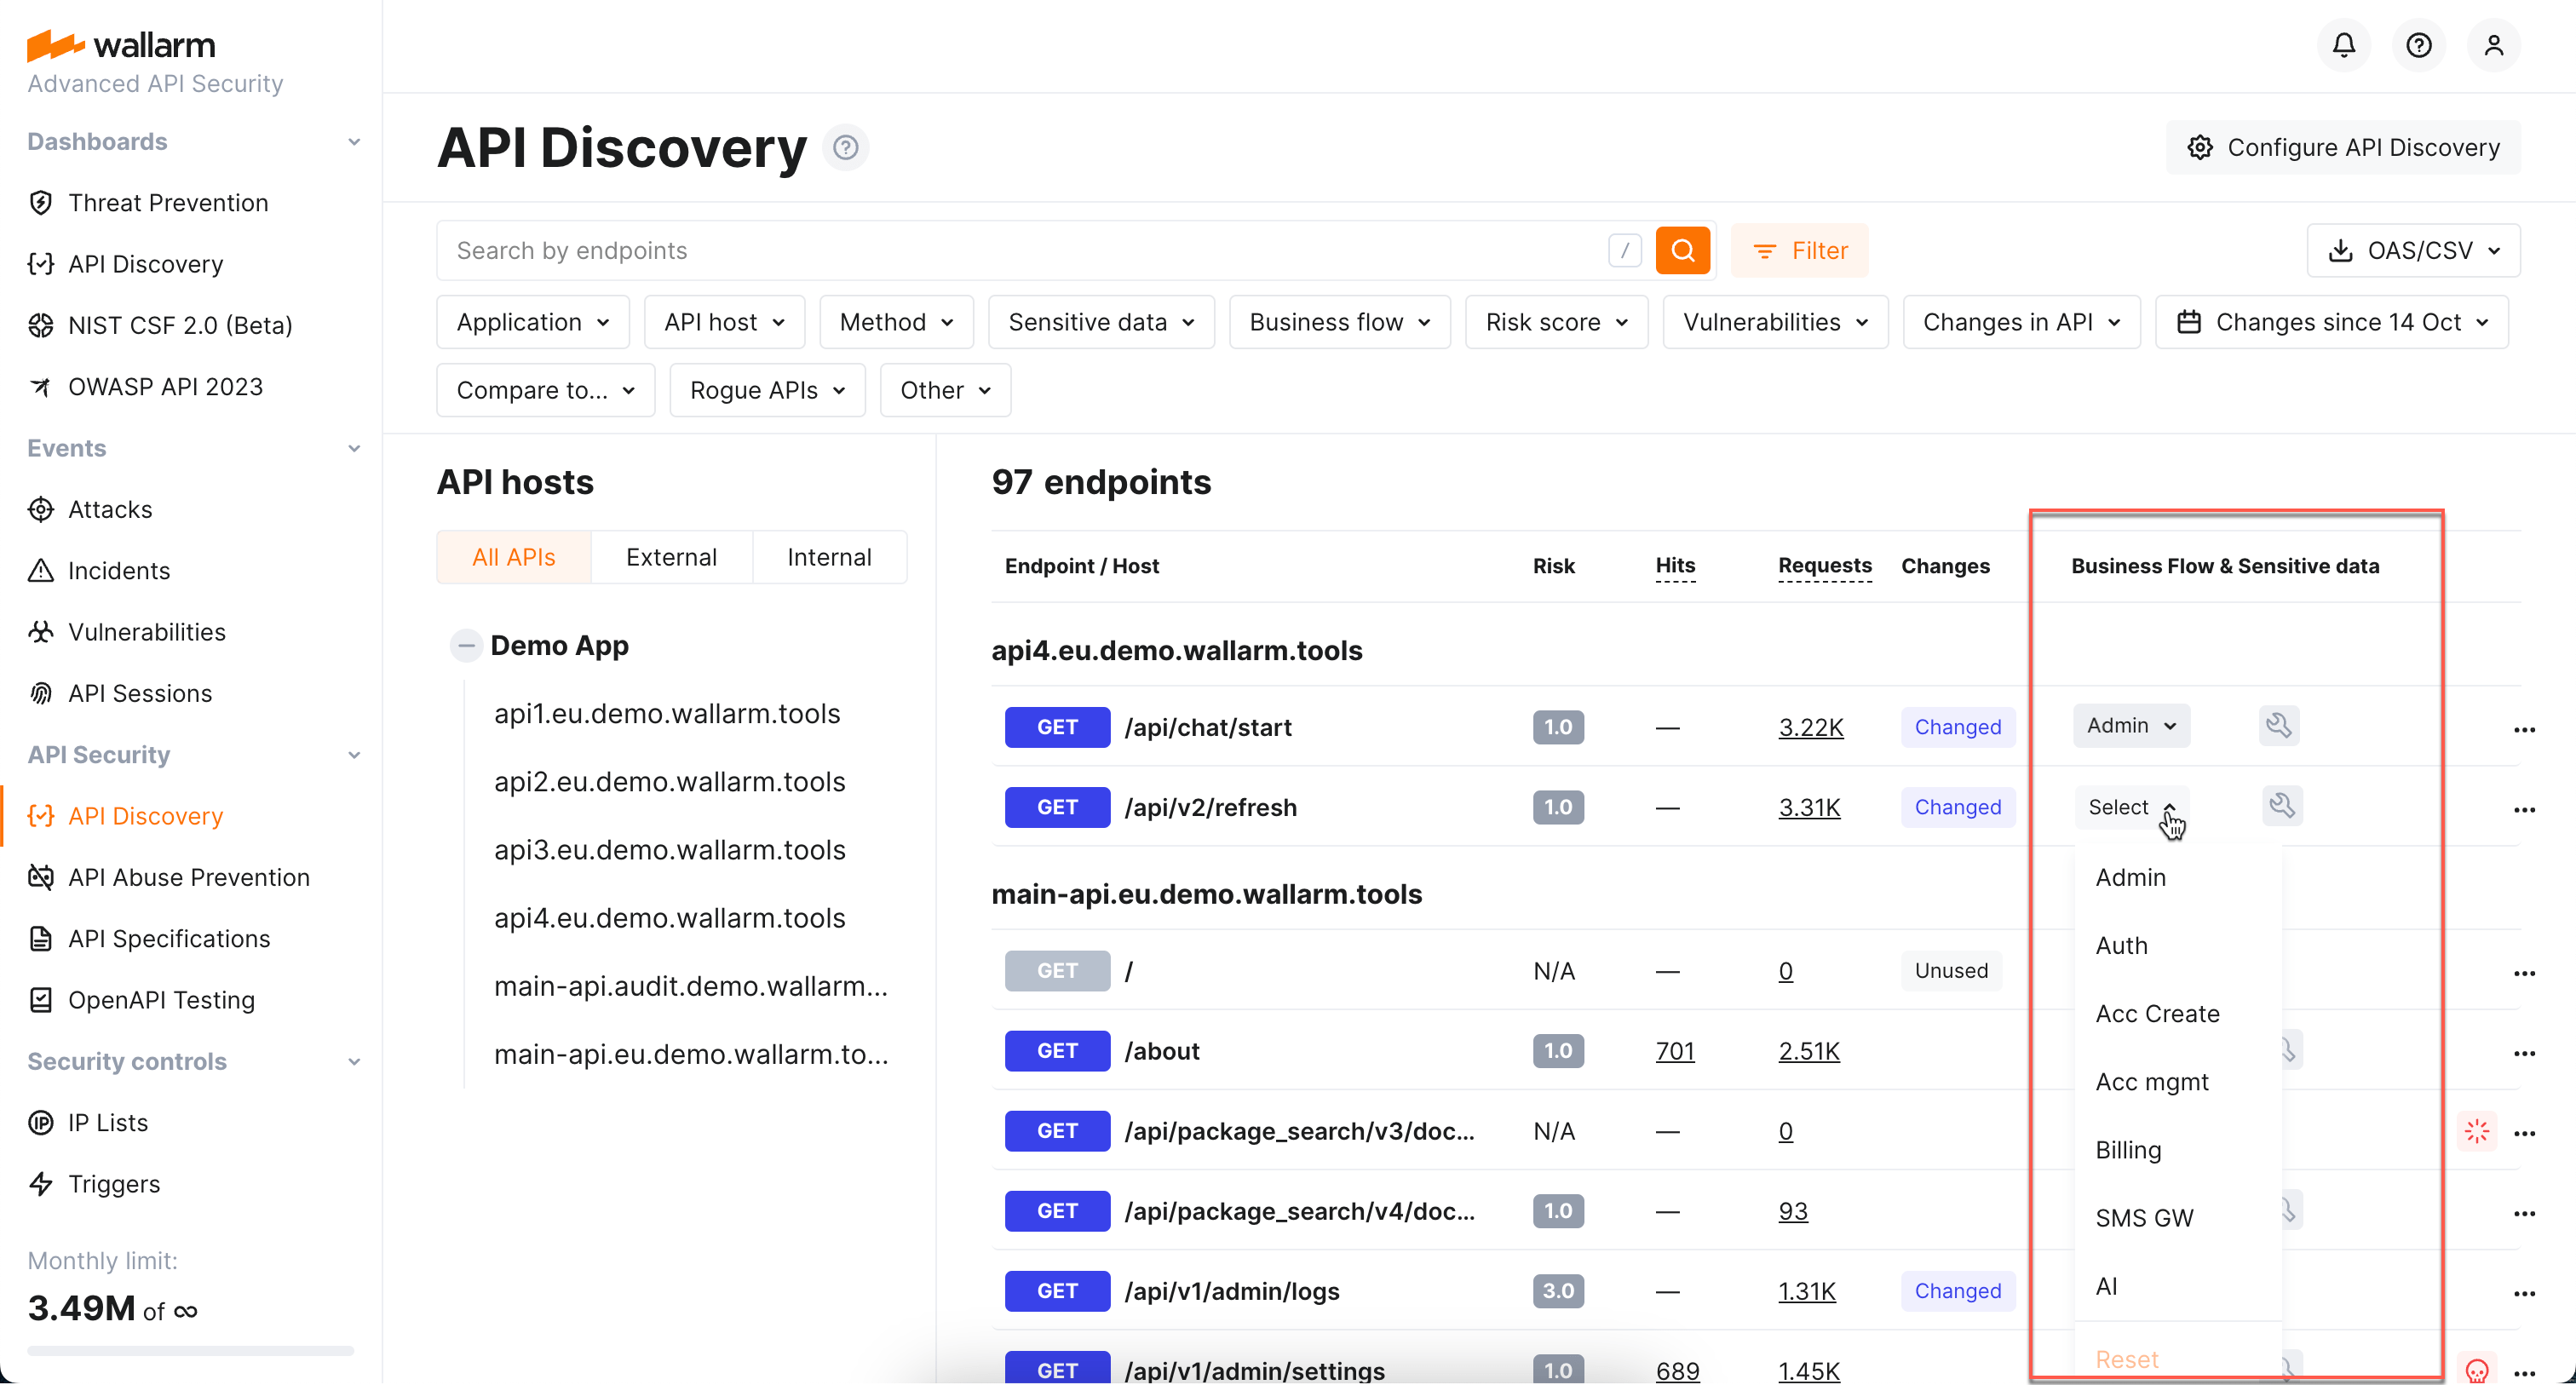
Identified sensitive business flows are propagated to Wallarm's API Sessions: if session's requests affect the endpoints that in API Discovery were tagged as important for some sensitive business flows, such session will be automatically tagged as affecting this business flow as well.
Once sessions are assigned with the sensitive business flow tags, it becomes possible to filter them by a specific business flow which makes it easier to select the sessions that are most important to analyze.
Full-fledged GraphQL parser
The full-fledged GraphQL parser is an enhancement significantly improving the detection of input validation attacks (e.g., SQL injections) within GraphQL requests, offering greater accuracy and minimal false positives.
Key benefits:
-
Improved detection of input validation attacks (e.g., SQL injections)
-
Detailed parameter insights: extract and display values of GraphQL request parameters in API Sessions, utilizing them as session context parameters.
-
Precise attack search: precisely identify attacks in specific GraphQL request components, such as arguments, directives, and variables.
-
Advanced rule application: apply granular protection rules to specific GraphQL request parts. This enables fine-tuning and configuring exclusions for certain attack types in defined parts of GraphQL request.
Checking JSON Web Token strength
JSON Web Token (JWT) is a popular authentication standard used to exchange data between resources like APIs securely. JWT compromisation is a common aim of attackers as breaking authentication mechanisms provides them full access to web applications and APIs. The weaker JWTs, the higher chance for it to be compromised.
Now, Wallarm detects the following JWT weaknesses:
-
Unencrypted JWTs
-
JWTs signed using compromised secret keys
Checking JSON Web Tokens for attacks
JSON Web Token (JWT) is one of the most popular authentication methods. This makes it a favorite tool to perform attacks (for example SQLi or RCE) that are very difficult to find because the data in the JWT is encoded and it can be located anywhere in the request.
Wallarm node finds the JWT anywhere in the request, decodes it and blocks (in the appropriate filtration mode) any attack attempts through this authentication method.
Supported installation options
-
Wallarm Ingress controller based on the Community Ingress NGINX Controller 1.11.5.
Instructions on migrating to the latest Wallarm Ingress controller →
-
Added support for AlmaLinux, Rocky Linux and Oracle Linux 8.x instead of the deprecated CentOS 8.x.
Wallarm node packages for the alternative operating systems will be stored in the CentOS 8.x repository.
-
Added support for Debian 11 Bullseye
-
Added support for Ubuntu 22.04 LTS (jammy)
-
Dropped support for CentOS 6.x (CloudLinux 6.x)
-
Dropped support for Debian 9.x
-
Dropped support for the operating system Ubuntu 16.04 LTS (xenial)
See the full list of supported installation options →
System requirements for the filtering node installation
-
Wallarm node instances now require access to the IP addresses below for downloading updates to attack detection rules and API specifications, as well as retrieving precise IPs for your allowlisted, denylisted, or graylisted countries, regions, or data centers.
-
The filtering node now uploads data to the Cloud using
us1.api.wallarm.com:443(US Cloud) andapi.wallarm.com:443(EU Cloud) instead ofus1.api.wallarm.com:444andapi.wallarm.com:444.If your server with the deployed node has a limited access to the external resources and the access is granted to each resource separately, after upgrade the synchronization between the filtering node and the Cloud will stop. The upgraded node needs to be granted access to the API endpoint with the new port.
Unified registration of nodes in the Wallarm Cloud by API tokens
With the new release of Wallarm node, email-password based registration of Wallarm nodes in the Cloud has been removed. It is now mandatory to switch to the new API token-based node registration method to continue with the newer node versions.
The new release enables you to register the Wallarm node in the Wallarm Cloud by the API token on any supported platform, which ensures a more secure and faster connection to the Wallarm Cloud as follows:
-
Dedicated user accounts of the Deploy role allowing only to install the node are no longer required.
-
Users' data remains securely stored in the Wallarm Cloud.
-
Two-factor authentication enabled for the user accounts does not prevent nodes from being registered in the Wallarm Cloud.
-
The initial traffic processing and request postanalytics modules deployed to separate servers can be registered in the Cloud by one node token.
Changes in node registration methods result in some updates in node types:
-
The script to be run on the server to register the node is named
register-node. Previously, the Wallarm node named cloud node supported registration by the token but with the different script namedaddcloudnode.The cloud node is not required to be migrated to the new deployment process.
-
The regular node supporting the registration by "email-password" passed to the
addnodescript is deprecated.
Now, registration of the node looks as follows:
-
Proceed to Wallarm Console → Settings → API tokens.
-
Generate the token with the Node deployment/Deployment usage type.
-
Run the required deployment artifact of the node with the API token passed in the corresponding parameters.
Regular node support
The regular node type is deprecated and will be removed in future releases.
Terraform module to deploy Wallarm on AWS
You can now easily deploy Wallarm to AWS from the Infrastructure as Code (IaC)-based environment using the Wallarm Terraform module.
The Wallarm Terraform module is the scalable solution meeting the best industry standards of security and failover ensuring. This is designed for deploying Wallarm as proxy.
Documentation on the Wallarm Terraform module for AWS
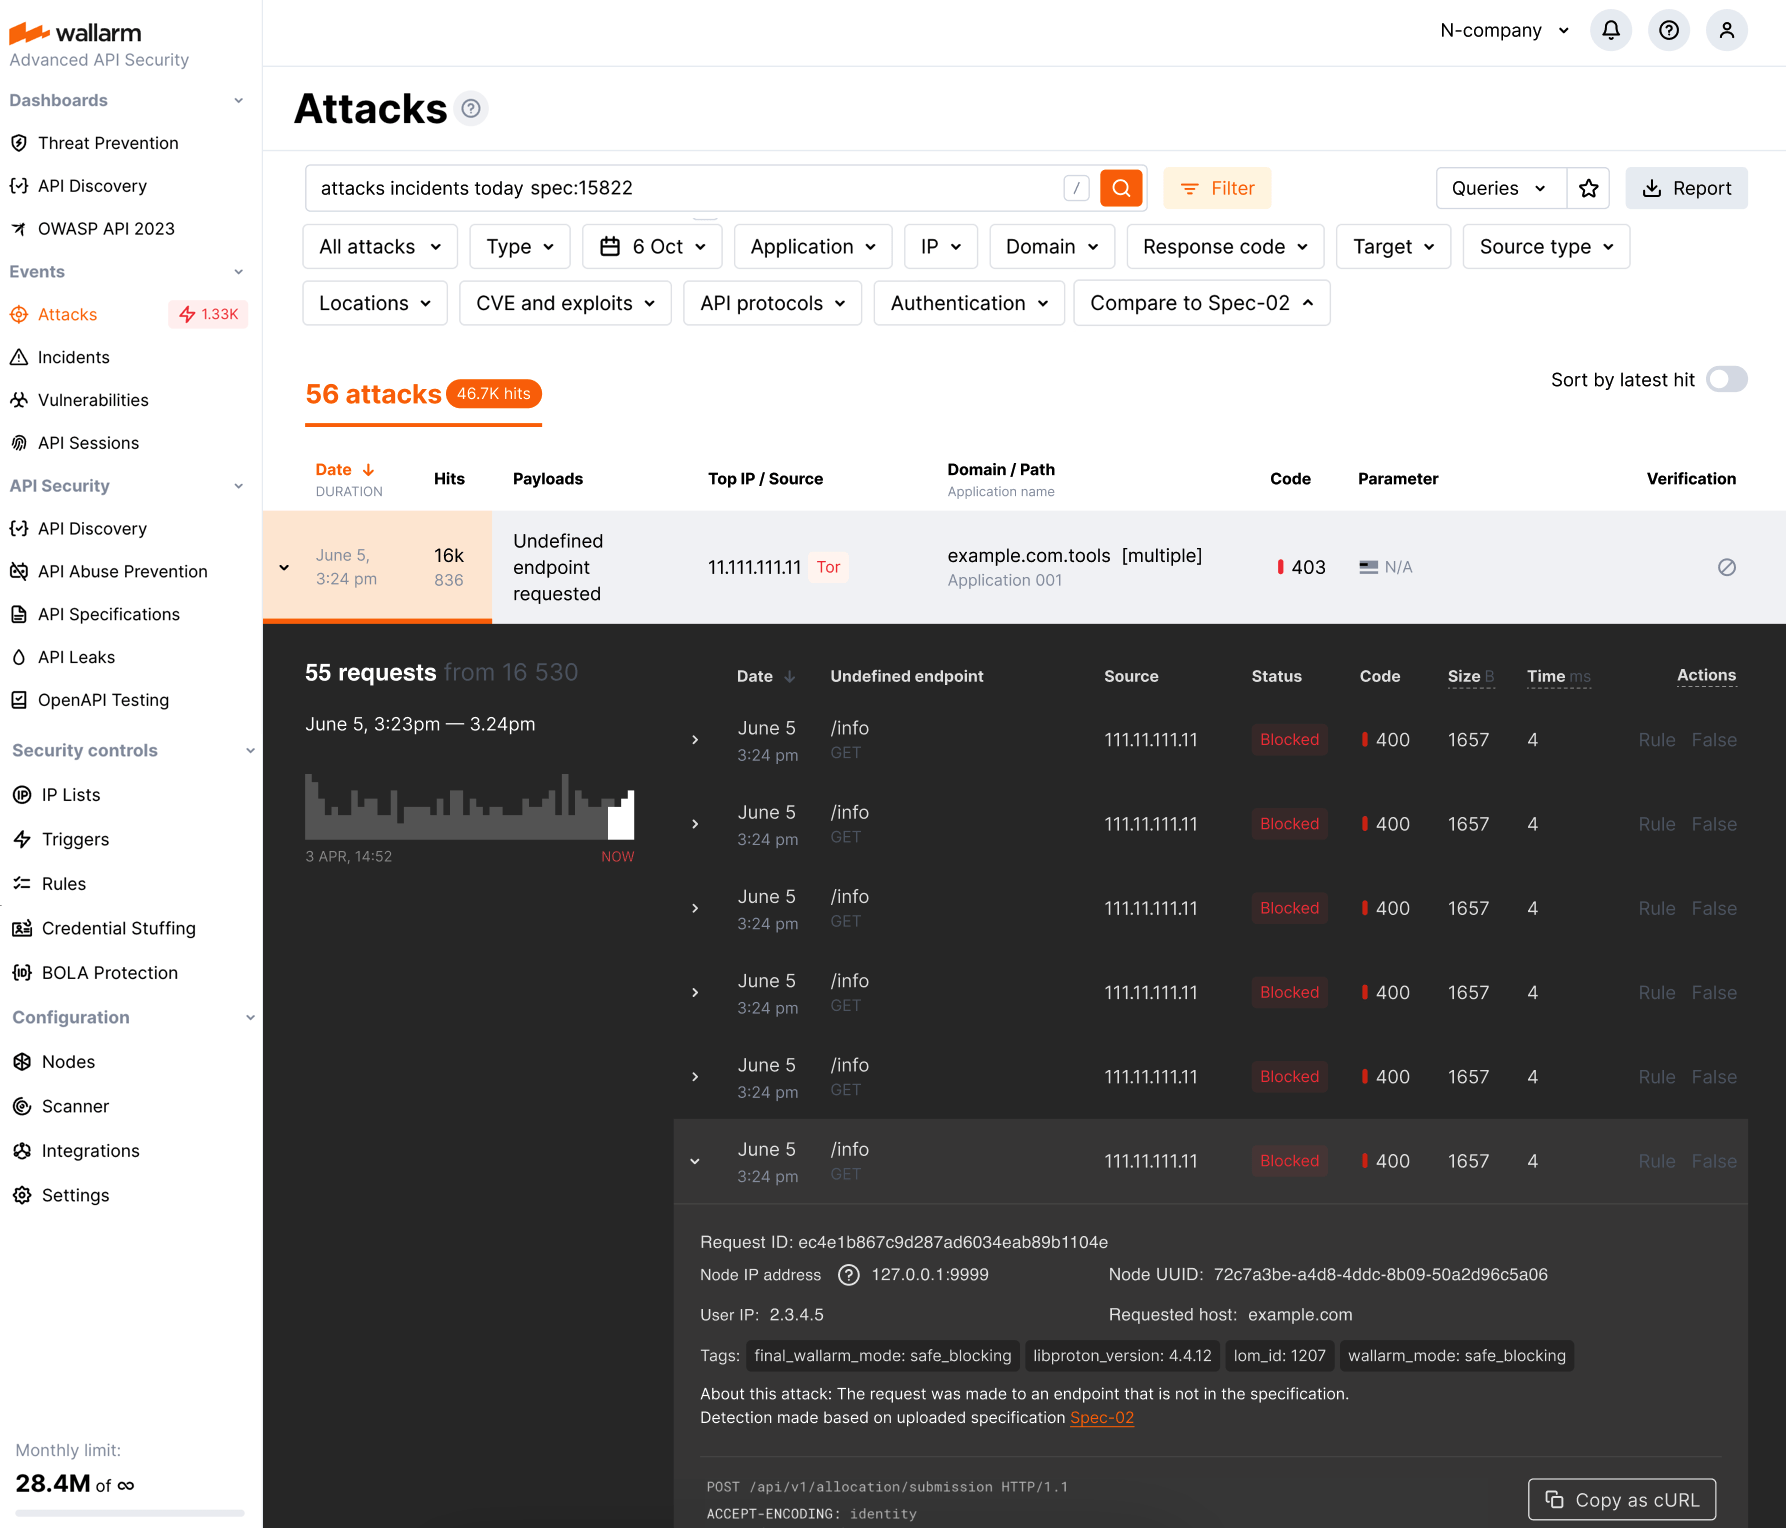
Collecting statistics on blocked requests from denylisted sources
The Wallarm NGINX‑based filtering nodes now collect statistics on requests that have been blocked when their source is found in the denylist, enhancing your ability to evaluate attack strength. This includes access to the blocked request statistics and their samples, helping you minimize unnoticed activity. You can find this data in the Wallarm Console UI's Attacks section.
When using automatic IP blocking (e.g., with the brute force trigger configured), now you can analyze both the initial triggering requests and the samples of subsequent blocked requests. For requests blocked due to manual denylisting of their sources, the new functionality enhances visibility into blocked source actions.
We have introduced new search tags and filters within the Attacks section to effortlessly access the newly introduced data:
-
Utilize the
blocked_sourcesearch to identify requests that were blocked due to manual denylisting of IP addresses, subnets, countries, VPNs, and more. -
Employ the
multiple_payloadssearch to pinpoint requests blocked by the Number of malicious payloads trigger. This trigger is designed to denylist sources that originate malicious requests containing multiple payloads, a common characteristic of multi-attack perpetrators. -
Additionally, the
api_abuse,brute,dirbust, andbolasearch tags now encompass requests whose sources were automatically added to the denylist by the relevant Wallarm triggers for their respective attack types.
This change introduces the new configuration parameters which by default are set to on to enable the functionality but can be switched to off to disable it:
-
The
wallarm_acl_export_enableNGINX directive. -
The
controller.config.wallarm-acl-export-enablevalue for the NGINX Ingress controller chart. -
The
config.wallarm.aclExportEnablechart value andsidecar.wallarm.io/wallarm-acl-export-enablepod's annotation for the Sidecar Controller solution.
Wallarm AWS image distributed with the ready-to-use cloud-init.py script
If following the Infrastructure as Code (IaC) approach, you may need to use the cloud-init script to deploy the Wallarm node to AWS. Now, Wallarm distributes its AWS cloud image with the ready‑to‑use cloud-init.py script.
Specification of the Wallarm cloud-init script
Simplified multi-tenant node configuration
For the multi-tenant nodes, tenants and applications are now defined each with its own directive:
-
The
wallarm_partner_client_uuidNGINX directive have been added to configure the unique identifier of a tenant. -
The
wallarm_applicationNGINX directive behavior has been changed. Now it is only used to configure an application ID.
Instructions on the multi-tenant node upgrade
Filtration modes
-
New safe blocking filtration mode.
This mode enables a significant reduction of false positive number by blocking only malicious requests originating from graylisted IP addresses.
-
Analysis of request sources is now performed only in the
safe_blockingandblockmodes.- If the Wallarm node operating in the
offormonitoringmode detects the request originating from the denylisted IP, it does not block this request. - Wallarm node operating in the
monitoringmode uploads all the attacks originating from the allowlisted IP addresses to the Wallarm Cloud.
- If the Wallarm node operating in the
More details on Wallarm node modes →
Request source control
The following parameters for request source control have been deprecated:
-
All
aclNGINX directives and environment variables used to configure IP address denylist. Manual configuration of IP denylisting is no longer required.
There are the following new features for request source control:
-
Wallarm Console section for full IP address allowlist, denylist and graylist control.
-
Support for new filtration mode
safe_blockingand IP address graylists.The safe blocking mode enables a significant reduction of false positive number by blocking only malicious requests originating from graylisted IP addresses.
For automatic IP address graylisting, a newly released Number of malicious payloads trigger can be used.
-
Automated allowlisting of Wallarm's vulnerability scanning IPs used for scanning company resources for vulnerabilities and launching additional security tests. Manual allowlisting of these addresses is no longer required.
-
Ability to allowlist, denylist, or graylist a subnet, Tor network IPs, VPN IPs, a group of IP addresses registered in a specific country, region, or data center.
-
Ability to allowlist, denylist, or graylist request sources for specific applications.
-
New NGINX directive
disable_aclto disable request origin analysis.
Details on adding IPs to the allowlist, denylist, and graylist →
New module for API inventory discovery
New Wallarm nodes are distributed with the module API Discovery automatically identifying the application API. The module is disabled by default.
Details on the API Discovery module →
Enhanced attack analysis with the libdetection library
Attack analysis performed by Wallarm has been enhanced by involving an additional attack validation layer. Wallarm node in all form-factors are distributed with the libdetection library enabled by default. This library performs secondary fully grammar-based validation of all SQLi attacks reducing the number of false positives detected among SQL injections.
Memory consumption increase
With the libdetection library enabled, the amount of memory consumed by NGINX and Wallarm processes may increase by about 10%.
Details on how Wallarm detects attacks →
The rule enabling the overlimit_res attack detection fine-tuning
We have introduced the new rule allowing the overlimit_res attack detection fine-tuning.
The overlimit_res attack detection fine-tuning via the NGINX configuration files is considered to be the deprecated way:
-
The rule allows setting up a single request processing time limit as the
wallarm_process_time_limitNGINX directive did before. -
The rule allows to block or pass the
overlimit_resattacks in accordance with the node filtration mode instead of thewallarm_process_time_limit_blockNGINX directive configuration.
The listed directives and parameters have been deprecated and will be deleted in future releases. It is recommended to transfer the overlimit_res attack detection configuration from directives to the rule before. Relevant instructions are provided for each node deployment option.
If the listed parameters are explicitly specified in the configuration files and the rule is not created yet, the node processes requests as set in the configuration files.
Optimized and more secure NGINX-based Docker image
The Docker image of Wallarm's NGINX-based filtering node has been revamped for enhanced security and optimization. Key updates include:
-
The Docker image is now built on Alpine Linux, replacing Debian, to provide a more secure and lightweight artifact. Please note that the
auth-pamandsubs-filterNGINX modules, previously included, are no longer packaged with the Docker image. -
Updated to the latest stable version of NGINX, 1.28.0, replacing the previous 1.14.x version. Although most vulnerabilities in 1.14.x were patched by the Debian team (the prior image was based on Debian 10.x), upgrading to 1.28.0 addresses remaining vulnerabilities for improved security.
The NGINX upgrade, along with the switch to Alpine Linux, resolves the HTTP/2 Rapid Reset Vulnerability (CVE-2023-44487), due to the Alpine-specific patch implemented in NGINX 1.28.0.
-
Support for processors with ARM64 architecture, which is automatically identified during the installation process.
-
Inside the Docker container, all operations now utilize the non-root user
wallarm, a change from the previousrootuser setup. It affects the NGINX process as well. -
The
/wallarm-statusendpoint has been updated to export metrics in the Prometheus format, instead of JSON. This applies specifically when accessing the endpoint from outside the Docker container. Note that theWALLARM_STATUS_ALLOWenvironment variable must be set appropriately for this functionality. -
The Docker image is now built using the all-in-one installer, which changes its internal directory structure:
- Log file directory:
/var/log/wallarm→/opt/wallarm/var/log/wallarm. - Directory with files containing credentials for the Wallarm node to connect to the Cloud:
/etc/wallarm→/opt/wallarm/etc/wallarm.
- Log file directory:
-
The path to the
/usr/sharedirectory →/opt/wallarm/usr/share.This introduces the new path to the sample blocking page, located at
/opt/wallarm/usr/share/nginx/html/wallarm_blocked.html.
The newly released product features are also supported by the new NGINX-based Docker image of the new format.
Optimized cloud images
The Amazon Machine Image (AMI) and Google Cloud Machine Image have been optimized. Key updates include:
-
The cloud images now use Debian 12.x (bookworm), the latest stable release, replacing the deprecated Debian 10.x (buster) for enhanced security.
-
Updated to the newer version of NGINX, 1.22.1, replacing the previous 1.14.x version.
-
Support for processors with ARM64 architecture, which is automatically identified during the installation process.
-
The cloud images are now built using the all-in-one installer, which changes its internal directory structure:
- Node registration script:
/usr/share/wallarm-common/register-node→/opt/wallarm/usr/share/wallarm-common/cloud-init.py. - Log file directory:
/var/log/wallarm→/opt/wallarm/var/log/wallarm. - Directory with files containing credentials for the Wallarm node to connect to the Cloud:
/etc/wallarm→/opt/wallarm/etc/wallarm. -
The path to the
/usr/sharedirectory →/opt/wallarm/usr/share.This introduces the new path to the sample blocking page, located at
/opt/wallarm/usr/share/nginx/html/wallarm_blocked.html. -
The
/etc/nginx/conf.d/wallarm.conffile with the global Wallarm filtering node settings has been removed.
- Node registration script:
The newly released product features are also supported by the cloud images of the new format.
New blocking page
The sample blocking page /usr/share/nginx/html/wallarm_blocked.html has been updated. In the new node version, it has new layout and supports the logo and support email customization.
New blocking page with the new layout looks as follows by default:
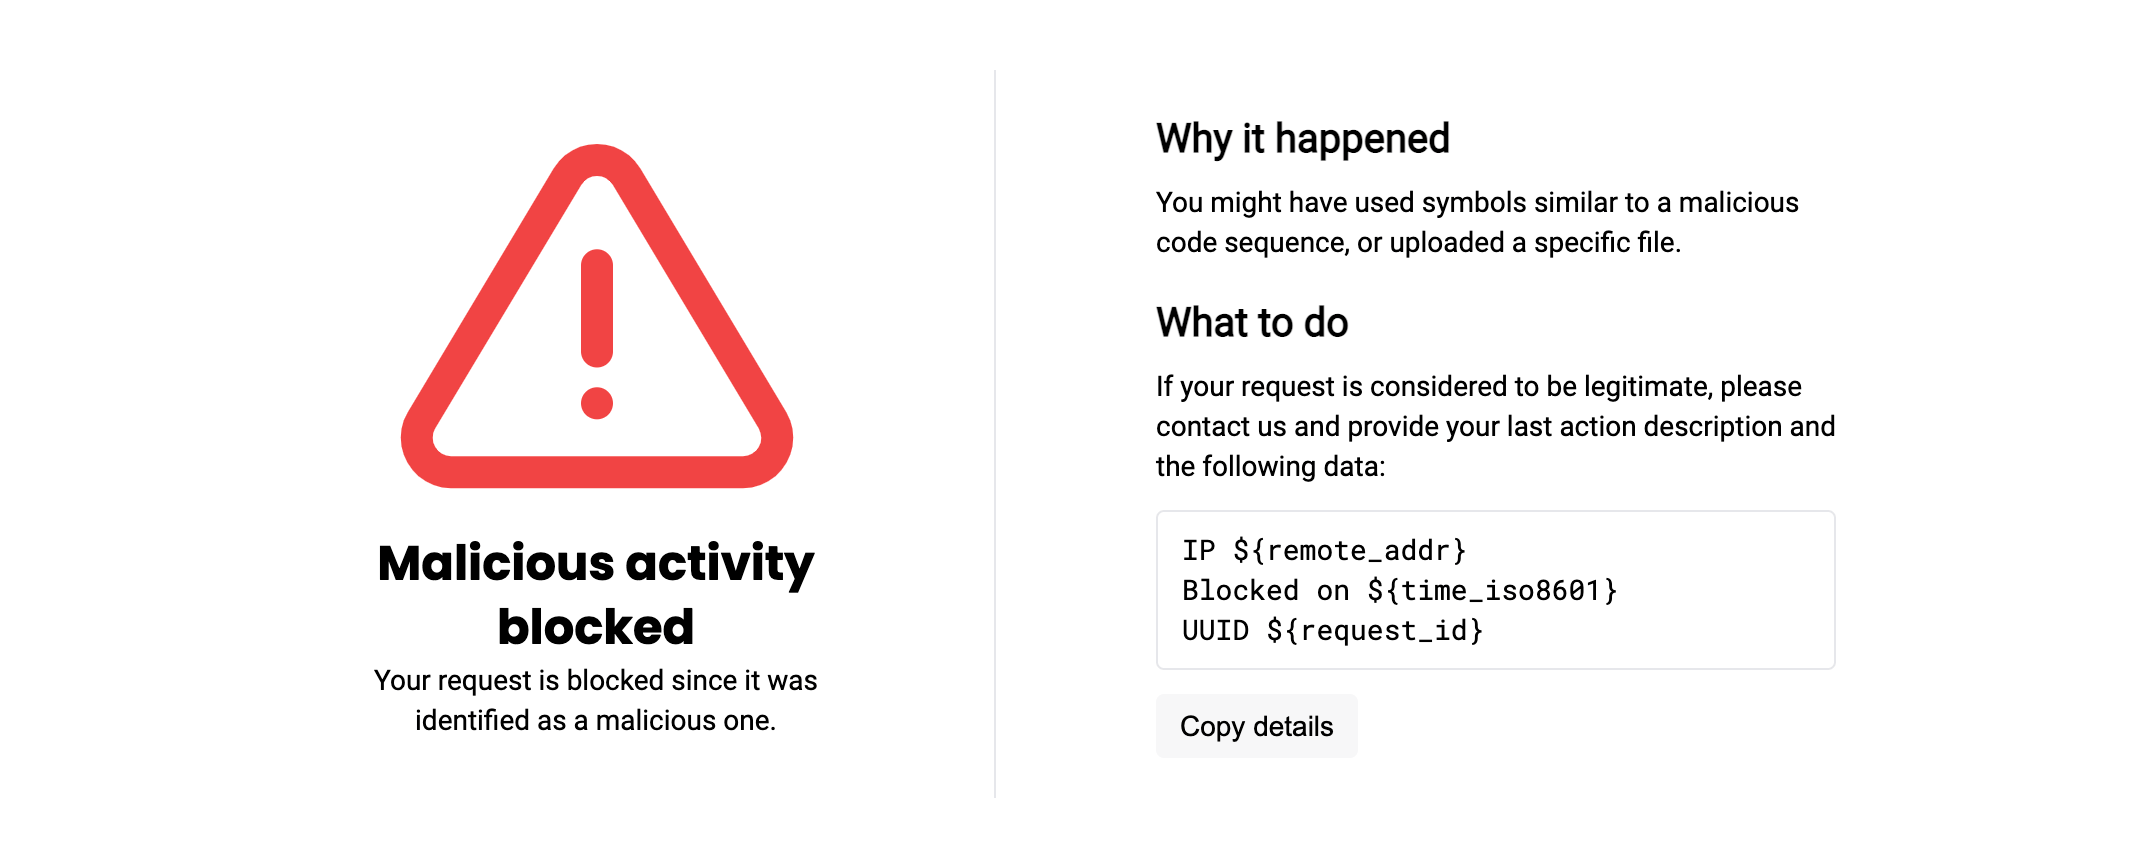
More details on the blocking page setup →
New parameters for basic node setup
-
New environment variables to be passed to the Wallarm NGINX‑based Docker container:
WALLARM_APPLICATIONto set the identifier of the protected application to be used in the Wallarm Cloud.NGINX_PORTto set a port that NGINX will use inside the Docker container.
Instructions on deploying the Wallarm NGINX‑based Docker container →
-
New parameters of the file
node.yamlto configure the synchronization of the Wallarm Cloud and filtering nodes:api.local_hostandapi.local_port. New parameters allow specifying a local IP address and port of the network interface to send requests to Wallarm API through.
Disabling IPv6 connections for the NGINX-based Wallarm Docker container
The NGINX-based Wallarm Docker image now supports the new environment variable DISABLE_IPV6. This variable enables you to prevent NGINX from IPv6 connection processing, so that it only can process IPv4 connections.
Renamed parameters, files and metrics
-
The following NGINX directives have been renamed:
wallarm_instance→wallarm_applicationwallarm_local_trainingset_path→wallarm_custom_ruleset_pathwallarm_global_trainingset_path→wallarm_protondb_pathwallarm_ts_request_memory_limit→wallarm_general_ruleset_memory_limit
Parameters with previous names are still supported but will be deprecated in future releases. The parameter logic has not changed.
-
The Ingress annotation
nginx.ingress.kubernetes.io/wallarm-instancehas been renamed tonginx.ingress.kubernetes.io/wallarm-application.The annotation with the previous name is still supported but will be deprecated in future releases. The annotation logic has not changed.
-
The file with the custom ruleset build
/etc/wallarm/lomhas been renamed to/etc/wallarm/custom_ruleset. In the file system of new node versions, there is only the file with the new name.The default value of the NGINX directive
wallarm_custom_ruleset_pathhas been changed appropriately. New default value is/etc/wallarm/custom_ruleset. -
The private key file
/etc/wallarm/license.keyhas been renamed to/etc/wallarm/private.key. The new name is used by default.
Parameters of the statistics service
-
The Prometheus metric
wallarm_custom_ruleset_idhas been enhanced with the addition of aformatattribute. This new attribute represents the custom ruleset format. Meanwhile, the principal value continues to be the custom ruleset build version. Here is an example of the updatedwallarm_custom_ruleset_idvalue: -
The Wallarm statistics service returns the new
rate_limitparameters with the Wallarm rate limiting module data. New parameters cover rejected and delayed requests, as well as indicate any problems with the module's operation. -
The number of requests originating from denylisted IPs is now displayed in the statistic service output, in the new parameter
blocked_by_acland in the existing parametersrequests,blocked. -
The service return one more new parameter
custom_ruleset_verwhich points to the custom ruleset format being used by Wallarm nodes. -
The following node statistics parameters have been renamed:
lom_apply_time→custom_ruleset_apply_timelom_id→custom_ruleset_id
In new node versions, the
http://127.0.0.8/wallarm-statusendpoint temporarily returns both the deprecated and new parameters. The deprecated parameters will be removed from the service output in future releases.
Details on the statistics service →
New variables to configure the node logging format
The following node logging variables have been changed:
-
wallarm_request_timehas been renamed towallarm_request_cpu_timeThis variable means time in seconds the CPU spent processing the request.
The variable with the previous name is deprecated and will be removed in future releases. The variable logic has not changed.
-
wallarm_request_mono_timehas been addedThis variable means time in seconds the CPU spent processing the request + time in the queue.
Increasing the performance by omitting attack search in requests from denylisted IPs
The new wallarm_acl_access_phase directive enables you to increase the Wallarm node performance by omitting the attack search stage during the analysis of requests from denylisted IPs. This configuration option is useful if there are many denylisted IPs (e.g. the whole countries) producing high traffic that heavily loads the working machine CPU.
Easy grouping for node instances
Now you can easily group node instances using one API token with the Node deployment/Deployment usage type for their installation together with the WALLARM_LABELS variable and its group label.
For example:
docker run -d -e WALLARM_API_TOKEN='<API TOKEN WITH DEPLOY ROLE>' -e NGINX_BACKEND='example.com' -e WALLARM_API_HOST='us1.api.wallarm.com' -e WALLARM_LABELS='group=<GROUP>' -p 80:80 wallarm/node:6.3.0
...will place node instance into the
<GROUP> instance group (existing, or, if does not exist, it will be created). Addressed vulnerabilities
The new releases address multiple high and critical severity vulnerabilities in Wallarm deployment artifacts, enhancing the software's security posture by replacing previously vulnerable components.
Among the vulnerabilities addressed are those identified by CVE-2020-36327, CVE-2023-37920, and several others.
HTTP/2 stream length control directive
The wallarm_http_v2_stream_max_len directive to control the maximum length of HTTP/2 streams has been introduced. It helps in preventing excessive memory consumption in long-lived gRPC connections.
To use this variable in a Docker container, specify it in your NGINX configuration file and mount the file into the container.
Distinct search tags for Account Takeover, Scraping and Security Crawlers
Distinct search tags for the account_takeover, scraping, and security_crawlers attack types have been introduced, improving specificity over the previous general api_abuse tag.
Native Node for connectors and TCP traffic mirror
We are excited to introduce the Native Node, a new deployment option for the Wallarm Node that operates independently of NGINX. This solution was developed for environments where NGINX is not required or where a platform-agnostic approach is preferred.
Currently, it is tailored for the following deployments:
-
MuleSoft, Cloudflare, CloudFront, Broadcom Layer7 API Gateway, Fastly connectors with both request and response analysis
-
Kong API Gateway and Istio Ingress connectors
-
TCP traffic mirror analysis
Replacing Tarantool with wstore for postanalytics
Wallarm Node now uses wstore, a Wallarm-developed service, instead of Tarantool for local postanalytics processing. As a result:
-
All-in-one installer, AWS/GCP images:
-
The NGINX directive
wallarm_tarantool_upstream, which defines the postanalytics module server address when deployed separately from other NGINX services, has been renamed towallarm_wstore_upstream.Backward compatibility preserved with a deprecation warning:
2025/03/04 20:43:04 [warn] 3719#3719: "wallarm_tarantool_upstream" directive is deprecated, use "wallarm_wstore_upstream" instead in /etc/nginx/nginx.conf:19
* Log file renamed:/opt/wallarm/var/log/wallarm/tarantool-out.log→/opt/wallarm/var/log/wallarm/wstore-out.log.
* The new wstore configuration file/opt/wallarm/wstore/wstore.yamlreplaces obsolete Tarantool configuration files such as/etc/default/wallarm-tarantoolor/etc/sysconfig/wallarm-tarantool.
* Thetarantoolsection in/opt/wallarm/etc/wallarm/node.yamlis nowwstore. Backward compatibility preserved with a deprecation warning.
-
-
- All the above changes are applied within the container.
- Previously, memory for Tarantool was allocated via the
TARANTOOL_MEMORY_GBenvironment variable. Now, memory allocation follows the same principle but uses a new variable:TARANTOOL_MEMORY_GB→SLAB_ALLOC_ARENA. -
Adjusted the container's directory structure to align with Alpine Linux conventions. Specifically:
- Content from
/etc/nginx/modules-availableand/etc/nginx/modules-enabledhas been moved to/etc/nginx/modules. - Content from
/etc/nginx/sites-availableand/etc/nginx/sites-enabledhas been moved to/etc/nginx/http.d.
- Content from
-
The default
allowvalue, specifying permitted IP addresses for the/wallarm-statusservice, is now 127.0.0.0/8 instead of 127.0.0.8/8.
-
Kubernetes Ingress Controller:
- Tarantool is no longer a separate pod, wstore runs within the main
<CHART_NAME>-wallarm-ingress-controller-xxxpod. - Helm values renamed:
controller.wallarm.tarantool→controller.wallarm.postanalytics.
- Tarantool is no longer a separate pod, wstore runs within the main
-
Kubernetes Sidecar Controller:
- Helm values renamed:
postanalytics.tarantool.*→postanalytics.wstore.*. -
The following Docker images have been removed from the Helm chart for Sidecar deployment:
These images have been replaced by the wallarm/node-helpers image, which now runs the relevant services.
- Helm values renamed:
The described changes are incorporated into the Node upgrade instructions provided below.
Upgrade process
-
Upgrade installed modules following the instructions for your Wallarm node deployment option:
-
Upgrading modules for NGINX, NGINX Plus with all-in-one installer
To improve and simplify the upgrade process, upgrading of all node versions is performed using Wallarm's all-in-one installer. Manual upgrade with individual Linux packages is not supported any more.
- Upgrading NGINX Ingress controller with integrated Wallarm modules
- Cloud node image
- Multi-tenant node
-
-
Migrate allowlist and denylist configuration from previous Wallarm node versions to the latest.